Synthetic monitoring is a proactive way to test applications by running scripted checks that mimic real user actions. Teams use it to confirm that key paths are up and responding, often catching issues before users notice them. Downtime is expensive, with companies in the Global 2000 losing an estimated $400B annually. Large enterprises lose hundreds of billions of dollars each year due to outages, and for many companies, a single incident can translate into tens of millions in lost revenue.
In real systems, failures rarely come from missing synthetic checks. The bigger problem is that surface-level tests keep passing while deeper dependencies slowly break. APIs may degrade, databases may lag, or third-party services may slow down, yet the synthetic scripts still report everything as healthy. Teams usually don’t know something is wrong until users start to complain.
Because synthetic monitoring only validates what it is explicitly told to test, it should be treated as an early signal, not a complete picture. In modern observability setups, it works best alongside real user monitoring and backend telemetry, where logs, metrics, and traces reveal what synthetic checks cannot.
What is Synthetic Monitoring?
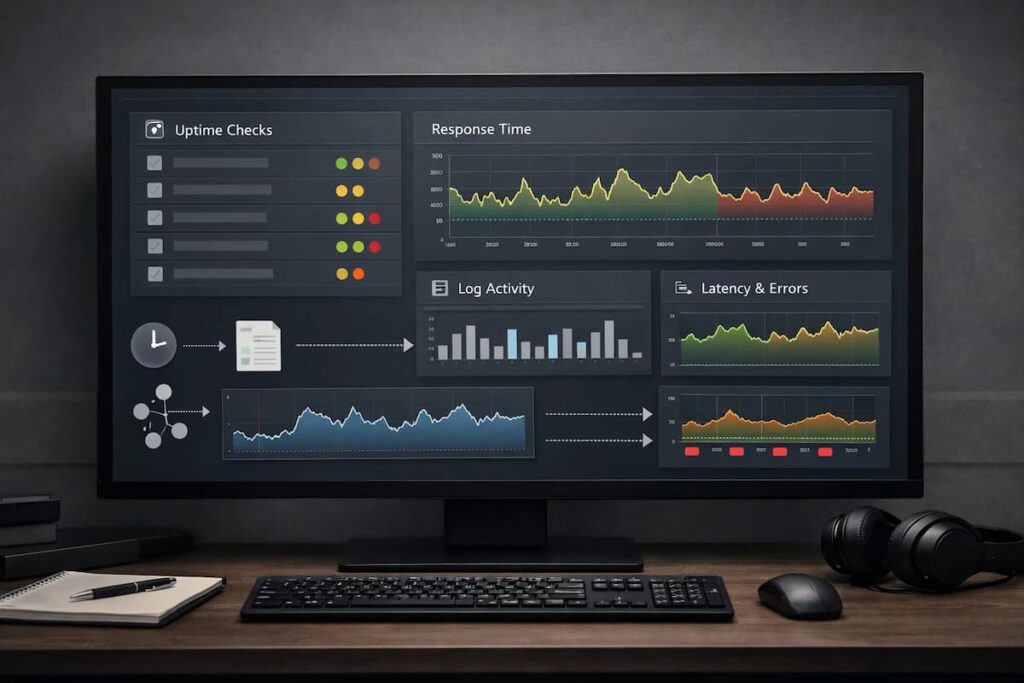
Synthetic monitoring simulates user interactions by running proactive tests on websites, applications, and APIs from different locations. Guarantees the availability and performance of web applications before real users encounter issues.
Unlike real user monitoring (RUM), synthetic monitoring is proactive because it doesn’t rely on real users to detect issues. Because synthetics do not require real traffic, they showcase availability and performance risks during off-peak hours, after a hotfix, or before a geo rollout.
How synthetic monitoring works conceptually
Synthetic monitoring tests a system to identify issues before they impact users. You define a set of actions that represent how your system should behave, such as calling an API, loading a page, or completing a basic workflow. These checks run on a schedule from known locations and environments.
The difference between synthetic checks and other tests signals
Synthetic checks
Synthetic checks are scripted tests that simulate user or system behavior. Examples include hitting an endpoint, logging in, or loading a key page. They are predictable, repeatable, and controlled. Because the inputs are known, any change in response time or errors usually means something actually changed in the system.
They are best for early detection and availability monitoring.
Health checks
Health checks are much simpler. They usually answer “is the service up?” rather than “is it usable?” A health check might confirm that a process is running or that an endpoint returns a 200 response, even if deeper functionality is broken.
They are useful for load balancers and orchestration systems, but they often miss real user-facing issues.
Real user data
This emanates from real traffic when end-users navigate and use the service. It highlights the experiences of real people when using the system across devices, locations, and networks. It is realistic but also takes a reactionary approach, as one only sees problems once they impact the users.
Regression testing
This checks whether a new feature broke something within the application. The tests are always executed when teams are about to release a new feature or during continuous integration (CI). The tests are never run continuously in production. They focus on correctness, not availability or performance over time.
Important Metrics in Synthetic Monitoring
- Uptime: Is the service available when a check runs, and does it meet the SLAs or SLOs that were set?
- Latency: Teams keep note of how long it takes to get the first byte, how long it takes the backend to process the request, and how long the whole request takes.
- Error rates: This tells you how often requests fail and what kinds of mistakes occurred.
- Core Web Vitals and Lighthouse: Shows how stable, responsive, and generally good a page’s performance is.
- Apdex: Translates response times into a simple signal that reflects how users are likely to perceive performance.
How Synthetic Monitoring Works
Synthetic Transactions
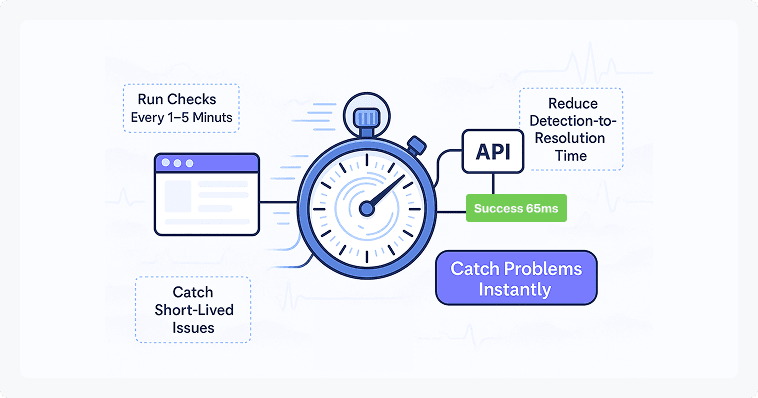
In synthetic monitoring, a client application installed on the browser or device sends automated transactions to your application. The running scripts mimic a real user as they navigate the web application. Typically, the bots are configured to run every 15 minutes but can be configured to run at different intervals.
Test Execution and Scheduling
The scripts are then developed to run on multiple geographical locations and devices.
Tests and scheduling typically entail:
- Frequency: Typically, the bots are configured to run every 15 minutes but can be configured to run at different intervals.
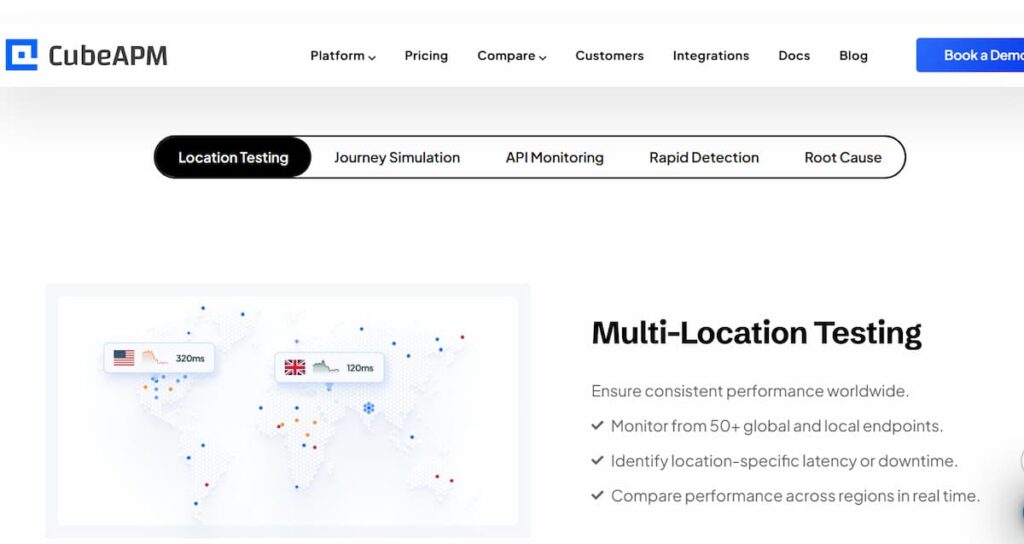
- Locations: Tests are conducted from different locations to ascertain the performance of the web application in different geographical locations.
- Different device or browser: Tests are run on different OS, devices, and browsers to guarantee a smooth experience for all users.
- Environments: Tests are executed either on the development or staging environment to catch issues before deployment to production. Moreover, they are run in a production environment to monitor performance issues.
Error Detection and Reporting
Once the automated script records an error, it sends it to the synthetic monitoring tool. The APM tool will prompt the client bot to do a rerun to confirm the error.
Observability systems send alerts when:
- Latency limits: Alerts are generated when the response time is beyond the limits. For example, an alert may fire if a page consistently takes longer than three seconds to load.
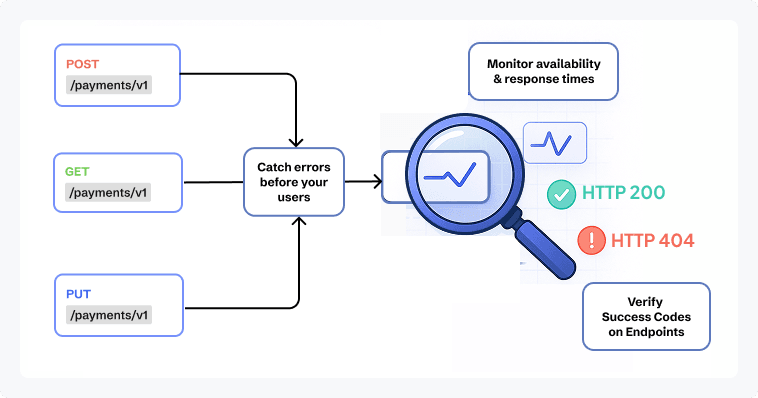
- Error conditions: Triggers alerts when requests return failures such as HTTP 404 or 500 responses, or when a required element does not load as expected.
- Availability checks: This is where an alert is sent if the whole service stops responding.
Types of Synthetic Monitoring
- Uptime monitoring: Involves checking for availability using DNS, HTTP, and TCP.
- API Monitoring: Checks API endpoints if they are responsive to requests. Simulates REST, GraphQL, and gRPC requests with token validation and auth token refresh.
- Mobile Simulation: Used to check how an app works when things aren’t going well. Tests indicate how effectively the system performs with different devices, screen sizes, and networks. tiny screens and slow network connections. Teams have trouble with mobile devices.
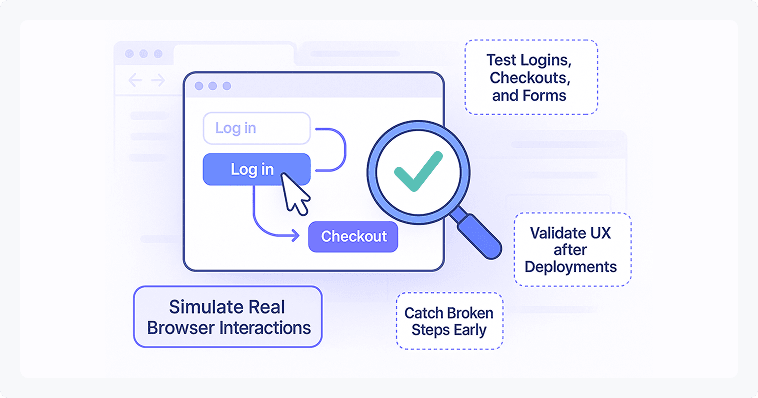
- Browser & Transaction: This tool makes sure that everything a user does is right from start to finish. The tests evaluate the flows, which include logging in, searching, and checking out. They can run in a real browser or a headless environment.
Significance of Synthetic Monitoring
Proactive Issue Detection
Helps find problems before they affect users. Gives you a way to fix system problems before they affect real users.
Regression Detection
Synthetic checks run similar scenarios after there are changes, such as deployments or dependency upgrades. It helps to identify regressions, including slow response times or broken workflows, following the changes. Teams can quickly identify the root cause that altered the system’s functionality, make quick fixes, or execute rollbacks.
Availability & SLA Monitoring
Offers a feasible avenue to evaluate an application’s performance in order to establish SLAs. It simulates traffic within different settings to establish how long the system will be on during the peak hours and when the demand is low.
Performance benchmark
Provides a benchmark on how important pages and APIs behave. The benchmark also helps identify small performance issues that would otherwise go unnoticed. Often, minor problems do not necessarily raise alerts, but they can have adverse effects on user experience. With a reference point in place, these minor issues are addressed before getting to the user.
Synthetic vs. Real User Monitoring (RUM)
Synthetic Monitoring
Synthetic monitoring is simulated, controlled, and repeatable. They help test API endpoints and new features. Helps teams catch issues early and confirm that core paths behave as expected.
- Key benefit: Establishes a performance benchmark and proactively discovers system issues before end-users encounter them.
- Blind spots: Doesn’t find problems until they affect real consumers. Also, it’s hard to find the underlying cause of an issue because we don’t know what real users are doing or what their conditions are.
Real User Monitoring
Checks real user behavior on different devices. Records diverse real-world conditions where synthetic monitoring fails to reproduce.
- Major Advantage: Gives an accurate view of usability conditions. It exposes the problems regarding performance that happen in real life.
- Blind spots: Fails to detect issues until they impact real users. Also, the root cause of a problem is hard to isolate because of the uncertainty of actual user conditions and actions.
Synthetic Monitoring and RUM Are Complementary
Using both methods gives you a complete picture of the health of your application.
- Basically, synthetic monitoring acts like a constant health check for your site. It tells you the second something breaks, but it also helps you understand what “normal” looks like. By tracking how your system performs on a good day, you get a solid baseline to measure against.
- RUM tells you how actual users experience the application. It captures the complexity of the real world.
Together, they allow teams to proactively identify widespread system failures via synthetic tests and diagnose unique, real-world user experience issues via RUM data, ensuring maximum coverage and faster resolution times.
What We’ve Seen Go Wrong with Synthetic Monitoring in Real Systems
It’s easy to fall into a false sense of security with synthetic monitoring if the setup isn’t handled with care. The dashboards may indicate a healthy status, but there are certain general areas that remain unmonitored, potentially concealing the true situation on the ground.
Missing API Connections
If the test suite only checks high-level endpoints, it creates a massive “silent” risk. Monitoring dashboards might show everything is fine even while a critical, overlooked API is failing in the background. Surface-level testing results in missing dependent and other internal services that enable a smooth running of the application.
Emulation Limits
Device-specific synthetic monitoring is useful for spotting browser or OS-related issues, but it runs on emulated environments, not real devices. Such emulators are frequently lacking any real-world characteristics, such as slower hardware, OS anomalies, or unreliable networks. Thus, a test can look healthy while real users still run into problems. Whenever possible, synthetic checks should be backed up with testing on real devices.
Integrate Synthetic Monitoring and Real User Monitoring
Synthetic monitoring is not a substitute for Real User Monitoring (RUM). Synthetic tests are rigid and might not replicate real-world scenarios. These tests fail to consider different ways that real people use an application, i.e., switching screens and slow public Wi-Fi. The gap in visibility that is produced by the use of synthetics in a vacuum can only be bridged with the actual user data.
Synthetic Monitoring Use Cases
Synthetic monitoring shows up in many industries, but it matters most where availability and performance are tied directly to trust, compliance, or revenue. In those environments, waiting for user reports is rarely an option.
Here are some examples of practical use cases for synthetic monitoring:
Healthcare Services
- Patient Portal Availability: Synthetic monitoring helps healthcare companies keep patient portals up and running. This will ensure that such websites are available at all times to allow appointments and obtain test results. It enables prompt detection of outages, especially during low use of the application, where the issues may not have been realized before.
- Authentication Flows: Ensures the right people can get things done without technical headaches. It starts with a simple login for patients, staff, and doctors so they can access their records or manage care immediately.
- Synthetic API checks: ensure that lab systems are accurately connecting to vital services, such as imaging platforms, billing tools, and electronic health records systems. Such checks can alert teams to issues early, before they disrupt clinical workflows.
General Web Applications
- Web Availability Checks: This is a fundamental use case of synthetic monitoring. Teams test the ability to access important web pages (such as homepages, dashboards, and user-facing endpoints) so they can be sure services are functional.
- Measuring API Health and Response: Developers and DevOps teams run routine synthetic tests to track how APIs behave under normal conditions. This makes it easier to identify slow responses, degraded endpoints, or failures that could affect application performance if left unnoticed.
How Synthetic Monitoring Fits into a Complete Observability Strategy
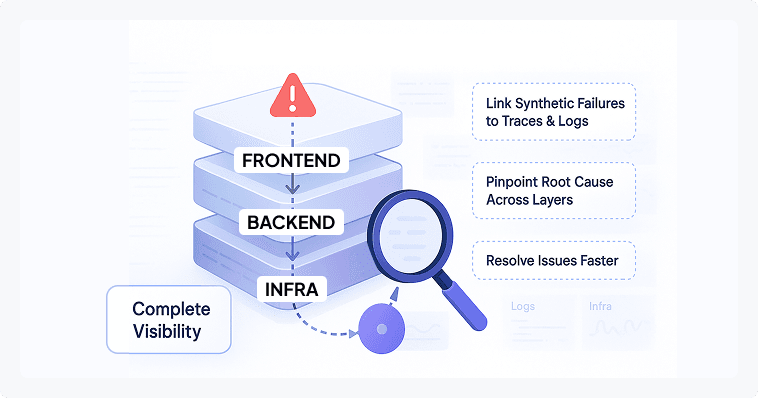
Synthetic Monitoring as an Early Warning System
Synthetic monitoring acts as the first signal that something is wrong. Think of this as an early warning system for your software. Instead of waiting for a customer to complain. These scripts run through your most important features, like logging in or checking out 24/7. Because they are always active, they catch bugs, slowdowns, or regional outages the moment they happen. This gives your team the chance to fix a bad update or a server glitch before your actual users ever notice a problem.
Logs, Metrics, and Traces as Diagnostic Layers
Telemetry signals are important, as they provide context when synthetic checks fail. Logs highlight the error messages and also the unexpected user behavior. Metrics tell you the “what” by showing whether a problem is hitting every user or is isolated. They turn vague alerts into a specific starting point for your investigation so you can get things back on track quickly.
Why correlation matters more than dashboards
Dashboards show what is happening, but correlation explains why it is happening. Linking synthetic failures directly to related logs, metrics, and traces allows teams to see the full story of an incident in one place. This reduces alert fatigue, speeds up root cause analysis, and helps teams resolve issues faster than relying on disconnected charts and isolated signals.
Best practices for choosing the best synthetic monitoring tool
Start with fundamental Services
Make sure you know which pages, APIs, and workflows affect services the most when they break before looking at tools. A tool that only says “the site is up” won’t help much if login or checkout keeps crashing.
Make sure tests can run in a real-world scenario
Synthetic tests should run on locations, devices, and in settings that are most important to consumers. Limited locations or a high dependence on emulation can often disguise real problems.
Watch how alerts behave
Teams will cease trusting a technology if it sends alarms for every little thing. Look for confirmation logic that runs tests again and checks for failures before moving up.
Avoid tools that work in isolation
You should be able to rapidly observe logs, traces, or metrics that are relevant to a synthetic test that fails. Switching between instruments that aren’t connected slows down the research.
Think about data control
Some teams need to have more discretion over where monitoring data is stored, especially in places where rules are strict. You should check to see if the tool may be used for self-hosted or private cloud deployments.
Learn how costs go up over time
At first, a lot of tools seem cheap, but they get more expensive when you add more checks or do them more often. When prices are predictable, it’s easy to add more coverage without cutting corners later.
Why teams use CubeAPM for synthetic monitoring
When teams evaluate synthetic monitoring tools, they typically look for three things: correlation with backend telemetry, predictable cost at scale, and flexibility in how tests are deployed.
Unified Dashboard
CubeAPM combines synthetic checks with logs, analytics, traces, and data from real users. When something goes wrong, teams don’t have to switch between dashboards to figure out what happened.
Predictable Pricing
CubeAPM has a pricing model that does not change based on the number of synthetic checks. Allows teams to increase test frequency and add new tests without the need to worry about costs.
OpenTelemetry-native
Being OTEL-native means that teams can instrument once and not have to worry about being stuck with proprietary agents or pipelines as their stack changes.
Smart Sampling
Smart sampling enables teams to capture valuable data. Instead of collecting everything at the same rate, it prioritizes meaningful signals such as errors, slow requests, and unusual behavior, while reducing noise from repetitive or low-value traffic.
Synthetic and real user monitoring are complementary
Synthetic tests are used to identify issues at the early stages, and actual customer information explains the impact of the issue on the customers. CubeAPM was designed to be compatible with both, and therefore, the teams are not required to choose either.
Top Synthetic Monitoring Tools
CubeAPM
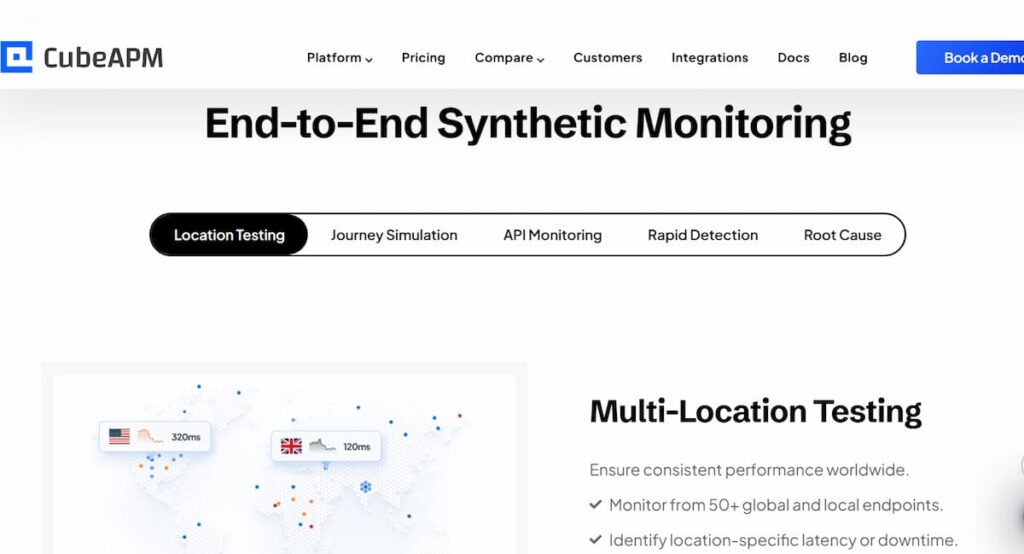
- OTEL-native with MELT correlation across metrics, events, logs, and traces.
- Cost-predictable pricing designed to scale coverage without per-check shocks.
- On-prem / private cloud hosting options to minimize data transfer costs and reach data localization requirements.
- CI/CD friendly: synthetics as code, Git PR feedback, and pipeline gates.
Datadog
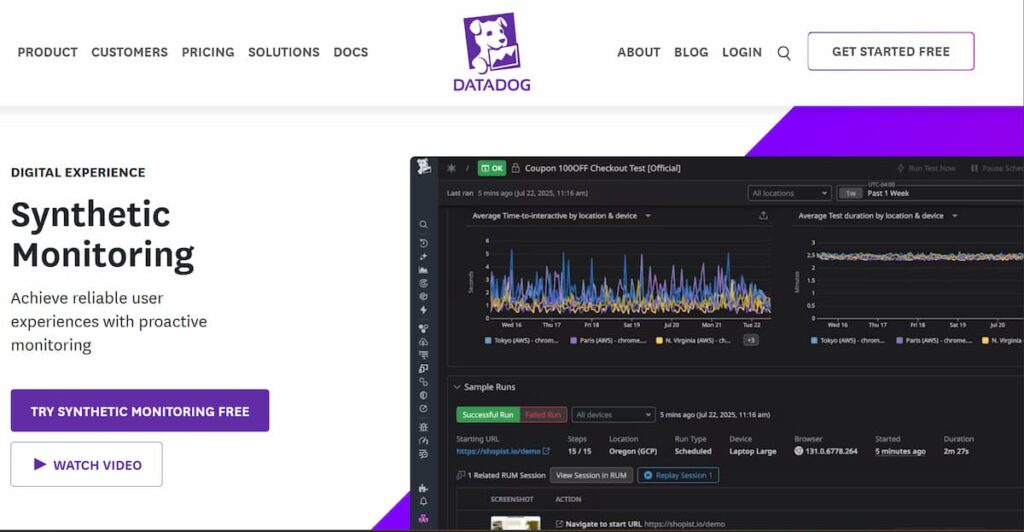
- Broad ecosystem and marketplace; mature feature set.
- Per-check pricing can complicate cost forecasting at scale.
New Relic
- Broad observability suite and strong analytics.
- Setup complexities and licensing approaches may increase TCO in some teams
Why CubeAPM on synthetics: OTEL-first, end-to-end correlation, and aggressive coverage pricing. DevOps teams do not have to worry about unexpected costs since they are able to keep track of what is important.
Conclusion
Synthetic monitoring is essential for checking and ensuring a positive experience for real users. It fits and completes RUM, speeds up MTTR, and implements SLOs in a multi-cloud, multi-API world. Synthetic monitoring works together with RUM since sometimes the automated tests might not get the issues that real users encounter.
CubeAPM offers synthetic monitoring with predictable pricing. Teams are able to run checks without worrying about cost spikes. It is also open-telemetry native, averting vendor lock-in and meaning you can instrument the tools once and migrate to other backends.
Disclaimer: The information in this article reflects the latest details available at the time of publication and may change as technologies and products evolve.
FAQs
1. What is synthetic monitoring?
Synthetic monitoring simulates user journeys and API calls from global locations to validate uptime, latency, and reliability on a schedule. It is proactive and complements production telemetry.
2. How is Synthetic Monitoring Different from RUM?
Synthetics provide repeatable, controlled procedures for so-called labs. RUM achieves real-world device and network variability. Combined, they ensure end-to-end visibility of reliability and UX.
3. What should I synthetically monitor first?
Begin with the most important business impact flows: login, checkout/payment, and core APIs. You can add search, onboarding, and background as you grow.
4. How often should I run checks?
Run critical paths every 1–5 minutes; less critical flows every 15–60 minutes. Use multi-location confirmation to reduce false positives.
5. Can synthetic monitoring track Core Web Vitals?
Yes. Measure LCP, INP, and CLS synthetically and pair with Lighthouse audits. Combine with RUM to align lab results with field reality and SEO goals.


