Infrastructure monitoring is important for modern businesses that run on a hybrid IT environment with various cloud-native applications, Kubernetes clusters, and on-premise deployments. These businesses spin resources up/down fast. This is good for growth, but increases risks.
If you don’t have any idea how different systems are behaving, you can’t find issues in them. Reports say IT downtime can cost $14,056/minute, and up to $23,750 for large enterprises. This frustrates end users and affects business reputation.
With infrastructure monitoring tools, you can track your servers, containers, databases, and networks continuously. This means you can catch problems before they turn into outages. In this guide, we’ll talk about infrastructure monitoring, its key components, benefits, real-world use cases, and more.
What Is Infrastructure Monitoring?
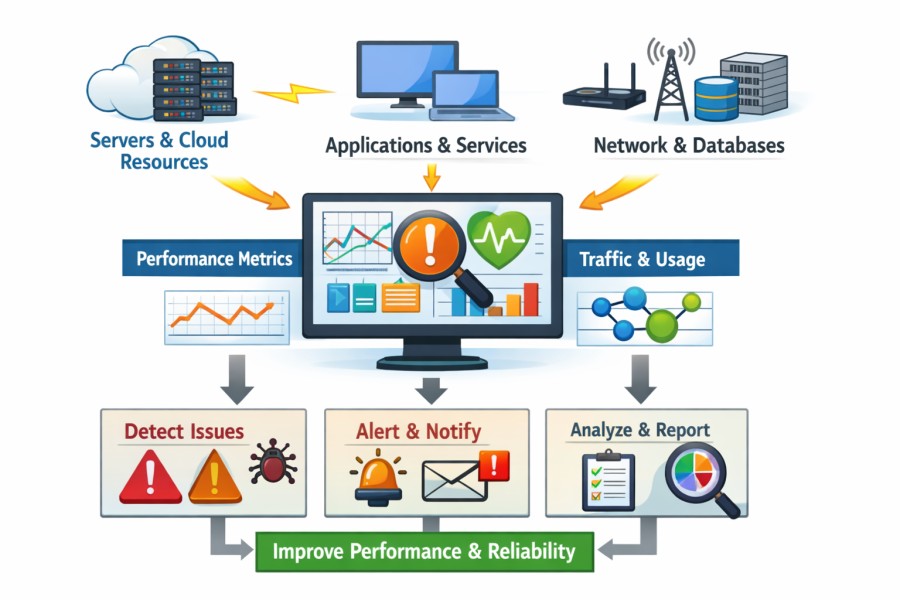
Infrastructure monitoring means tracking systems in an organization’s IT infrastructure, such as applications, databases, virtual machines (VMs), cloud services, containers, network components, and servers, continuously. This helps you find issues in IT systems and fix them to optimize system performance and functionality, lower downtime, and sustain business operations.
Modern IT and DevOps teams use infrastructure monitoring tools to monitor and collect information on system activities, health, and functionalities. They can analyze this data to find issues, such as system failures, costly outages, security vulnerabilities, network latency, app slowdowns, CPU overuse, improper memory allocation, and more. This helps teams get to the root cause of a problem faster and fix it. This helps teams quickly spot and resolve problems in real-time to restore operations and improve resource allocation, uptime, and user experience.
Infrastructure monitoring can be reactive, proactive, and predictive in nature:
- Reactive: detecting and resolving system bottlenecks after they affect end users.
- Proactive: detecting and resolving system bottlenecks before the end users’ experience is affected.
- Predictive: using AI and ML to detect warning signs in order to predict and prevent system failure even before it occurs.
In plain words, infra monitoring helps you understand if your systems are running smoothly or malfunctioning. It has evolved over the years, from manual reactive-based processes to smart and automated systems. Modern infrastructure monitoring tools come with interactive dashboards, real-time visibility into both legacy and cloud systems, performance insights, automated alerts, and other advanced features. They can even work remotely and integrate with cloud providers (e.g., AWS, GCP, Azure).
Types of Infrastructure Monitoring
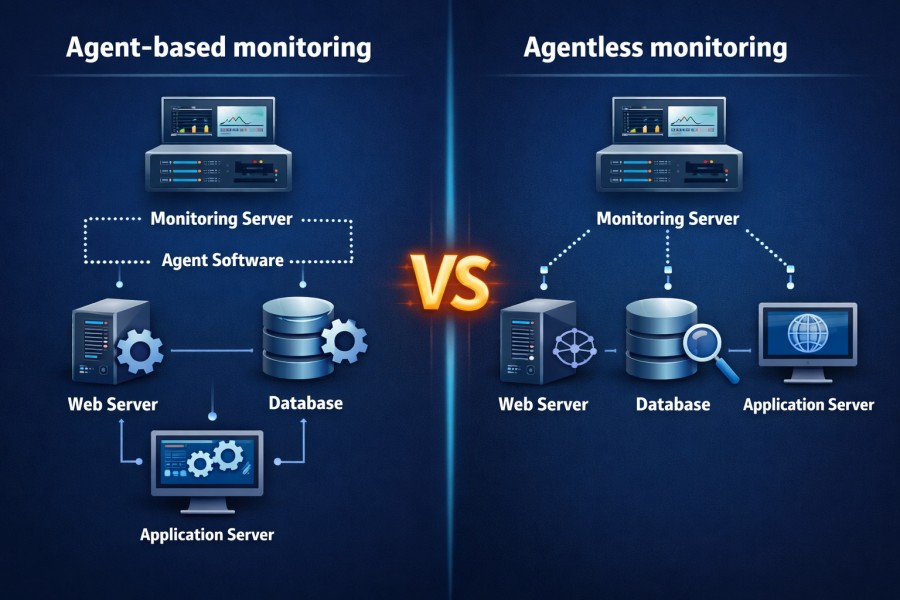
Agent-based monitoring
In this, lightweight software agents are installed on systems, servers, VMs, or containers to collect data, such as disk usage, CPU, memory, etc., and push it to the monitoring backend. These agents provide deeper information about a system’s health and functioning and are more customizable.
It’s ideal in organizations that need in-depth data on systems or higher security, as it can monitor systems from behind a security system or firewall. You can continue collecting data when the connection is cut off; it can buffer information and send it to your monitoring solution once the connection is back on.
Example: OpenTelemetry Collectors. Since these collectors can be proprietary, you must check if they are compatible with your monitoring system.
Agentless Monitoring
Instead of using software agents, protocols (e.g., SNMP and SSH), cloud-native protocols (eg, AWS CloudWatch and Azure Monitor), or APIs are used to collect system data. It works on servers, VMs, storage systems, network components, and more.
Organizations prefer this when it’s not feasible to deploy agents, for instance, in SaaS services or managed databases. Being efficient, it’s also ideal in IT environments with too many systems to monitor.
Infrastructure Monitoring vs Observability
On the surface, infrastructure monitoring and observability may look the same. But in reality, they are not. Let’s talk about the fine line that differentiates these two terms.
- Monitoring: It’s tracking an IT system’s CPU, uptime, disk usage, memory, vulnerabilities, etc., to understand its health. You can analyze these details to determine if your systems are working as they are supposed to. If they don’t, find and fix the issue.
- Observability: It goes deeper than monitoring. It collects metrics, logs, and traces and correlates them to help you figure out why a system ran into an issue. Apart from knowing which system is down or malfunctioning, you will understand the cause behind it, so you can resolve it.
When Teams Need One vs Both: How CubeAPM Helps
For example, an e-commerce platform can use CubeAPM’s infrastructure to detect a spike in server CPU. But when they use CubeAPM’s unified MELT observability, they will be able to correlate that spike with a sudden surge in checkout requests traced through microservices. So, monitoring when combined with observability gives teams the full picture of a system’s health. This way, maintaining uptime and troubleshooting problems becomes fast.
Key Components of Infrastructure Monitoring
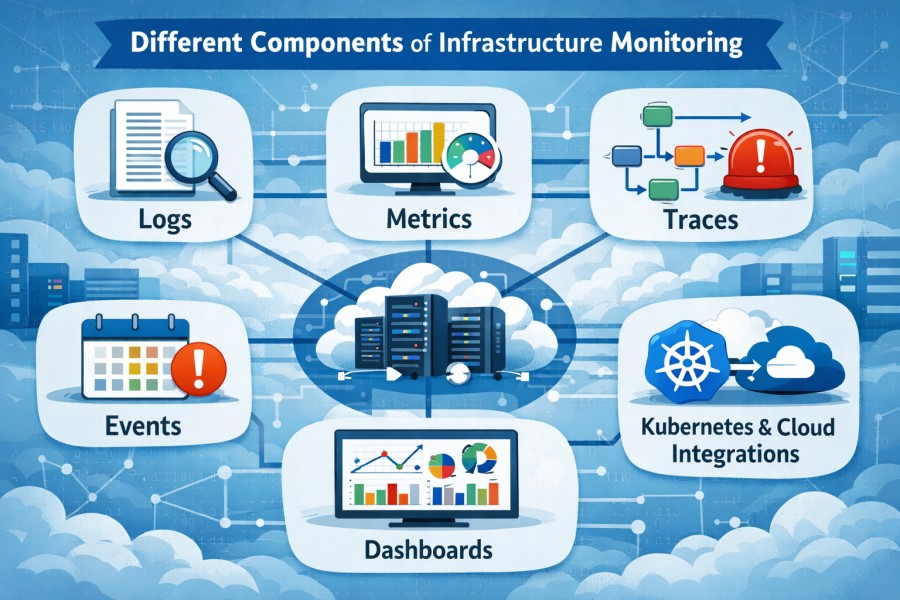
- Metrics: Metrics are quantifiable, such as CPU, disk, and memory usage, response times, network bandwidth, request latency, error rate, etc. Tracking metrics helps you understand your IT systems’ health on a high level, find issues early, and troubleshoot them.
- Logs: These are detailed system records, such as errors, user actions, alerts, or warnings, and so on. It tells you about a system’s behavior at a point, which helps you diagnose issues.
- Events: These are occurrences, such as user logins, failed transactions, configuration changes, HTTP requests and responses, restarts, etc., within a system.
- Traces: These provide detailed information on a request’s path as it moves from one component to another in a system. It captures the complete request flow and helps you understand how two data points relate.
- Dashboards & visualization: Dashboards show system KPIs (e.g., error rates, latency, uptime, etc.) at a glance. Some offer advanced views, such as heatmaps, dependency maps, and real-time tracking to pinpoint issues as they pop up.
- Alerts & thresholds: Teams set up thresholds for KPIs and configure alerts when the thresholds are crossed. For example, if the threshold for CPU usage is set to 85%, the team will be alerted when it goes beyond 85%.
- Cloud & Kubernetes integrations: Modern IT teams run in hybrid environments. They use cloud services, VMs, containers, K8 pods, etc. Infrastructure monitoring tools integrate with cloud providers, such as AWS and Azure, along with K8 clusters to track pod health and node performance.
Providers, take CubeAPM for instance, which offers deep visibility into metrics, events, logs, and traces (MELT) and correlates them for faster root cause analysis. It automatically ingests data via OTel agents and cloud-based exporters, such as AWS CloudWatch, and offers real-time dashboards and alerts.
How Infrastructure Monitoring Works
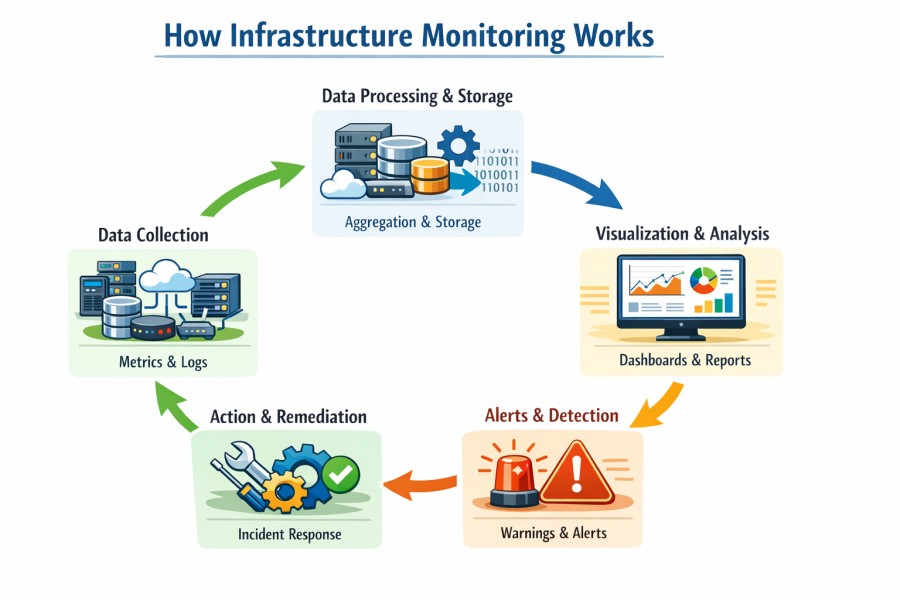
Infrastructure monitoring is not a one-time operation. You need to do it continuously to be able to catch issues as and when they occur and fix them. Here’s how the complete process looks:
Data Collection

The infrastructure monitoring tool you are using starts collecting telemetry data from your IT infrastructure systems, such as servers, applications, online services, VMs, cloud containers, etc. As we discussed earlier, it’s done using agent-based (e.g., OTel collector) or agent-less (AWS CloudWatch) data collectors. Monitoring tools collect telemetry data, such as metrics, logs, events, and traces.
Monitoring tools also collect data on uptime, network, security, etc., to help you completely understand a system’s performance, functionality, reliability, user behavior, security, and more.
With CubeAPM, this process is OpenTelemetry-native. It supports standard OTel agents and exporters without vendor lock-ins. It ingests data from both agents on your bare-metal servers, Kubernetes pods, and VM instances, and agentless exporters like AWS CloudWatch.
Data Processing & Storage
Monitoring tools capture a large volume of data, and not all data is valuable. You could spot outdated, incomplete, irrelevant, duplicate, or inaccurate data. So, storing this huge data will unnecessarily raise your bills, cause the dashboard to lag, and make analysis overwhelming.
So, after collecting telemetry, you will need to process this data, which involves normalizing, filtering, indexing, and storing data. This helps you efficiently analyze, query, and use for detecting and investigating issues in a system.
Example: Data Compression with CubeAPM
CubeAPM offers high-compression storage and an efficient data index to keep queries snappy even if you store data in billions. It normalizes logs and events by converting them into a consistent format (e.g., JSON), indexes them for search, and filters out duplicate records. Similarly, it uses smart sampling to retain useful traces (e.g, failed requests).
Visualization & Analysis
This is where raw data becomes useful insights. You collect and store data to be able to visualize and analyze what’s happening with your systems and take appropriate actions. It requires dashboards with visualizations, such as time series charts (for CPU usage), funnels (transaction drop-offs), heatmaps (latency hotspots), and so on.
Example: Querying correlating metrics
You can query metrics to find and correlate metrics, such as latency and CPU usage. You can even drill into system logs to find the error message before the service crashes. Developers also examine traces to find issues in a distributed HTTP request.
With CubeAPM, you can avail of unified MELT observability in a single place without juggling multiple tools for metrics, logs, traces, and events. You also get real-time dashboards to analyze issues as soon as they appear, to be able to remediate them faster.
Alerts and Detection
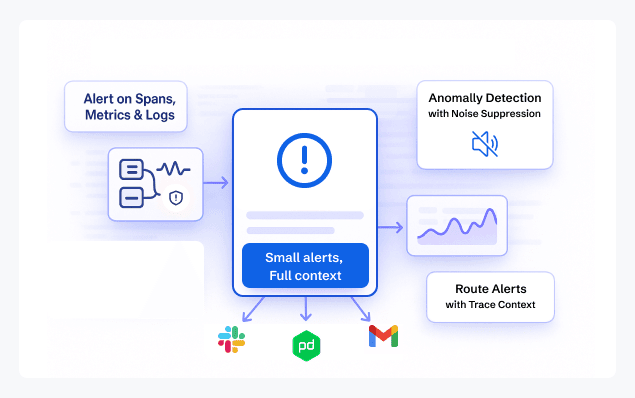
A single human can’t monitor your systems 24/7. You’ll need a team that can work in rotation, plus you will have to factor in human errors. For instance, if there’s a delay in detecting and reporting an issue, like a service downtime, it will affect end users’ experience.
This is why you need a prompt, always-on system to notify you of alerts, so you can investigate issues and resolve them immediately. Alerting systems are configured in such a way that they will send an alert to you via a channel (e.g., email) if a metric exceeds the set threshold. For example, an error rate exceeding 3% triggers an alert.
Example: How CubeAPM’s Intelligent Alerting Works
Organizations use advanced AI and ML algorithms to detect anomalies or unusual patterns (e.g., sudden login failures or at an unusual time). In CubeAPM, you will get filtered alerts. Instead of firing noisy alerts in hundreds, CubeAPM groups related incidents, such as database latency or CPU spikes, and sends alerts.
Action & Remediation
Your end goal is to keep all your systems in the best shape in terms of performance, functionality, and security. This requires taking action, which is to find and fix issues in your system. So, collecting, organizing, and analyzing data is only half of the journey.
Once the monitoring system raises an alert, your team needs to investigate and respond to it quickly. You can use both manual and automated processes to do this. The team can correlate data to get to the root cause of an issue and fix it. With CubeAPM, you will get smart MELT correlation and faster remediation.
Benefits of Infrastructure Monitoring
Improved Uptime & MTTR
An IT downtime can cost a business $5,600 to $9,000. Since modern organizations depend on many services and systems, even a small downtime can disrupt operations and render services unavailable. This ultimately affects end-user experience and tarnishes your business reputation.
With infrastructure monitoring, you can correlate data, catch issues early, and resolve them to improve uptime and mean-time-to-resolution (MTTR).
Optimizing Costs
There could be many tools and resources in your IT operations, and multiple users using them. Your bills can rise fast if the resources are not used properly or overused. And if underutilized or left idle, money is wasted, and performance issues can happen during high traffic scenarios.
Infrastructure monitoring helps you track the usage patterns and allocate resources smartly. This helps you save huge on resources and monthly cloud bills.
Faster Troubleshooting
Every team wants to be able to troubleshoot issues immediately as soon as they find them. The longer the issue remains, the greater the risk. But fixing issues requires analyzing too many logs, metrics, and dashboards, which delays the process.
Infrastructure monitoring sheds light on important systems KPIs so you can correlate them to find the root cause and fix issues faster. For example, using CubeAPM’s automatic MELT correlation, you can cut down incident response time or MTTR from hours to minutes.
Audits & Compliance
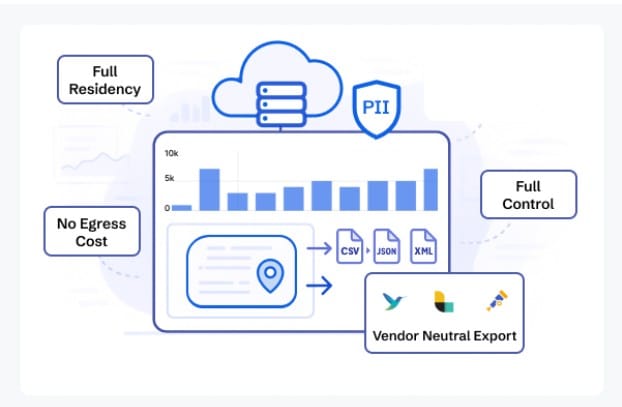
Regulatory bodies, such as HIPAA, GDPR, PCI DSS, and DPDP, require companies to follow their norms and protect customer data. You need to report incidents quickly and have processes in place to detect and remediate issues. If you fail, you might be looking at reputation loss and huge fines. In the US. HIPAA violations can cost around US$1.5 million.
Continuous infrastructure monitoring is a great way to visualize system bottlenecks in real-time and prepare for audits. This way, you can skip the hassles of using separate compliance tools and actually stay compliant with applicable rules and regulations.
Infrastructure Monitoring Use Cases [with CubeAPM]
- Cloud monitoring: You’ll get visibility into your cloud infrastructure, such as AWS, Azure, and GCP, in real-time with solutions, such as CubeAPM. For example, if you are a fintech startup, you can use CubeAPM to track AWS EC2 and S3 costs plus performance metrics. This will help you cut 20% of cloud costs.
- Kubernetes & containers: Infrastructure monitoring makes it easier to manage K8 as it grows. For example, CubeAPM’s native K8 integration can map your nodes, services, and pods with KPIs like logs and traces. This will help you inspect and debug your failed deployments and reduce MTTR.
- Server & network monitoring: Infrastructure monitoring allows you to monitor network latency, disk usage, CPU, etc., across cloud and on-prem servers. For example, you can use network flow monitoring by CubeAPM to detect suspicious traffic patterns pointing to a misconfigured load balancer. By fixing this issue, you can skip slowdowns during checkouts.
- Database monitoring: You can monitor your database to spot issues with query execution, storage, and replication. For example, you can use CubeAPM’s query-based analytics to find inefficient joins in your PostgreSQL database. This helps reduce query response times and improve performance.
- Hybrid/multi-cloud monitoring: With infra monitoring, you can ingest and consolidate telemetry data from on-premises, hybrid, and multi-cloud setups. For example, an SMB with its workloads running on AWS and Azure can use CubeAPM infrastructure monitoring to get complete visibility into its systems with no tool sprawl.
- Security & compliance: Infrastructure monitoring goes beyond performance and reliability. You can use it to detect security flaws, such as suspicious traffic, unusual logins, repeated authentication failures, and more. You can also create and automate reporting to stay compliant.
How CubeAPM Performs Infrastructure Monitoring: A Case Study
SaaS Startup Scaling to 10 TB/Month with CubeAPM
Problem
A fast-growing SaaS startup faced a major challenge as its infrastructure expanded. With over 200 microservices and rapidly increasing user traffic, their observability costs spiraled out of control. Using Datadog, they were ingesting 10 TB of logs, metrics, and traces per month, resulting in bills of more than $8,000 per month, plus additional per-user licensing fees. Alert fatigue and long query times further slowed down troubleshooting, impacting user experience.
Solution
The team switched to CubeAPM’s OTEL-native platform. With Smart Sampling, they reduced ingestion volume by nearly 70% while retaining all critical telemetry. Unified MELT (Metrics, Events, Logs, Traces) correlation helped engineers trace issues across services in real time, cutting MTTR by 35%.
Result
By migrating, the startup slashed observability costs to around $1,800/month, gaining predictable spend without sacrificing visibility. More importantly, their engineers were able to focus on scaling features instead of firefighting monitoring bills.
As a result, 70% less data, ~60% cost savings, faster troubleshooting, and a future-proof OTEL pipeline ready for continued growth were achieved.
Infrastructure Monitoring Tools
1. CubeAPM
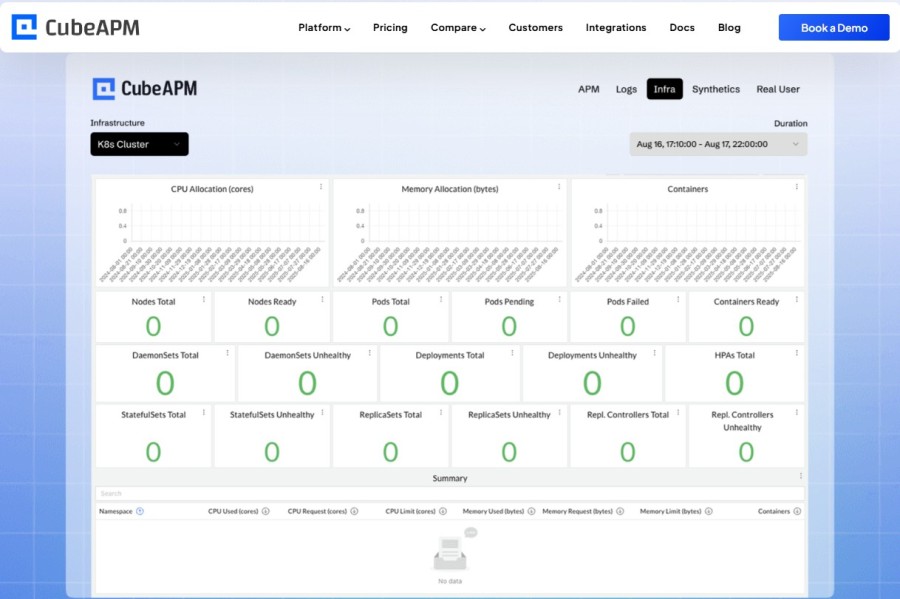
CubeAPM’s infrastructure monitoring allows you to track your hosts, cloud services, containers, and databases in real-time. Get complete control over your data with unlimited retention.
Key features
- Clear dashboards with cluster health views and visibility at the node and pod level
- Detects database latency, queries, spikes, and inefficient joins
- Supports OTel natively and offers full MELT observability
- Supports AWS, GCP, and Azure with API-based metrics
- Offers smart sampling to filter out noise and cut storage costs
- Offers self-hosting and data residency for compliance
- 800+ integrations
CubeAPM Pricing: $0.15/GB of data ingested
2. Grafana
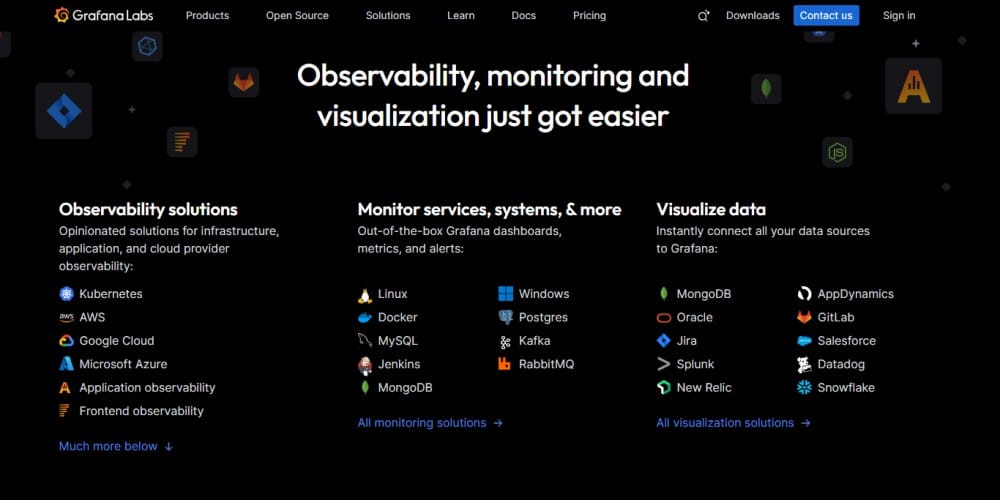
Grafana is an open-source visualization tool that allows you to create dashboards for infrastructure telemetry. It integrates with Prometheus, Loki, and other exporters to organize metrics, logs, and traces into customizable views.
Key Features
- Flexible visualizations for servers, containers, and cloud metrics
- 100+ data source integrations
- Threshold-based alerts
- Multi-channel notifications
- Full control over deployment and scaling
Grafana Pricing: free, Grafana Cloud starts at $19/month
3. Datadog

Datadog offers SaaS-based infra monitoring with pre-built dashboards. It monitors servers, containers, databases, and cloud services with minimal setup.
Key features
- Real-time health tracking for VMs, pods, and nodes
- Insights into latency, throughput, and traffic flow
- Tracks usage and optimizes spend for AWS, Azure, and GCP
Datadog pricing: Infra monitoring: $15/host/month; APM+Infra: $31/host/month
Challenges of Infrastructure Monitoring
- Hidden costs: Most infrastructure monitoring platforms charge per host or gigabyte (GB) of telemetry data you ingest. It’s manageable if your requirements are on the lighter side, but difficult with scaling infrastructure (e.g., from 50 to 500). CubeAPM handles this with smart sampling, which reduces telemetry volume by up to 80%. You’ll get predictable pricing whether you scale up or down, and without sacrificing visibility.
- Complexity in hybrid setups: Companies now run in hybrid IT environments, comprising on-prem and cloud systems. Monitoring accurately becomes difficult as the sources of data and APIs are distinct, while legacy systems may not support modern tools. To solve this, CubeAPM supports OTel-native data from any environment, so you get complete visibility.
- Agent vs agentless: Agents offer greater visibility but can be costly. Agentless are easily deployable but may miss out on low-level metrics. Balancing the trade-offs is difficult for teams. CubeAPM, for instance, supports both to provide granular visibility and cost-effectiveness. It ingests data with lightweight OTel collectors along with agentless exporters, like AWS CloudWatch.
Best Practices for Infrastructure Monitoring
- Define SLOs: To monitor what’s truly important, set up service level objectives (SLOs) connected with your business goals (e.g., 99.90% uptime for apps end users use).
- Reduce alert fatigue: Set up thresholds properly to reduce alert fatigue for your team. Get alerts when they really impact your business.
- OpenTelemetry support: Your infrastructure monitoring tool must support OTel fully and natively, such as CubeAPM. Get the freedom to instrument once and analyze anywhere you want without vendor lock-ins.
- Automate remediation: Remediate issues faster as soon as you catch them. Automate responses, such as scaling resources, restarting pods, etc., to cut MTTR.
Conclusion
Infrastructure monitoring is important for modern IT reliability. It continuously tracks metrics, logs, events, and traces across servers, containers, databases, and cloud services, which helps teams detect issues before they impact users.
As we saw, it works by collecting, processing, analyzing, and alerting on telemetry while powering use cases from Kubernetes health checks to hybrid cloud visibility. CubeAPM makes it practical with OTEL-native ingestion, MELT correlation, and cost-transparent Smart Sampling.
Try CubeAPM today for future-proof infrastructure monitoring.
Disclaimer: The information in this article reflects the latest details available at the time of publication and may change as technologies and products evolve.
FAQs
1. How has infrastructure monitoring evolved over time?
Infrastructure monitoring has shifted from manual log checks and static dashboards to automated, real-time observability. Earlier systems focused mainly on on-premise servers, but with the rise of cloud and containers, modern monitoring platforms detect ephemeral resources, collect data via APIs or exporters, and provide dynamic dashboards and alerts. This evolution makes it possible to track highly distributed, short-lived workloads at scale.
2. Are there good use cases for legacy systems with infrastructure monitoring?
Yes, legacy or on-prem environments still benefit from infrastructure monitoring. Tools can use SNMP, WMI, or lightweight agents to monitor older servers, databases, and network hardware. This ensures teams detect performance degradation early, plan for capacity, and extend the useful life of non-cloud infrastructure without compromising reliability.
3. How does infrastructure monitoring affect productivity?
By automating data collection and providing real-time alerts, infrastructure monitoring reduces manual work and accelerates incident resolution. Teams spend less time firefighting and more time building features. In many organizations, this leads to shorter mean time to resolve (MTTR), fewer outages, and significant reductions in monitoring overhead costs.
4. What role does infrastructure monitoring play in configuration assurance testing?
Infrastructure monitoring validates that systems remain stable after configuration changes or deployments. By tracking CPU, memory, error rates, and availability during and after updates, monitoring tools can quickly flag regressions or risks. This enables faster release cycles with lower rollback risks, while giving teams confidence that changes won’t cause hidden failures.
5. What are the environmental or energy-related benefits of infrastructure monitoring?
Monitoring helps organizations identify idle or underutilized resources that consume power unnecessarily. By consolidating workloads and shutting down unused infrastructure, teams not only lower costs but also reduce energy consumption. This supports corporate sustainability initiatives while improving operational efficiency.


