Pixie by New Relic is an eBPF-based Kubernetes observability tool that provides instant, zero-instrumentation visibility into cluster traffic and performance. However, reliance on the broader New Relic platform for full value, and potential operational considerations from eBPF-based deployment has made teams seek alternatives.
CubeAPM is the best Pixie alternative, offering full MELT observability, OpenTelemetry-native support, smart sampling, and a robust integration ecosystem with 800+ supported tools. With flat $0.15/GB pricing, RUM, synthetics, alerting, and self-hosting, it delivers broader coverage and better compliance than Pixie’s Kubernetes-only model.
In this article, we explore the top 7 alternatives to Pixie by New Relic—comparing features, pricing, deployment, and OTEL support—to help you find the best fit for full-stack observability.
Top 7 Alternatives to Pixie by New Relic
- CubeAPM
- Dynatrace
- New Relic
- Datadog
- Middleware
- Logz.io
- Elastic Observability
Why Look for Pixie by New Relic Alternatives?
Here are the key limitations driving teams to explore other observability platforms:
1. High Costs As Usage Grows
While Pixie itself is positioned as easy to start with, teams often need the broader New Relic platform for long-term analysis, alerting, and correlation. As data volume and retained telemetry increase, overall costs can scale quickly, especially for larger or fast-growing Kubernetes environments.
2. Operational Overhead for Open-Source Use
Pixie relies on eBPF and in-cluster components, which can introduce operational complexity in production setups. Teams may need additional effort to manage permissions, kernel compatibility, upgrades, and security reviews, particularly in regulated or locked-down Kubernetes clusters.
3. Overwhelming user interface
As Pixie data is consumed within the New Relic ecosystem, users can face a dense interface with many views, queries, and workflows. For some teams, this makes day-to-day troubleshooting less intuitive and increases the learning curve compared to simpler, more unified observability platforms.
Criteria for Suggesting Pixie by New Relic Alternatives
When selecting the best alternatives to Pixie, we evaluated each tool based on the following criteria:
1. Support for Full MELT Observability
Pixie primarily captures traces and metrics, but modern teams require platforms that also offer Logs, Events, RUM, and Synthetics—all under one roof. Tools like CubeAPM, Datadog, and New Relic stand out here.
2. Native OpenTelemetry Compatibility
We prioritize tools that offer first-class OTEL-native ingestion, correlation, and visualization out of the box.
3. Cost Efficiency & Transparent Pricing
Pixie’s “capture everything” model can drive up storage and compute costs. We assessed platforms that offer smart sampling, flat GB-based billing, and no per-user licensing fees—areas where CubeAPM and SigNoz excel. For example, CubeAPM offers 60–70% cost savings over Datadog and New Relic at 10TB/month ingest levels.
4. Self-Hosting & Compliance Flexibility
We gave preference to alternatives offering both SaaS and on-prem models, and that support data residency laws.
Pixie Overview
Known For
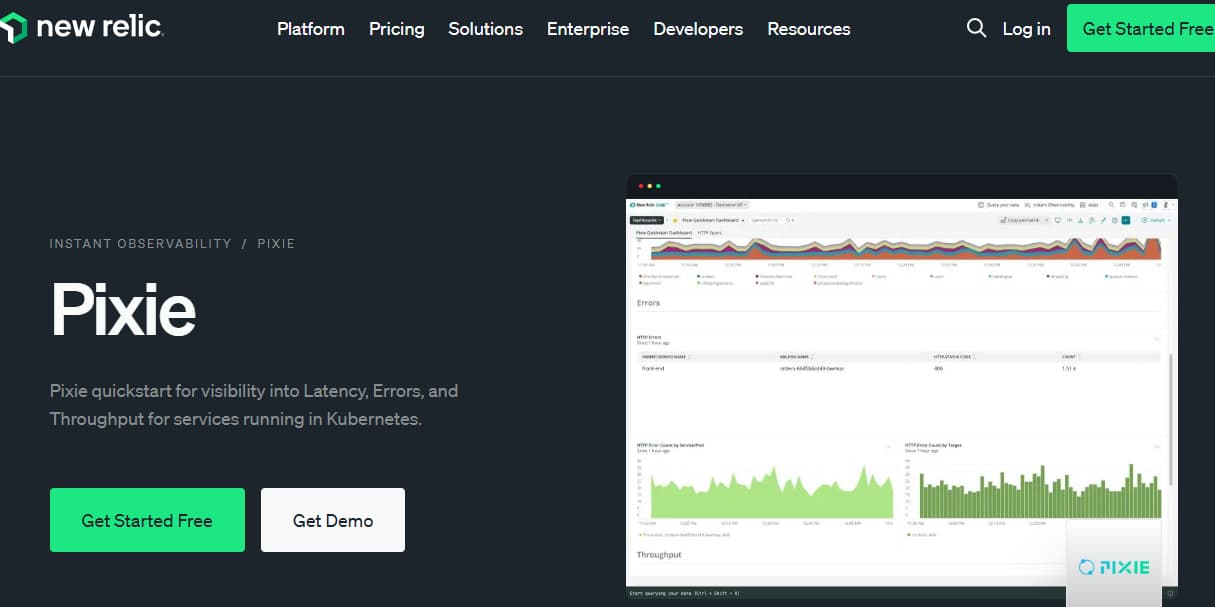
Pixie is best known as a Kubernetes-native observability platform built on eBPF, enabling zero-instrumentation tracing and live debugging within clusters. It captures full-fidelity telemetry without sidecars or agents, and is open-source under the Apache 2.0 license.
Standout Features
- eBPF-based auto-instrumentation — captures metrics, traces, and logs without code changes
- PXL scripting engine — allows developers to run custom scripts for querying and visualization
- In-cluster data storage — eliminates the need to send telemetry off-cluster (in OSS mode)
- OpenTelemetry plugin — optional export of Pixie data into broader OTEL pipelines
Key Features
- Flame graphs and latency visualizations
- SQL and HTTP request profiling
- Service maps and network traffic tracing
- Kubernetes-native deployment model
- px CLI and browser UI for querying
- Optional integration with New Relic One for hosted dashboards and alerting
Pros
- No code changes required for instrumentation
- Real-time telemetry with low latency
- No external data egress with OSS version
- Highly developer-centric — ideal for ad hoc debugging and investigation
- Fully open source (Apache 2.0)
Cons
- Steep learning curve
- Complex initial setup and configuration
- Costs can scale ,especially on paid plans that use the New Relic platform
Best For
- Platform and DevOps engineers using Kubernetes who want real-time, in-cluster observability and interactive debugging without relying on external vendors.
- Ideal for development and staging environments, less so for production-grade observability at scale.
Pricing & Customer Reviews
- Pixie OSS: Free and self-hosted.
- Pixie via New Relic: Included in New Relic’s usage-based pricing
- Pro plan: $0.40/GB ingested beyond the free 100GB limit
- Pro Plan: $349/user for full platform user
- Rating: Pixie is not rated separately on G2 but is favorably discussed in Kubernetes and DevOps forums.
- Community sentiment: Generally positive for developer workflows, but commonly cited limitations include limited scope outside K8s and a steep learning curve.
Top 7 Pixie Alternatives
1. CubeAPM

Known For
Full-stack, OpenTelemetry-native APM platform built for cost efficiency, compliance, and smart trace sampling, ideal for teams needing scalable observability across MELT (Metrics, Events, Logs, Traces).
Key Features
- Full MELT Stack Observability: CubeAPM supports Metrics, Events, Logs, Traces, RUM, Synthetics, Infrastructure Monitoring, and Database Monitoring in a unified platform.
- Smart Sampling Engine: Uses context-aware, tail-based sampling to retain high-value traces (e.g. errors, latency spikes) while cutting storage costs by up to 70%.
- Self-hosted or Cloud Deployments: Supports full self-hosting with data stored in the user’s cloud or on-prem, ensuring data localization compliance and avoiding vendor lock-in.
- Native OTEL Support: Built from the ground up for OpenTelemetry pipelines. Also integrates with Prometheus, Elastic, and even Datadog or New Relic agents for easy migration.
- Real User Monitoring & Synthetics: CubeAPM natively tracks frontend performance, browser sessions, and supports synthetic tests—features Pixie lacks entirely.
- Unified Querying & Dashboards: Provides fast, correlated dashboards across logs, traces, metrics, and errors, enabling root-cause analysis in seconds.
Standout Features
- Smart Sampling drastically lowers costs without losing important telemetry
- Compliance-first design – All data stays in your control (SaaS or self-hosted)
- Zero per-host or per-user fees – Ingest and scale freely without surprise bills
- Real-time support via Slack or WhatsApp from core engineering team
- 1-hour migration from New Relic or Datadog with high agent compatibility
Pros
- Full-stack observability with full MELT support
- Simple, transparent pricing: $0.15/GB ingestion, $0.01/GB transfer, $0.02/GB infra
- No host/user-based billing
- Self-hosting and data sovereignty
- OTEL-native + high compatibility for easy switch
Cons
- Limited third-party integrations compared to large vendors like Datadog
- UI still maturing for large enterprise dashboards
- No built-in SIEM or security analytics module
Best For
Teams seeking cost-effective, OpenTelemetry-first observability with full control over deployment and compliance—especially in finance, healthcare, or enterprise IT environments.
Pricing & Customer Reviews
- $0.15/GB flat pricing with no extra cost for users, hosts, or basic features
- Rating: 4.7/5 (Slack and end-user feedback)
CubeAPM vs Pixie
CubeAPM is a unified, OpenTelemetry-native observability platform that provides full-stack visibility across metrics, traces, logs, and infrastructure from a single platform, with flexible self-hosted or managed deployment options. Compared to Pixie, CubeAPM is designed for broader environment coverage and sustained observability beyond in-cluster debugging, making it a more complete alternative for teams looking for long-term monitoring without platform lock-in.
2. Dynatrace
Known For
Dynatrace is an AI-powered full-stack observability platform with deep support for infrastructure monitoring, APM, digital experience monitoring (DEM), and security analytics in large enterprises.
Key Features
- Davis AI Engine: Dynatrace’s proprietary Davis AI automatically detects anomalies, pinpoints root causes, and reduces alert noise through causal analysis.
- Deep Code-Level APM: Provides code-level tracing, method hotspots, memory profiling, and auto-instrumentation across Java, .NET, Go, Node.js, and more.
- Real User & Synthetic Monitoring: Tracks frontend performance in real-time, including user sessions, click paths, and synthetic transaction monitoring.
- Security Monitoring (Application & Runtime): Embedded AppSec identifies vulnerabilities and misconfigurations across code and runtime environments, including containers.
- Infrastructure + Cloud Monitoring: Auto-discovers and monitors cloud-native services (e.g., AWS Lambda, Azure Functions, GCP) and hybrid infrastructure via OneAgent.
Standout Features
- Davis AI for automated root-cause detection and intelligent alerting
- All-in-one agent (OneAgent) for logs, metrics, traces, and security
- Strong mobile, web, and user behavior analytics
- Native integration with cloud providers for managed Kubernetes observability
Pros
- Highly automated and intelligent observability
- Single agent simplifies deployment
- Excellent frontend + backend correlation
- Security observability included
- Built-in SLOs and business KPI monitoring
Cons
- High cost for licensing, ingestion, and additional modules
- Complex pricing structure with varying costs per host, DEM units, and ingest
- Steep learning curve for new users
Best For
Enterprises with large-scale, cloud-native, and hybrid deployments needing intelligent, automated observability tied to business outcomes and application security.
Pricing & Customer Reviews
- Infrastructure Monitoring: $29/month per host
- Full-Stack Monitoring: $58/month per 8 GiB host
- G2 Rating: 4.5/5 – praised for automation and root-cause detection, but users highlight pricing opacity and UI complexity.
Dynatrace vs Pixie
Dynatrace is a full-stack observability platform with automated discovery, AI-driven root cause analysis, and broad coverage across applications and infrastructure. In contrast, Pixie by New Relic emphasizes instant, eBPF-based visibility for Kubernetes workloads, while Dynatrace focuses more on end-to-end observability, long-term analysis, and automated insights across complex environments.
3. New Relic
Known For
New Relic is a comprehensive SaaS-based observability platform covering APM, infrastructure monitoring, logs, RUM, synthetics, and dashboards, known for its high data volume capabilities and rich UI.
Key Features
- Full-Stack Observability Platform: Includes modules for APM, logs, metrics, traces, RUM, synthetics, serverless monitoring, and custom dashboards under one UI.
- Telemetry Data Platform (TDP): Collects and unifies billions of telemetry events with support for custom queries, dashboards, and alerts using NRQL.
- Pixie Integration: Pixie’s eBPF-powered telemetry can be streamed into New Relic for real-time Kubernetes observability and debugging.
- Applied Intelligence (AI-assisted Monitoring): Anomaly detection and incident intelligence to help reduce alert noise and auto-detect root causes.
- 800+ Integrations Ecosystem: Broad support across cloud platforms, developer tools, CI/CD, databases, and security systems.
Standout Features
- Unified platform for MELT data with high-scale telemetry storage
- Instant Observability Library with prebuilt dashboards and integrations
- APM with detailed transaction tracing and error analytics
- Integration with Pixie for in-cluster K8s debugging
Pros
- Rich feature set across the entire observability spectrum
- Fast onboarding and out-of-the-box dashboards
- Supports both OpenTelemetry and Pixie export pipelines
- Mature ecosystem with prebuilt assets and SDKs
- Good support for frontend RUM and synthetics
Cons
- Data egress from Pixie → New Relic cloud may breach data localization
- Steep learning curve for new users
- Expensive as usage grows
Best For
Mid-to-large organizations that want a unified SaaS observability solution with deep integrations and don’t require full control over data hosting or sampling.
Pricing & Customer Reviews
- Free Tier: 100GB/month ingested
- Pro plan: $0.40/GB ingested beyond the free 100GB limit
- Pro Plan: $349/user for full platform user
- G2 Rating: 4.4/5 – praised for its UI and completeness, but often critiqued for cost surprises, and complexity in scaling
New Relic vs Pixie
Pixie is a self-hosted, open-source Kubernetes debug tool; New Relic is a full-fledged observability suite. However, New Relic is costly, especially when data volumes grow. Pixie is ideal for K8s teams, while New Relic is best for teams wanting centralized MELT analytics—with cost trade-offs.
4. Datadog
Known For
Datadog is an enterprise-grade observability and security platform offering end-to-end monitoring across APM, infrastructure, logs, RUM, synthetics, and cloud security—widely adopted in modern cloud-native environments.
Key Features
- Comprehensive Observability Suite: Provides full coverage across MELT (Metrics, Events, Logs, Traces) including frontend monitoring (RUM), synthetic testing, CI visibility, and application security.
- 900+ Integrations Ecosystem: Extensive plugin and integration library for cloud providers (AWS, Azure, GCP), databases, CI/CD tools, orchestration, and third-party apps.
- Dashboards & Correlation: Powerful real-time dashboards with correlation across metrics, logs, and traces, enabling root-cause analysis within seconds.
- Log Management & Custom Retention: Ingest, index, and archive logs with flexible retention options. Indexed logs can be queried in real time, and archived logs stored in cloud buckets.
- Security Monitoring & Cloud SIEM: Threat detection and posture management for infrastructure and applications via integrated Cloud SIEM and Cloud Workload Security.
Standout Features
- Enterprise-grade MELT observability and security in a single UI
- 900+ prebuilt integrations with minimal setup
- Deep correlation across telemetry layers
- Marketplace for reusable monitors, dashboards, and workflows
- Real-time incident management workflows
Pros
- Broadest feature set among commercial vendors
- Excellent frontend + backend monitoring
- Easy setup and wide third-party compatibility
- Security observability (Cloud SIEM, CWPP) included
- Detailed billing usage reports (recent improvement)
Cons
- Complex and unpredictable pricing – heavily penalizes scale (users, hosts, cardinality)
- Steep learning curve, which might delay onboarding
- Users have raised concerns of complex initial setup and configuration
Best For
Enterprises with large-scale cloud-native stacks that need unified observability and security—assuming budget flexibility and tolerance for vendor lock-in.
Pricing & Customer Reviews
- APM (Pro Plan): $31/host/month
- Infra Monitoring(Pro Plan): $15/host/month
- G2 Rating: 4.4/5 – loved for features, but commonly criticized for billing complexity and surprise overages
Datadog vs Pixie
While Pixie is free, self-hosted, and K8s-native, Datadog is a broad-spectrum, SaaS-only platform with full MELT + security. However, Datadog’s cost becomes prohibitive at scale. Pixie wins on simplicity and cost; Datadog on breadth and integrations.
5. Middleware
Known For
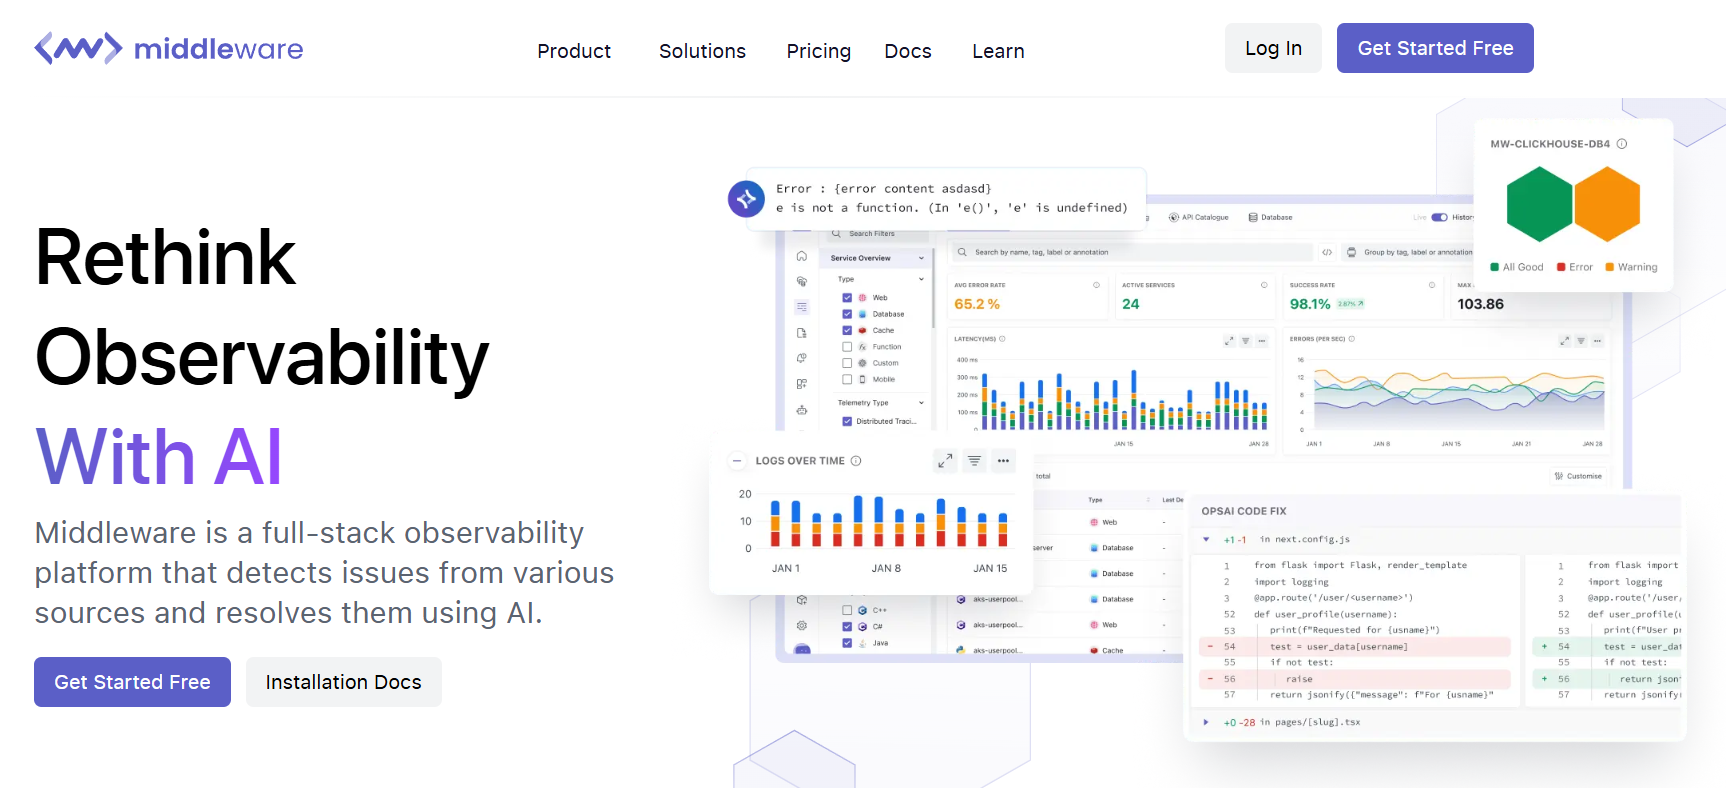
Middleware is a lightweight, developer-first observability platform tailored for small to mid-sized teams looking for performance insights, logs, and infrastructure monitoring—without the cost and complexity of enterprise tools.
Key Features
- Application Performance Monitoring: Tracks transactions, latency, throughput, and error rates across services with simple agent installation.
- Log Management: Offers centralized log ingestion with filtering, querying, and context correlation.
- Infrastructure Monitoring: Covers host-level and container-level resource usage, uptime, and health monitoring.
- Custom Dashboards & Alerts: Teams can configure dashboards and threshold-based alerts based on logs, traces, and metrics.
- GitHub & Slack Integrations: Provides basic incident notifications and integration with developer toolchains.
Standout Features
- Focused UX for developers and lean teams
- No-frills interface with essentials built-in
- Simpler onboarding and agent setup than Datadog or New Relic
- Cloud-native, but less resource-intensive
Pros
- Easy to set up and low learning curve
- Cost-effective for startups and growing teams
- Clean interface with performance-focused views
- Offers essential monitoring without clutter
Cons
- Users have reported a steep learning curve to effectively use the features
- Manual integrations are challenging for users
- Users find the dashboards not intuitive and need more customization
Best For
Startups and small teams that want affordable observability for backend services and infrastructure, without needing full enterprise features.
Pricing & Customer Reviews
- Free: up to 100GB data, unlimited users, 14-day retention
- Pay as you go: $0.3 GB of metrics, logs, traces; 30-day retention.
- Custom pricing
- G2 Rating: 4.6/5 – praised for simplicity, clarity, and value, though users note limitations at scale and lack of frontend support
Middleware vs Pixie
Pixie excels at in-cluster debugging and deep Kubernetes observability, whereas Middleware targets full-stack performance monitoring. Middleware is easier to onboard for non-Kubernetes setups. Pixie is stronger for K8s-native teams; Middleware is better suited for lean engineering teams with scaling needs.
6. Logz.io

Known For
Logz.io is a cloud-native observability platform built on popular open-source tools like ELK (Elasticsearch, Logstash, Kibana), Prometheus, and Jaeger. It provides centralized logging, metrics, tracing, and SIEM in a unified SaaS experience.
Key Features
- Centralized Log Management (ELK-based): Ingests logs from multiple sources, supports structured querying, dashboards, and alerting, with dynamic log filtering and archiving.
- Metrics Monitoring with Prometheus: Offers hosted Prometheus metrics collection, aggregation, and visualization, reducing the burden of running Prometheus at scale.
- Distributed Tracing with Jaeger: Supports Jaeger-based tracing for microservices architectures with out-of-the-box service maps and latency analysis.
- Cloud SIEM: Provides threat detection and log correlation for security teams using existing observability data.
- OpenTelemetry Support: Supports OTEL ingestion for traces and metrics, enabling broader compatibility with cloud-native stacks.
Standout Features
- Built on familiar open-source stacks (ELK, Prometheus, Jaeger)
- Combines observability and security in one platform
- Offers long-term log archiving and analytics
- OTEL-native ingestion and correlation
Pros
- Strong log analytics with full-text search and filtering
- Familiar UI and tooling for ELK users
- Native support for Prometheus, OTEL, Jaeger
- Security event monitoring included
- Scalable SaaS offering for observability and compliance
Cons
- Pricing is volume-based and expensive at scale
- Overage charges for indexing and retention
- Steep learning curve for new users
Best For
Engineering and DevSecOps teams that want hosted open-source observability stacks with security integrations and don’t want to manage ELK or Prometheus themselves.
Pricing & Customer Reviews
- APM: $0.07 per host-hour per month,
- RUM: $1.96 per 10K views/month
- Logs: $2/GB/month
- Infra: $0.021
- Synthetics: $1.5/10k checks/month
- Analytics: $1/10k events/month
- G2 Rating: 4.3/5 – known for log visibility, but users flag pricing unpredictability, especially on ingestion spikes
Logz.io vs Pixie
While Pixie is focused on low-level, in-cluster K8s observability, Logz.io offers a cloud-hosted version of ELK + Prometheus + Jaeger with broader telemetry support. However, Logz.io can become expensive at scale, especially for logging-heavy environments. Pixie is better for developer debugging in-cluster, whereas Logz.io excels in centralized log + metric analytics across full-stack environment.
7. Elastic Observability
Known For
Elastic Observability is the observability suite of Elastic (ELK Stack), combining logs, metrics, traces, and synthetics in one platform. It’s known for its flexible deployments, strong log analytics, and search-first architecture.
Key Features
- Unified Observability Across Logs, Metrics & Traces: Built on Elasticsearch, Elastic offers deep telemetry correlation across APM traces, infrastructure metrics, and logs—with customizable dashboards and alerts.
- Flexible Deployment Models: Can be deployed self-hosted, on Elastic Cloud, or via Elastic Cloud on Kubernetes (ECK)—supporting full data control and compliance flexibility.
- APM & Service Maps: Supports distributed tracing for common languages (Java, Node.js, Python, .NET, Go) with service-level metrics and automatic service maps.
- Real User & Synthetic Monitoring: Tracks frontend user behavior, session performance, and offers uptime testing with synthetic checks.
- Machine Learning for Anomaly Detection: Elastic’s ML engine detects anomalies across logs and metrics for pre-emptive alerting.
Standout Features
- Built on battle-tested ELK architecture
- Offers both self-hosted and managed SaaS options
- Native machine learning for anomaly detection
- Combines observability and search-driven analytics in one stack
Pros
- Strong logging and search capabilities
- Full control with self-hosting options
- Elastic Agent enables unified data collection
- ML-powered alerting and data anomaly detection
- Native OpenTelemetry support and scalable architecture
Cons
- High operational overhead when self-hosting ELK at scale
- Cost can escalate with high data volume in SaaS mode
- Sampling lacks contextual/tail-based logic
- Query and dashboard performance can degrade under large datasets
- UI is less intuitive than newer tools like Datadog or New Relic
Best For
Teams that want full control over their observability stack, especially with self-hosted, search-centric telemetry analysis and strong log monitoring.
Pricing & Customer Reviews:
- Hosted: resource-based, ranges $99-184/month
- Serverless: usage-based, $0.15/GB of data ingested
- Self-managed: license-based, depends on the number of nodes and RAM used
- Synthetic monitoring: $0.0123 per test run
- G2 Rating: 4.2/5 – praised for power and flexibility, though self-hosted users report high maintenance and tuning requirements
Elastic Observability vs Pixie
Pixie delivers Kubernetes-specific, real-time observability using eBPF, while Elastic Observability offers a broader log-centric observability suite with flexible deployment. Elastic’s strength is in search, analytics, and log correlation, but it lacks Pixie’s low-level, zero-instrumentation K8S telemetry and incurs higher maintenance overhead when self-hosted.
Conclusion
While Pixie offers powerful in-cluster observability for Kubernetes using eBPF and zero-instrumentation tracing, costs can scale when prices are high. As teams scale or require compliance-ready deployments, Pixie’s Kubernetes-only model and resource overhead become limiting.
CubeAPM emerges as the best alternative—offering full MELT coverage, OpenTelemetry-native ingestion, smart sampling, and both self-hosted and cloud options. With flat $0.15/GB pricing and zero per-host/user fees, it provides scalable observability without billing surprises—something that tools like Datadog, New Relic, and Dynatrace struggle with. For teams needing performance, flexibility, and compliance, CubeAPM is the clear choice.
Disclaimer: The information in this article reflects the latest details available at the time of publication and may change as technologies and products evolve.
FAQs
1. What are the best alternatives to Pixie by New Relic?
Some of the best alternatives to Pixie include CubeAPM, Datadog, New Relic (full platform), Dynatrace, Elastic Observability, Logz.io, and Middleware. These tools offer broader observability features like RUM, alerting, and full MELT coverage that Pixie lacks.
2. Why are teams switching from Pixie to other observability tools?
Teams switch from Pixie due to its Kubernetes-only scope, lack of native alerting, frontend monitoring, and smart sampling. While Pixie is strong for live debugging, it doesn’t scale well for production observability or compliance-heavy use cases.
3. Is Pixie by New Relic free to use?
Yes, the open-source version of Pixie is free to self-host inside Kubernetes. However, when used via New Relic’s managed integration, telemetry is streamed to their SaaS platform and subject to usage-based pricing and data residency limitations.
4. Which Pixie alternative supports smart sampling and predictable pricing?
CubeAPM is the top Pixie alternative offering context-aware smart sampling and flat pricing at $0.15/GB with no per-host or user fees. It’s ideal for teams looking to scale observability while controlling costs.
5. Can I self-host a Pixie alternative with full MELT observability?
Yes, tools like CubeAPM and Elastic Observability support self-hosting. CubeAPM in particular provides full-stack MELT (Metrics, Events, Logs, Traces) support while keeping all telemetry within your cloud for data localization and compliance.


