Logpoint is a SIEM platform that offers log management, compliance monitoring, and threat detection. With the log management market expected to reach US$ 9.4 billion by 2030 at a CAGR of 12.1%, tools like Logpoint are increasingly evaluated by enterprises seeking deeper observability.
However, Logpoint is not a full-stack observability platform and users on platforms, such as G2, have complaints regarding its slow and confusing interface and limited features. CubeAPM is the best Logpoint alternative if you’re looking for a full-stack observability platform, OpenTelemetry-native ingestion, and cost-efficiency.
In this article, we’ll explore the top Logpoint alternatives based on features, pricing, OTEL support, and customer feedback.
Top 7 Logpoint Alternatives
- CubeAPM
- Datadog
- New Relic
- Dynatrace
- Splunk Observability
- Sumo Logic
- Graylog
Why APM Complements Security Monitoring
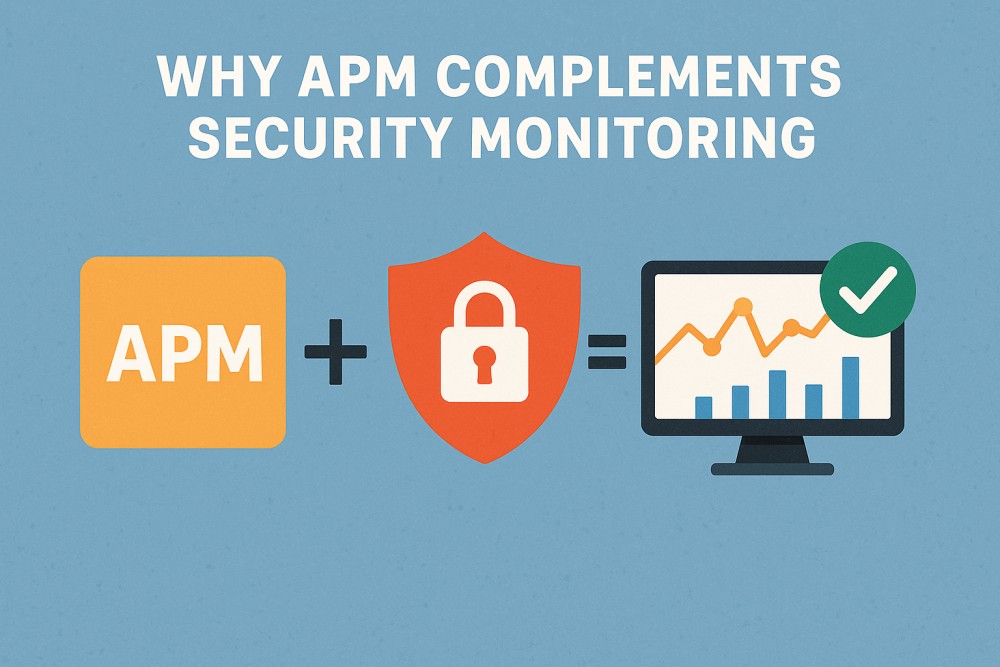
Security monitoring tools like Logpoint excel at collecting and correlating security event data—for example, firewall logs, user access logs, and threat intelligence feeds. These insights are critical for detecting malicious activity and ensuring compliance. However, security telemetry alone cannot explain how applications behave under load, where latency occurs, or why user experience degrades.
APM fills this gap by capturing metrics, traces, and logs at the application level—tracking transaction flows, database calls, and API latency. Combined with security data, APM creates a complete picture of system health and performance. For instance, failed login spikes may indicate a brute-force attack, while correlated API latency highlights stress in the authentication service. Together, APM and security monitoring enable faster root-cause analysis and more resilient operations.
Logpoint and APM: Why Security Logs Alone Can’t Deliver Observability
Logpoint is purpose-built as a SIEM and security analytics platform, designed to ingest and correlate event data from servers, endpoints, and network devices. This makes it excellent for detecting intrusions, monitoring compliance frameworks, and investigating threats. But it focuses on logs and security, and doesn’t offer full-stack monitoring across infrastructure and user behaviour in real time.
True observability requires metrics, logs, and traces (MELT) working together. Security logs may show failed login attempts or access anomalies, but they don’t reveal transaction latency, service bottlenecks, or user experience impact. Without APM features like distributed tracing or RUM, teams miss the bigger picture—making it harder to connect security signals with overall application health. This is why organizations pair SIEM with APM tools to bridge security insights with operational observability and improve protection and user experience.
Why People Are Looking for Logpoint Alternatives
Not a Full-Stack Observability Solution
Logpoint positions itself as a converged SIEM solution that includes SOAR, NDR, UEBA, EDR, and SAP monitoring capabilities. While this makes it strong in security and compliance use cases, it doesn’t offer full-stack observability capabilities, such as distributed tracing, real user monitoring (RUM), and synthetic monitoring.
Performance and scale complaints on large datasets
Logpoint is often reported to slow down on very large log volumes, with queries and dashboards taking longer to load unless advanced tuning is applied. This creates friction for enterprises ingesting terabytes of data, where quick searches are critical during incidents. Users also point out that its reporting and visualization tools are less flexible than Splunk’s, making it harder to drill into logs or generate detailed reports.
Operational friction and setup complexity
Logpoint’s setup and configuration are frequently described as cumbersome, and the platform’s proprietary query language has a steep learning curve. These issues complicate deployment across diverse, hybrid environments and slow down time-to-value. Although users appreciate the core SIEM functionality, several G2 reviewers lament the lack of cross-platform ease-of-use and the additional operational burden this creates.
Criteria for selecting Logpoint alternatives
Full MELT + true APM
A strong alternative should deliver Metrics, Events, Logs, and Traces in one unified platform, along with distributed tracing, RUM, and synthetic monitoring. This ensures teams can monitor both infrastructure and user experience without juggling multiple tools.
OpenTelemetry-native ingestion
Look for platforms with native OpenTelemetry (OTEL) support, so you can instrument once and send data anywhere without lock-in. OTEL-first tools simplify adoption in Kubernetes, serverless, and multi-cloud environments.
Transparent, scalable pricing
Choose solutions that offer usage-based or per-GB pricing instead of seat-based minimums. This model aligns with real observability growth, preventing the unpredictable costs that often frustrate Logpoint users.
Sampling & cost efficiency
Modern observability tools should offer signal-aware sampling that keeps critical anomalies (errors, latency spikes) while cutting redundant data. This reduces ingestion and storage costs by up to 70–80% without sacrificing visibility.
Deployment flexibility & compliance
Regulated industries need platforms that support SaaS, on-prem, or hybrid deployments. Ensure the vendor offers data residency controls for GDPR, HIPAA, or DPDP so telemetry never leaves approved regions.
Performance & ease of use
An effective alternative should be optimized for speed at scale, handling terabytes of logs without constant tuning. Easy-to-use dashboards and reporting save engineers time and improve incident response.
Support quality
Finally, evaluate the support model. Tools that offer real-time channels (Slack/WhatsApp) with fast response times outperform ticket-only systems, ensuring critical issues are resolved in minutes, not days.
Logpoint Overview
Known for
Logpoint is primarily known as a converged SIEM platform combining SIEM, SOAR, UEBA, EDR, and SAP monitoring. It is widely used for compliance-driven security monitoring, especially in Europe, where data sovereignty and regulatory coverage are critical.
Standout Features
- Hypergraph threat correlation: Links detections across sources for faster context and investigation.
- Compliance dashboards: Offers pre-built dashboards to track GDPR, PCI-DSS, SOX, and NIS2 status.
- Multitenancy & EU focus: Designed for MSSPs and European organizations with strict data privacy needs.
Key Features
- Ingestion & normalization: Collects and standardizes logs with built-in taxonomy and enrichment.
- Default Syslog ingestion: Enables immediate log capture after install with minimal configuration
- Automated log source monitoring: Alerts when sources go inactive to prevent data loss.
- Playbook-driven SOAR: Offers case management, automation, and MITRE ATT&CK mapping.
- File Integrity Monitoring (FIM): Detects unauthorized file changes using hashing and threat intelligence.
Pros
- Ease of use and relatively quick to learn
- Clear and straightforward management interface
- Strong integrations with UEBA and SAP environments
Cons
- Lacks advanced features compared to Splunk-style platforms
- Can become expensive at scale
- Logs and dashboards are less polished and informative
Best for
Logpoint is best suited for enterprises and MSSPs needing a compliance-first SIEM/SOAR solution, especially in regulated European markets where data residency and multitenant control are critical.
Pricing & Customer Reviews
- Pricing: Needs you to request pricing. SaaS pricing follows a node-based licensing model, starting with a 100-node minimum, with additional costs for premium add-ons.
- G2 rating: 4.3/5 (97 reviews)
- Praised for: Easy onboarding, regulatory readiness, and quality of customer support
- Criticized for: Slower interface, not a full-stack observability tool
Top 7 Logpoint Alternatives
1. CubeAPM
Known for
CubeAPM is recognized as an OpenTelemetry-native observability platform that unifies Metrics, Events, Logs, and Traces under one roof. It is designed for organizations that want cost-efficient, full-stack APM with the flexibility to run on-prem or in their own cloud.
Standout Features
- Smart Sampling: Reduces ingestion volume by filtering noise while retaining critical anomalies, cutting costs significantly.
- Real-time support: Direct Slack/WhatsApp access to core engineers with sub-5 minute response times.
- Self-hosting: offers this option so you can have full data residency control and manage compliance with GDPR, HIPAA, DPDP, etc.
Key Features
- Distributed Tracing: Pinpoint performance bottlenecks across distributed services.
- Log Monitoring: Real-time ingestion and correlation for system-wide log analysis.
- Synthetic Monitoring: Simulate user interactions and API tests from global locations.
- Real User Monitoring (RUM): Capture actual user experience across web and mobile applications.
- Error Tracking: Detect, categorize, and analyze application errors automatically.
- 800+ Integrations: Ready-to-use connectors across popular cloud, infra, and developer tools.
Pros
- Simple, transparent $0.15/GB pricing with no hidden costs
- Supports 800+ integrations and vendor compatibility without egress fees
- Full MELT coverage with OpenTelemetry-native architecture
Cons
- May not suit those teams that prefer a full SaaS platform
- Focused purely on observability; does not include cloud security management features
Best for
CubeAPM is best for engineering-driven organizations that need affordable, vendor-neutral observability without lock-in. It is especially valuable for data-sensitive enterprises, regulated industries, and scale-ups managing large telemetry volumes, where self-hosting, compliance, and predictable pricing provide a decisive advantage over traditional SIEM-first tools like Logpoint.
Pricing & Customer Reviews
- Pricing: Simple $0.15 per GB ingested; no additional infra, transfer, or user charges
- G2 Score: 4.7/5
- Praised for: Transparent pricing, cost efficiency at scale, high-quality real-time support
CubeAPM vs Logpoint
Unlike Logpoint’s SIEM-centric model, CubeAPM provides true end-to-end observability with tracing, logging, metrics, RUM, and synthetics in one platform. It is cost-efficient, OTEL-native, and egress-free, giving teams both flexibility and modern APM depth.
2. Datadog
Known for
Datadog is recognized as a cloud-native observability and security platform that brings together infrastructure monitoring, APM, logs, RUM, synthetics, and security monitoring into a single SaaS solution. It is widely used by enterprises running hybrid and multi-cloud environments.
Standout Features
- Single-step instrumentation & agent-based visibility: Easy setup with automatic tracing and telemetry enrichment.
- Fine-grained sampling controls: Manage trace retention and costs directly at service and endpoint levels.
- AI-powered insights: Automated anomaly detection and root-cause analysis via Datadog Watchdog.
Key Features
- Distributed Tracing, APM & RUM: Full-stack visibility from backend services to frontend user experience.
- Log Management & Analytics: Correlates logs with metrics and traces in real time.
- Synthetic & Network Monitoring: Simulates user journeys globally and measures service-to-service connectivity.
- Infrastructure, Security & Cost Monitoring: Covers hosts, containers, cloud spend, and threat detection in one interface.
Pros
- Comprehensive observability and security coverage
- Rapid instrumentation and powerful dashboards
- 800+ integrations for quick deployment
Cons
- Expensive for smaller teams
- SaaS-only; no self-hosting
Best for
Datadog is best for large enterprises and mid-sized teams managing complex, distributed architectures. It is particularly useful for organizations that want to consolidate observability, security, and cost monitoring in a single platform and are comfortable with SaaS-first deployment models.
Pricing & Customer Reviews
- Pricing: Modular pricing model—for example, $15 per host/month for infrastructure monitoring, $31 per host/month for APM, $0.10 per GB for logs, and $2 per 10,000 sessions for RUM.
- G2 rating: 4.4/5
- Praised for: Unified dashboards, speed of ingestion, and a wide integration ecosystem
- Criticized for: High costs, SaaS-only
Datadog vs Logpoint
Logpoint is focused on SIEM and compliance monitoring, while Datadog provides broad-spectrum observability across infrastructure, applications, logs, and security. For teams needing real-time visibility and deep integration coverage, Datadog offers greater observability functionality, though at a higher and less predictable cost.
3. Dynatrace
Known for
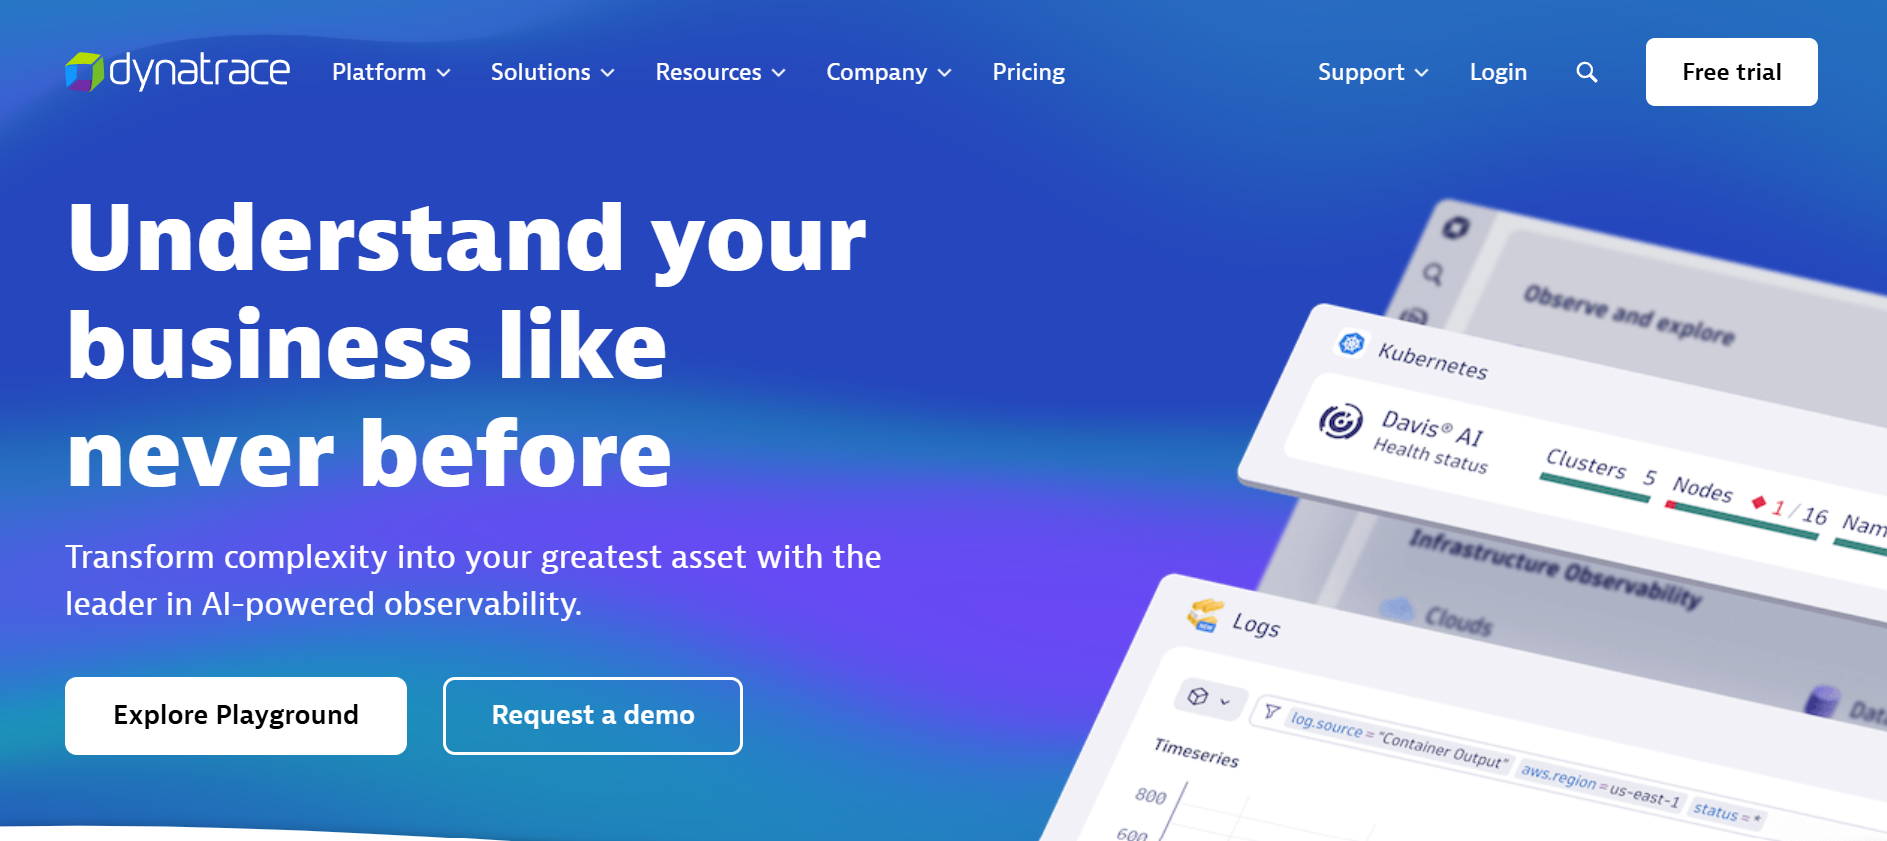
Dynatrace is known for delivering AI-powered full-stack observability and security—covering applications, infrastructure, logs, digital experience, and business analytics in one unified platform. It excels in automating discovery and root cause analysis for enterprise-scale, hybrid environments.
Standout Features
- Davis® AI engine: Offers predictive, causal, and generative AI for anomaly detection, automated root-cause analysis, and remediation guidance.
- Smartscape & Grail™ data lakehouse: Automatically maps dependencies across the stack and stores context-rich data in a scalable, indexless storage.
- AppEngine & AutomationEngine: Build custom dashboards, workflows, and automations for DevOps, SecOps, and BizOps teams.
Key Features
- OneAgent auto-instrumentation: Instantly captures traces, logs, metrics, and topology with minimal setup.
- PurePath distributed tracing: Provides code-level visibility across service calls and dependencies.
- RUM & Synthetic monitoring: Tracks real-user behavior and simulates user journeys to detect performance issues.
- Application Security & Threat Observability: Continuously monitors vulnerabilities and threats within applications.
- OpenTelemetry support: Seamlessly integrates OTEL data into Dynatrace analytics for flexible ingestion.
Pros
- AI-based insights and automated issue detection help reduce troubleshooting time
- Rich feature set covering observability, security, and business metrics in one platform
- Highly scalable, designed for enterprise environments and complex tech stacks
Cons
- Can be expensive for smaller teams
- Learning curve
Best for
Dynatrace is best suited for large, enterprise-level organizations managing complex, distributed, or multi-cloud environments where AI-driven automation and stitched cross-domain visibility are critical. It benefits teams aiming to drive fast incident resolution, operational efficiencies, and proactive observability at scale.
Pricing & Customer Reviews
- Pricing: $0.08/hour/8 GB host for full-stack monitoring.
- G2 rating: 4.5/5
- Praised for: AI-based insights, security observability
- Criticized for: Cost, difficulty learning
Dynatrace vs Logpoint
Compared with Logpoint’s SIEM-first, compliance-oriented design, Dynatrace offers broader observability depth with AI-powered automation across systems, security, and business metrics, but at a higher complexity and cost.
4. New Relic
Known for
New Relic is known for its unified full-stack observability platform—over 50 capabilities in one interface, from application performance to infrastructure, logs, synthetic and real-user monitoring, AI-powered insights, and even cost and security observability—all designed to eliminate tool silos.
Standout Features
- Unified telemetry across MELT and beyond: Delivers APM, metrics, events, logs, RUM, synthetics, infrastructure, security, and AI ops in a single view.
- Open and extensible: Supports OpenTelemetry ingestion, plus 780+ integrations, promoting flexibility and avoiding vendor lock-in.
- AI-enhanced intelligence: Automated anomaly detection and alert noise reduction through the built-in AIOps engine.
Key Features
- APM 360 & distributed tracing: Dive deep into transaction paths and service dependencies.
- Logs in context: Automatically correlate logs, traces, APM errors, and infrastructure metrics.
- Kubernetes monitoring: provides eBPF-based auto-discovery plus span sampling for monitoring your Kubernetes environment.
- Custom dashboards & alerts: Drag-and-drop dashboards, change tracking, and customizable SLIs/SLOs across telemetry planes.
- Database & Mobile/Browser monitoring: Built-in dashboards for DB performance and detailed OS/network/mobile app metrics.
- Service Level Management: Set and visualize SLIs and SLOs with built-in alerting.
Pros
- Broadest observability capabilities under a single platform
- Massive integration ecosystem and openness with OTEL support
- Powerful AI-driven issue detection and alerting
Cons
- User- and data-ingest pricing can be costly at scale
- SaaS-only; no self-hosting
Best for
New Relic is best for organizations seeking an all-in-one telemetry platform that supports deep observability, AI-driven insights, and flexible user models. It shines for teams aiming to centralize APM, infrastructure, logs, RUM, security, and cost monitoring—especially where cross-team collaboration and proactive incident response are essential.
Pricing & Customer Reviews
- Pricing: Free tier; usage-based ingestion pricing—starting at $0.40 per GB.
- G2 rating: 4.4/5
- Praised for: Feature breadth, unified view, and deep telemetry correlations
- Criticized for: High pricing at scale, SaaS-only
New Relic vs Logpoint
While Logpoint is SIEM-centric and compliance-first, New Relic delivers true full-stack observability with tracing, logs, metrics, RUM, and AI-powered monitoring—all in one unified interface. For teams seeking deep operational insights across applications and infrastructure (not just security logs), New Relic provides far more breadth and depth, though at a higher pricing model.
5. Splunk AppDynamics
Known for
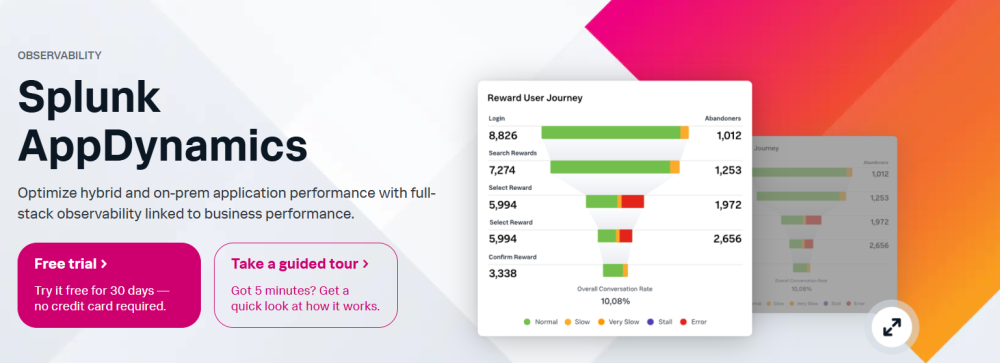
Splunk AppDynamics delivers full-stack observability tightly linked to business outcomes—optimizing hybrid and on-prem application performance with deep insights into user journeys, network dependencies, and SAP systems.
Standout Features
- Business-to-metric correlation: Visualizes how application and infrastructure performance directly affect business KPIs like revenue and conversions.
- AI-driven anomaly detection: Uses machine learning to surface anomalies and pinpoint root causes across complex, hybrid architectures.
- Digital Experience Monitoring (DEM): Combines RUM, synthetic monitoring, and network insights for complete user journey visibility.
Key Features
- APM & Business Analytics: Monitors performance across three-tier and hybrid apps, down to method-level code diagnostics.
- Application Security: Detects runtime vulnerabilities and threats, prioritizing issues based on their impact on business outcomes.
- SAP Performance Monitoring: Offers specialized support with ABAP-level diagnostics, metrics, and dashboards for business-critical SAP operations.
- Network Performance Correlation: Analyzes ISP, API, SaaS, and third-party service performance, mapping them against app responsiveness.
- Log Integration via Observer Connect: Seamlessly link AppDynamics insights to Splunk Platform logs for contextual troubleshooting across systems.
Pros
- Strong alignment between technical observability and business health
- Powerful hybrid and legacy application visibility, including SAP
- Advanced AI-automated anomaly detection and root cause insight
Cons
- Alert issues
- Slower innovation/update cycle
Best for
Splunk AppDynamics is best for enterprises with hybrid or legacy application landscapes—especially those running three-tier and SAP systems—that need observability tied to business metrics, deep performance diagnostics, and AI-guided insights. It excels for teams wanting both infrastructure visibility and business impact clarity.
Pricing & Customer Reviews
- Pricing: starts $6/host/month
- G2 rating: 4.3/5
- Praised for: Clear business-to-performance mapping, deep diagnostics, and scalability
- Criticized for: Alert inefficiencies
Splunk AppDynamics vs Logpoint
Unlike Logpoint, which focuses on compliance-centered SIEM, Splunk AppDynamics provides deep APM-level observability with real-time business context, AI anomaly detection, and hybrid application support. It’s suitable for teams prioritizing performance, user experience, and measurable business outcomes, but a higher price point.
6. Sumo Logic

Known for
Sumo Logic is a cloud-native, all-in-one observability and security analytics platform. It combines logs, metrics, traces, and real-time machine learning-powered insights to enable visibility across applications, infrastructure, and security.
Standout Features
- OpenTelemetry-native ingestion: Ingest logs, metrics, and traces natively with OTEL, simplifying instrumentation and observability.
- Dynamic Observability with AI/ML: Features like Mo Copilot allow natural-language querying of telemetry data for faster insights.
- Free data ingest: New customers benefit from a unique pricing model where log ingest is free, and billing is tied to analytics and scan usage, not data volume.
Key Features
- Full MELT support: Unified log analytics, metrics, and trace data across applications, microservices, containers, and orchestrators.
- Entity-based context & dashboards: Automatically maps service dependencies and metadata for intuitive troubleshooting.
- Live Tail & patented querying tools: Use LogReduce, LogCompare, and LogExplain for real-time log analysis and anomaly detection.
- Wide observability and security layers: Includes infrastructure, APM, RUM, cloud/SIEM observability, and automated compliance dashboards.
- AWS Observability apps: Pre-configured dashboards for AWS services with metadata tagging and cross-account visibility.
Pros
- Offers full observability across logs, metrics, and traces
- Innovative AI features for query assistance and insights
- Flexible ingest pricing model that eases cost spikes
Cons
- UI performance issues
- Steep learning curve
Best for
Sumo Logic is best for DevSecOps teams at cloud-native organizations that need AI-enhanced observability at scale without ingest charges. Its flexible pricing model and feature-rich analytics make it particularly appealing for teams that want to leverage logs as a system of record combined with proactive AI support.
Pricing & Customer Reviews
- Pricing: Free tier; logs start at $3.14/TB of data scanned
- G2 rating: 4.3/5
- Praised for: Unified visibility, flexible pricing model, OTEL support, and powerful AI query tools
- Criticized for: Steep learning curve, UI issues
Sumo Logic vs Logpoint
Unlike Logpoint’s compliance-focused SIEM, Sumo Logic offers broader observability with MELT support, AI-driven insights, and flexible ingest pricing. It’s a more modern platform for DevSecOps teams needing operational and security visibility combined—providing deeper visibility and smarter analytics at scale.
7. Graylog

Known for
Graylog is a powerful log management and security analytics platform, offering centralized log ingestion, analysis, and threat detection—all without requiring rigid licensing or inflexible vendor lock-in.
Standout Features
- Smart ingestion pipeline & data routing: Built-in tools allow tiered storage, log preview, and selective restoration to control costs without third-party add-ons.
- Flexible, consumption-based pricing: Pay only for actively stored data—across cloud or on-prem—aligning expenses with actual usage patterns.
- Deployment freedom: Available as a self-managed open-source version, cloud-hosted, or enterprise edition—with feature parity across deployment types.
Key Features
- Full log management stack: Supports ingestion, search, dashboards, enrichment, alerts, and incident handling in one platform.
- Scalable architecture with data lake: Handles hot, warm, and archival tiers along with active standby data retrieval for efficient analysis.
- Security add-ons (Enterprise & Security editions): Bring UEBA, SIEM-like detection, MITRE ATT&CK alerts, and threat scoring atop log management.
- Compliance automation: Enterprise packages include role-based access, audit logs, and prebuilt reporting for regulated environments.
- Extensibility & community: Strong community, content packs (via Illuminate), professional support, and training (via Graylog Academy).
Pros
- Highly cost-effective log management
- Flexible deployment modes (open-source, self-hosted, cloud)
- Smart data tiering avoids over-consumption costs
Cons
- Initial setup has a learning curve, especially for non-technical teams
- UI and dashboards issues
Best for
Graylog is ideal for IT and security teams needing a cost-efficient, flexible log analytics platform, especially in environments where on-premises control, consumption-based billing, and compliance support matter. Its modular offerings make it scalable and adaptable to both small and large environments.
Pricing & Customer Reviews
- Pricing: Free open-source core version; Enterprise starts at ~$15,000/year, Security at ~$18,000/year
- G2 rating: 4.4/5
- Praised for: Transparency of cost, flexibility, and speed of log processing
- Criticized for: Complex setup and less refined dashboards
Graylog vs Logpoint
Graylog offers a highly adaptable and cost-conscious log management solution compared to Logpoint’s compliance-first SIEM approach. With Graylog, users get efficient log analytics, consumption-based pricing, and control over deployment environments.
Conclusion
While Logpoint delivers strong SIEM and compliance monitoring, it’s not a full-stack observability solution, and its UI can be slower and confusing at times.
CubeAPM is the best Logpoint alternative, offering full MELT coverage, OpenTelemetry-native support, 800+ integrations, smart sampling, self-hosting options, and a simple $0.15/GB pricing with no egress fees.
Switch to CubeAPM today by taking a free demo.
Disclaimer: The information in this article reflects the latest details available at the time of publication and may change as technologies and products evolve.
FAQs
1. Why should companies look for Logpoint alternatives?
Companies consider Logpoint alternatives due to limited APM features, complex setup, and UI issues. Modern organizations often require full observability, flexible deployment, and predictable costs.
2. What is the best alternative to Logpoint?
CubeAPM is the best Logpoint alternative, offering full MELT coverage, OpenTelemetry-native support, self-hosting, 800+ integrations, smart sampling, and $0.15/GB pricing.
3. Is CubeAPM a cost-effective alternative to Logpoint?
Yes, CubeAPM is a cost-efficient alternative to Logpoint with $0.15/GB of ingested data with no egress fees—often reducing costs by up to 50% for companies ingesting higher data volumes.
4. Which other tools compete with Logpoint besides CubeAPM?
Popular Logpoint alternatives are CubeAPM, Datadog, New Relic, Dynatrace, Splunk AppDynamics, and Graylog. These tools vary in focus—some excel in AI-driven automation, others in pricing transparency or flexible deployment.
5. Is Logpoint suitable for full observability use cases?
No. Logpoint is a SIEM-first platform, strong in compliance and threat detection but lacking full-stack observability capabilities, such as application performance monitoring, distributed tracing, and user experience monitoring. For full observability, teams prefer CubeAPM or Datadog/New Relic/Dynatrace, depending on needs and budget.


