Logmanager is a cloud‑based log management and SIEM platform that streamlines log data aggregation, normalization, and analysis. As the global log management and SIEM market is projected to reach US$ 11.96 billion by 2030, and organizations handle large data volumes, Logmanager has positioned itself around compliance and reporting capabilities.
However, Logmanager offers log-centric observability, not full-stack, as in monitoring and correlating a full set of metrics, traces, infrastructure monitoring, and distributed tracing. Some users also complain about it being complex to set up and customize and experience a learning curve.
In that context, CubeAPM is the best Logmanager alternative for modern engineering teams. It offers full support for OpenTelemetry (OTEL), comprehensive MELT observability, smart sampling, alerting dashboards, and self-hosting. In this article, we’ll explore the top Logmanager alternatives to help you make a choice that fits your needs.
Top 7 Logmanager Alternatives
- CubeAPM
- Datadog
- Dynatrace
- New Relic
- Splunk Appdynamics
- Elastic Observability
- Graylog
Why Logs Alone Aren’t Enough: Log Management vs. APM in Modern Observability
Logs are useful for spotting errors and compliance events, but in today’s distributed systems, they create gaps. A single request can span dozens of services and generate thousands of log lines, making it hard to stitch together a complete picture. Teams often end up asking: Was it the database, the API timeout, or the network hop? Logs alone rarely provide that clarity.
APM tools close this gap by collecting traces that follow requests end-to-end, automatically correlating them with metrics like latency, CPU, or memory, and overlaying deploys or config changes for context. Combined with real user and synthetic monitoring, this turns fragmented data into actionable signals, helping engineers see not just what failed, but where and why.
Why APM Tools Like CubeAPM Go Beyond Logs

CubeAPM is designed to solve the gaps left by log-only platforms by offering end-to-end observability with full MELT coverage—Metrics, Events, Logs, and Traces—alongside real user and synthetic monitoring. Instead of manually piecing together log lines, teams get complete visibility into request flows, system health, and user impact in one place.
Key ways CubeAPM goes beyond log management:
- Distributed tracing: Follows requests across microservices, APIs, and databases to pinpoint slowdowns and errors.
- Smart sampling: Retains only the most valuable traces, cutting ingestion volumes while preserving accuracy.
- Compliance & control: Self-hosting options with no egress fees ensure data sovereignty.
- Broad ecosystem: 800+ integrations plus OpenTelemetry and Prometheus-native ingestion for future-proof instrumentation.
- Developer-first support: Real-time Slack/WhatsApp access to engineers, reducing resolution times from days to minutes.
By combining these capabilities, CubeAPM turns observability into a proactive advantage. It not only helps teams detect and resolve issues faster but also optimizes infrastructure costs and improves end-user experience—a level of value that logs alone can’t provide.
Why Are People Looking for Logmanager Alternatives?
Limited Observability
Logmanager excels in centralized log collection, compliance dashboards, and SIEM features, offering strong support for log aggregation and rule-based alerting. However, it does not position itself as a full-stack observability platform with capabilities such as distributed tracing, Real User Monitoring (RUM), or synthetic monitoring.
Retention clarity and data rollover concerns
In Logmanager, data storage quotas are determined by plan tier, and once those limits are reached, “the oldest data is overwritten”, as explianed in its FAQs section under the pricing page. Organizations needing guarantees for long-term retention, such as those facing audit, forensic, or regulatory requirements, must validate this carefully to prevent the risk of data loss.
Complexity and Learning Curve
Reviews from G2 reflect a mixed sentiment toward Logmanager. Users praise its intuitive dashboards and ease of use in log-centric workflows. However, the same reviews often cite “complex setup/configuration,” “limited customization,” and a steep learning curve when scaling the tool across varied environments or use cases.
Criteria for Selecting Logmanager Alternatives
Full MELT Coverage
Modern observability goes beyond log management and requires metrics, events, logs, traces, RUM, and synthetics in one stack. Full MELT coverage in a tool means you get better visibility across your applications and infrastructure. This unified approach shortens mean time to detection and resolution while avoiding tool sprawl.
OpenTelemetry (OTEL) Support
OTEL is the universal standard for telemetry collection, helping teams instrument once and stay vendor-agnostic. Tools with native OTLP ingestion and collector support allow data portability across platforms without costly rework. This ensures long-term flexibility as architectures evolve or compliance needs shift.
Sampling Strategy
Data ingestion volumes are growing rapidly, and uncontrolled collection drives costs higher. Alternatives should include context-aware sampling that retains high-value traces, such as those with errors or latency spikes. This balances observability depth with cost predictability, ensuring engineering teams see what matters most.
Deployment Flexibility
Not every organization can adopt SaaS-only tools due to compliance or latency constraints. Strong alternatives offer both cloud-hosted and on-prem/self-managed deployments, letting teams choose the right balance of scalability and control. This is essential for industries governed by strict data protection regulations.
Transparent Pricing
Pricing should be clear, predictable, and easy to model at scale. Tools that charge per GB ingested or per host provide straightforward budgeting, unlike source-based or add-on-heavy models that become unpredictable. Transparency here helps avoid hidden fees and makes cost forecasting simpler for finance teams.
Responsive Support
Fast support is critical during outages and incidents. Look for vendors providing real-time, 24×7 channels like Slack or WhatsApp, with engineers able to respond in minutes instead of days. This level of responsiveness minimizes downtime and builds trust with technical teams under pressure.
Logmanager Overview
Known for
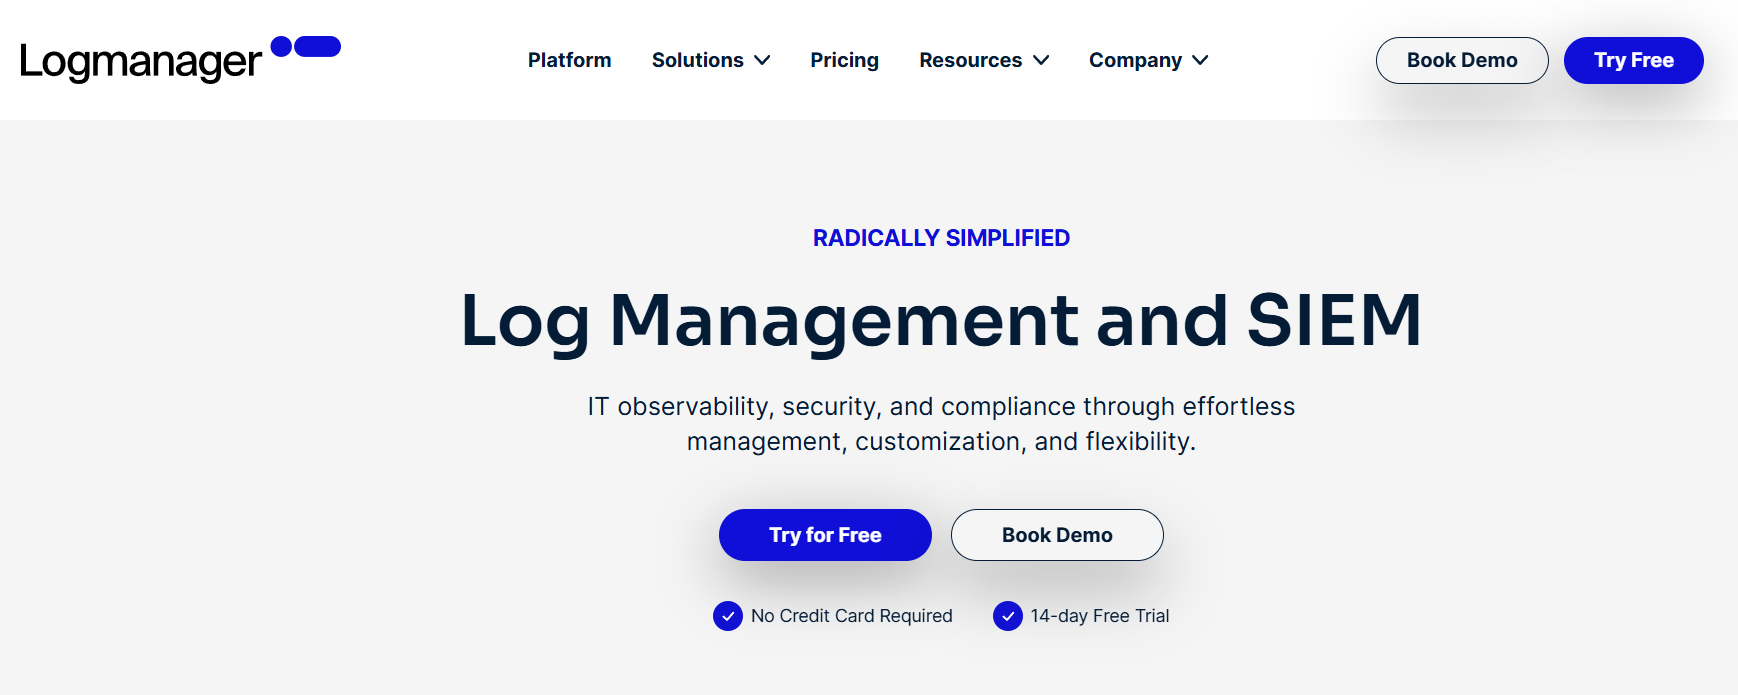
Logmanager is primarily used for centralized log management coupled with compliance and SIEM functionality—especially valuable for teams needing unified visibility into logs, alerting, and audit reporting across diverse IT stacks. It’s often chosen by organizations requiring rapid deployment, regulatory monitoring (e.g., GDPR, ISO 27001, PCI DSS), and a simplified log search and analytics workflow.
Standout Features
- Centralized log collection: Normalized ingestion from servers, applications, and platforms for unified visibility.
- Security-analyzed dashboards: Real-time detection of incidents alongside compliance reporting.
- Prebuilt compliance templates: Dashboards and reports for GDPR, ISO27001, NIS2, Microsoft 365, and Windows logs.
Key Features
- Dashboards & Visualizations: Intuitive panels for logs, metrics, and alerts with real-time insights.
- Alerts & Notifications: Threshold and anomaly alerts with near real-time notifications.
- Reporting & Compliance: Templates and customizable reports for audits and compliance workflows.
- Real-Time Monitoring: Live tail and anomaly detection for proactive operations.
- Indexing & Automated Tagging: Efficient log indexing with context via automated tagging.
- Search & Live Tail: Powerful log search and live streaming tail views for investigations.
Pros
- Cost-effective and excellent value for money
- Prebuilt dashboards deliver immediate insights
- Simple customization for dashboards and parsers
- Rapid deployment and configuration
- Intuitive UI combining basic and advanced features
- Outstanding customer support
- Scalable and reliable performance
Cons
- Customization and setup can be complex
- Not a full-stack observability solution
Best for
Organizations seeking a straightforward, fast-to-deploy log management solution with integrated SIEM and compliance features will find Logmanager ideal. It’s particularly well-suited for teams that need immediate ROI, real-time log visibility, prebuilt compliance frameworks, and strong support, especially in regulated industries or those with on-premise-heavy environments.
Pricing & Customer Reviews
- Pricing: Free; Scale: $0.09/GB/month (500 GB+ storage); Max: Custom (20 TB+ storage)
- G2 rating: 4.7/5 (15 reviews)
- Praised for: cost-effectiveness, ease of deployment, intuitive dashboards, excellent support, and rapid ROI
- Criticized for: Complex customization and setup
Top 7 Logmanager Alternatives
1. CubeAPM
Known for
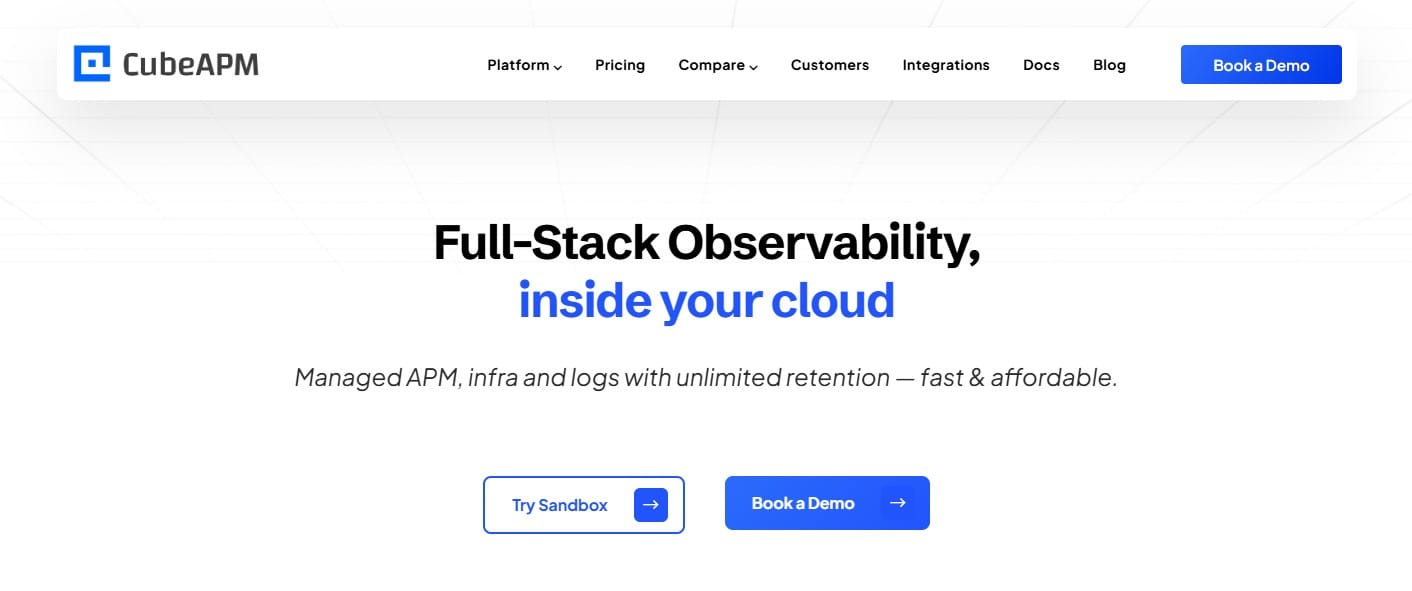
CubeAPM is known for being a full-stack observability and APM platform purpose-built for modern, cloud-native teams. It unifies logs, metrics, traces, RUM, synthetics, and error tracking into a single platform, designed around OpenTelemetry-first ingestion and compliance-friendly deployment options.
Standout Features
- Smart sampling engine: Reduces ingestion volumes by 60–80% by retaining only error-prone and latency-sensitive traces.
- Self-hosting option: Enables full data residency control, keeping sensitive telemetry within the customer’s infrastructure.
- Slack/WhatsApp support: Direct, real-time access to engineers with resolution times measured in minutes instead of days.
Key Features
- Advanced log monitoring: Real-time full-text search at TB scale, high-cardinality filters, and live tailing for rapid investigations.
- Trace-log correlation: Every log line can be tied directly to its trace, drastically reducing root-cause analysis time.
- Agent compatibility: Works seamlessly with Logstash, Fluent Bit, and OTel collectors without needing pipeline rewrites.
- OpenTelemetry-native: CubeAPM is fully compatible with OTel for collecting metrics, logs, and traces.
- Full MELT coverage: Logs, metrics, traces, events, RUM, and synthetic monitoring in one unified interface.
- Prometheus integration: Native support for scraping and ingesting metrics alongside application traces.
- Cost-efficient pricing: Transparent rates without any egress charges.
- 800+ integrations: Works seamlessly with popular DevOps, cloud, and monitoring ecosystems.
- No egress charges: Data stays within your infrastructure or cloud without hidden transfer costs.
- Error tracking module: Monitors exceptions across applications, helping teams resolve recurring issues quickly.
- Unlimited retention: Data stored indefinitely without add-on costs for extended history.
Pros
- Powerful logging with full-text search, trace correlation, and advanced filtering
- Transparent, usage-based pricing with no per-user fees
- Real-time, developer-focused customer support
- Wide integration ecosystem with 800+ supported tools
- No egress fees for retained telemetry data
- Rapid time-to-value with deployments completed in under an hour
Cons
- Observability-focused platform, offering no support for cloud security management features
- May not suit teams looking for a SaaS-only platform
Best for
CubeAPM is best for teams that want cost-effective, OpenTelemetry-native observability with full MELT coverage, advanced log monitoring, strong compliance features, and the option of self-hosting. It suits enterprises with large data volumes looking to cut observability costs, as well as regulated industries where data residency is a critical requirement.
Pricing & Customer Reviews
- Pricing: $0.15/GB ingestion
- G2 Score: 4.7/5 average
- Praised for: advanced logging capabilities, transparent pricing, quick deployment, proactive customer support, compliance-friendly hosting, and wide integration ecosystem
CubeAPM vs Logmanager
Compared to Logmanager, CubeAPM delivers true full-stack observability rather than just centralized log management. While Logmanager is strong in compliance dashboards and SIEM-lite functionality, CubeAPM provides end-to-end monitoring with smart sampling, distributed tracing, RUM, synthetics, and advanced log analytics. Its transparent per-GB pricing, unlimited retention, and no egress charges also eliminate the hidden costs.
2. Datadog
Known for
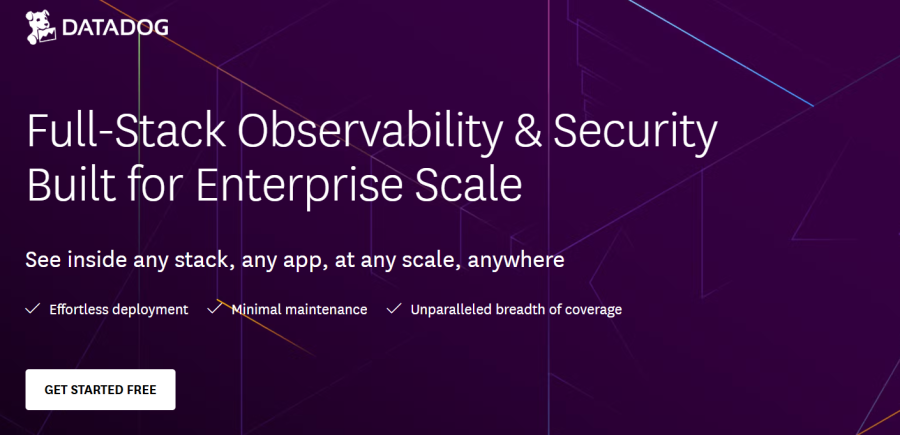
Datadog is a widely adopted, SaaS-based observability and monitoring platform that delivers comprehensive full-stack visibility across infrastructure, applications, logs, security, and more in one unified interface. Its strength lies in seamless integration with diverse cloud environments, DevOps tools, and real-time analytics.
Standout Features
- 900+ integrations: Extensive out-of-the-box compatibility with cloud providers, orchestration platforms, and DevOps tools.
- Unified observability and security: A single-pane platform that blends metrics, logs, traces, real user monitoring, synthetic tests, and security insights.
- AI-powered insights (Watchdog, Bits AI): Leverages machine learning for automated anomaly detection and intelligent alerting.
Key Features
- Infrastructure & container monitoring: Real-time telemetry and dashboards for hosts, containers, serverless workloads, and cloud services.
- Distributed tracing & APM: Deep code-level tracing correlated with logs and metrics for root cause analysis.
- Log management & live tail: Indexed, searchable logs with real-time streaming and dynamic rehydration.
- RUM & Synthetic Monitoring: Frontend performance, session replay, browser/mobile monitoring, and proactive synthetic checks.
Pros
- Broad functionality across observability and security
- Highly scalable, cloud-native architecture
- Prebuilt dashboards, notebooks, and collaborative workflows
Cons
- Pricing is high; may not suit smaller teams
- SaaS-only; no self-hosting
Best for
Enterprises with complex, cloud-native infrastructures that need a turnkey, feature-rich observability and security solution—and can invest in its growth-aligned pricing and feature breadth.
Pricing & Customer Reviews
- Pricing: APM ~$31/host/month; Infrastructure ~$15/host/month; logs billed per GB with extra for retention/indexing
- G2 rating: 4.4/5
- Praised for: holistic platform and integrations
- Criticized for: pricing; no self-hosting
Datadog vs Logmanager
Compared to Logmanager’s SIEM-lite log focus, Datadog offers robust full-stack observability with integrated security, real user metrics, synthetics, and AI-driven analytics. While Logmanager excels in compliance dashboarding and cost predictability, Datadog provides deeper instrumentation and correlation—albeit at a higher cost.
3. New Relic
Known for
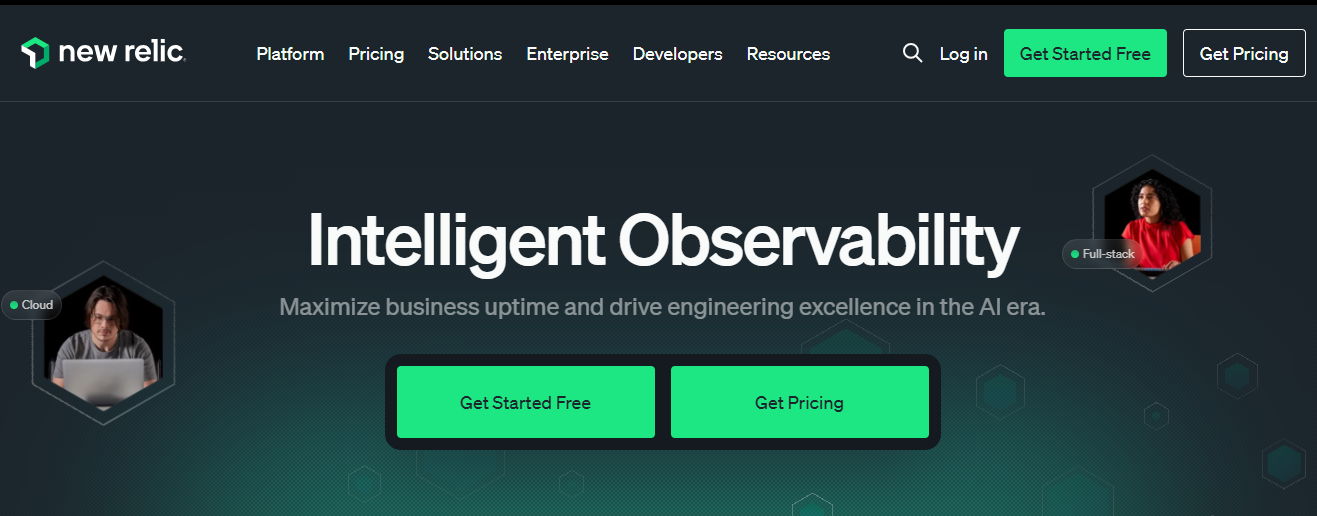
New Relicis known for its AI-powered intelligent observability platform, delivering one of the most extensive, unified experiences available today. It combines 50+ observability capabilities—spanning logs, metrics, traces, synthetic and real-user monitoring, security, and more—into a single, scalable SaaS interface with deep integrations and advanced analytics.
Standout Features
- AI-powered insights and anomaly detection: to automatically surface actionable issues and reduce alert noise.
- 780+ integrations: enabling rapid connectivity with cloud, DevOps, database, and application ecosystems.
- Observability beyond MELT: with added coverage across vulnerability management, change tracking, and intelligent workflows.
Key Features
- Unified data capture: Combines metrics, events, logs, traces, security, RUM, synthetics, and vulnerability data in one platform.
- Customizable dashboards & Alerts: Full flexibility with dashboards, notification workflows, and automated change tracking.
- OpenTelemetry support: Enables ingestion from OTLP pipelines for vendor-neutral instrumentation.
- AI/AIOps tooling: Built-in Watchdog-style anomaly detection, predictive insights, and auto-remediation workflows.
- Scalable SaaS model: Unlimited scale with usage-based billing and a generous free tier.
Pros
- Comprehensive observability across the modern stack with strong AI insights
- Massive integration ecosystem (780+) for quick adoption and unified context
- Scalable, SaaS-native platform with a consistent user experience
Cons
- Complex and multi-dimensional pricing (data, users, add-ons)
- SaaS-only; no self-hosting
Best for
New Relic is best for large, cloud-native enterprises seeking a scalable, all-in-one observability platform with AI-powered insight across their entire stack and rich integrations—who can accommodate multi-layered pricing and are looking for deep operational and business context in one place.
Pricing & Customer Reviews
- Pricing: 100 GB free tier, Paid: $49–$349/mo depending on the tier
- G2 rating: 4.4/5
- Praised for: many features, AI capability, and generous features in the free tier
- Criticized for: pricing, no self-hosting
New Relic vs Logmanager
While Logmanager focuses narrowly on centralized log management and compliance dashboards, New Relic provides truly unified observability across every telemetry type—enhanced by AI insights and broad integrations, but at a higher pricing.
4. Dynatrace
Known for
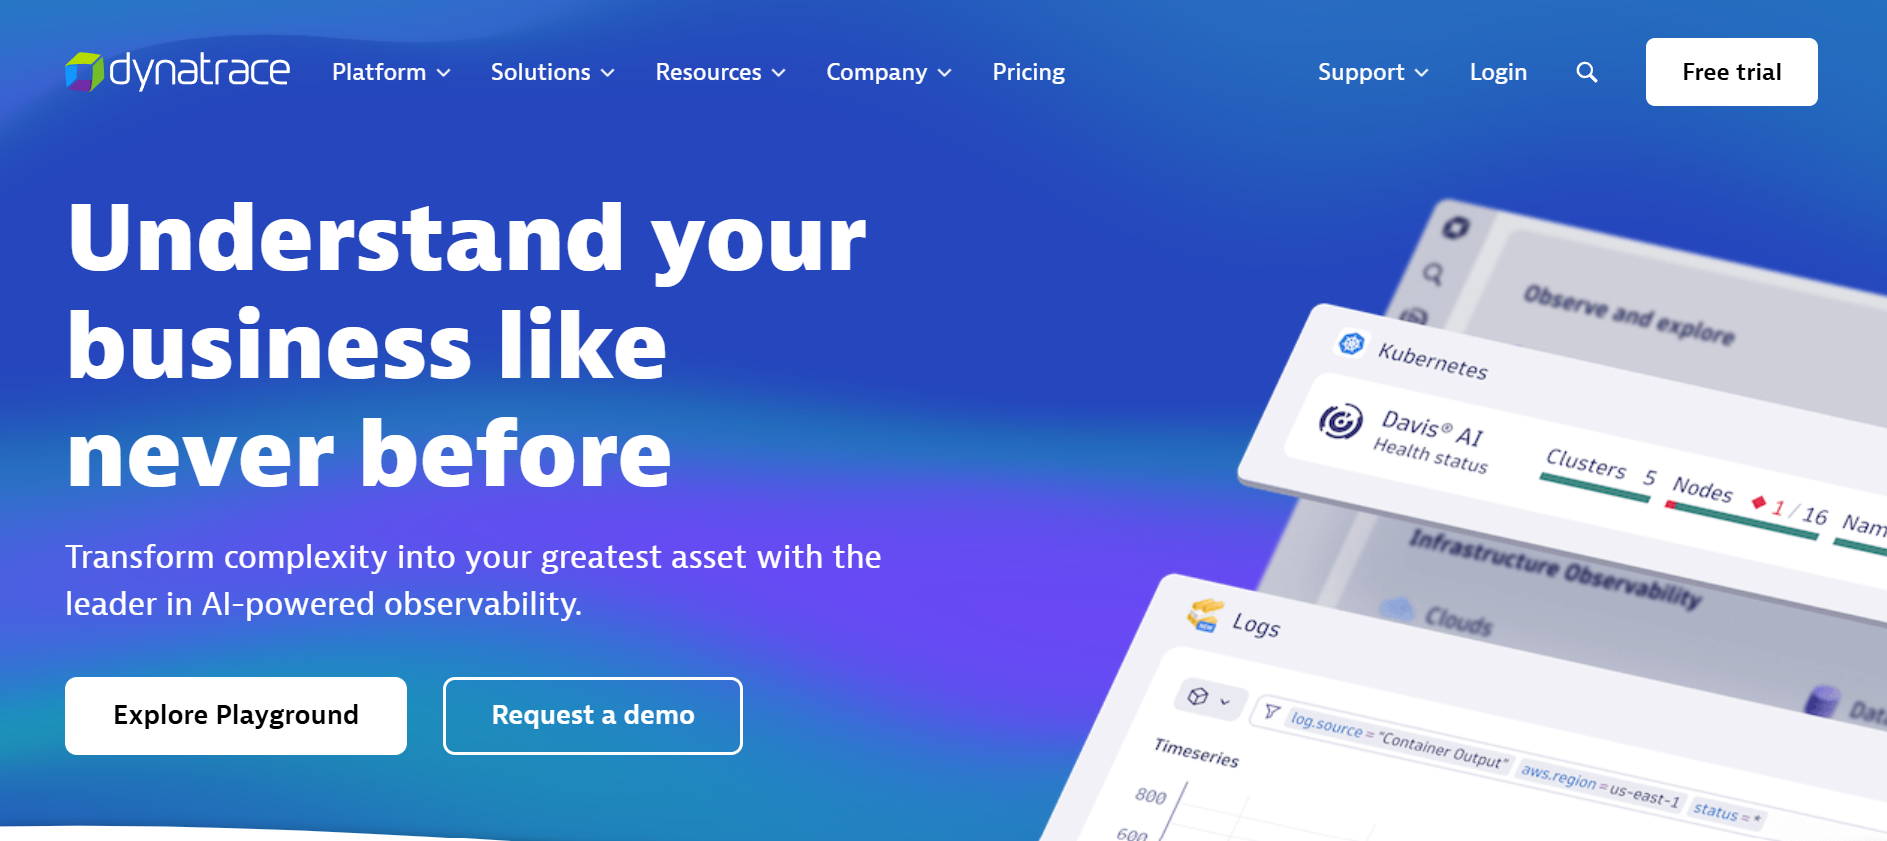
Dynatrace is renowned for its AI-driven unified observability platform, offering deep, end-to-end visibility across applications, infrastructure, and user experience. Its standout features—like automatic discovery (OneAgent), contextual dependency mapping (Smartscape), and the AI-powered Davis engine—make it a top-tier solution for complex, distributed enterprise environments.
Standout Features
- OneAgent auto-instrumentation: Deploys minimal agents that immediately map dependencies and collect logs, metrics, traces—no manual setup required.
- Davis AI engine: Automates anomaly detection and root-cause analysis using causal-AI, enabling smarter alerting and faster incident resolution.
- Smartscape topology visualization: Provides real-time dependency maps across components and services for accurate impact understanding.
Key Features
- Full-stack observability: Covers applications, microservices, infrastructure, networks, user experience, and security in one platform.
- Real user monitoring (RUM) & Synthetic Testing: Captures actual user journeys and simulates interactions for proactive performance checks.
- Grail data lakehouse & analytics: High-performance, schema-on-read storage with powerful querying and contextual analytics.
- OpenTelemetry support: Enables seamless ingestion from OTLP pipelines for greater flexibility in instrumentation.
- AppEngine & AutomationEngine: Build custom observability apps and automate workflows for DevOps and incident response.
- Application security & compliance: Integrates vulnerability detection and compliance monitoring within the observability stack.
Pros
- Deep enterprise-grade visibility with AI insights
- Automated instrumentation reduces setup time
- Context-rich topology maps improve root-cause resolution
- Scalable platform supporting cloud-native and hybrid deployments
- Integrated security and observability in one product
Cons
- Can be expensive, especially for smaller teams
- Steep learning curve
Best for
Dynatrace is best for large enterprises with complex, hybrid or cloud-native environments that need automated AIOps-driven insight across their entire stack, and are ready to invest for deep visibility, automation, and contextual analysis at scale.
Pricing & Customer Reviews
- Pricing: Usage-based: $0.08/hour per host for full-stack
- G2 rating: 4.5/5
- Praised for: smart visualizations, AI features, automated RCA
- Criticized for: learning curve, high cost
Dynatrace vs Logmanager
Compared to Logmanager’s limited SIEM-like log focus, Dynatrace offers comprehensive, AI-powered observability across every telemetry layer, along with security and automation. Logmanager gives more emphasis to compliance while being a simple platform, but Dynatrace prioritizes deep context into infrastructure and predictive analytics with a more advanced platform.
5. Splunk AppDynamics
Known for
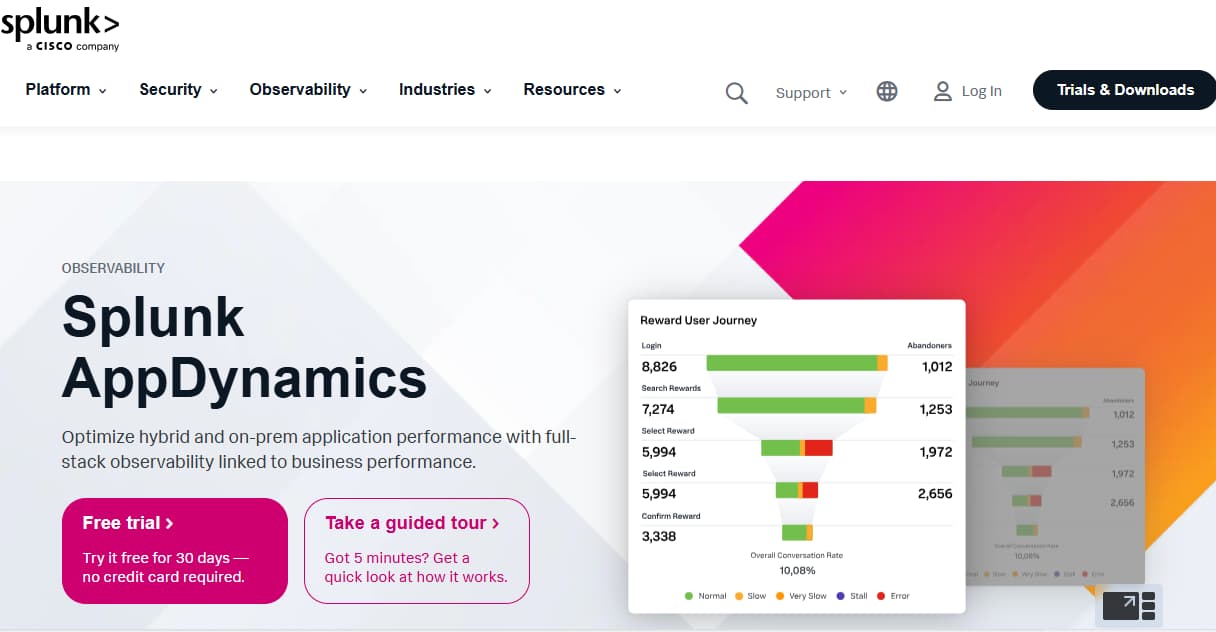
Splunk AppDynamics is renowned for delivering full-stack observability tightly coupled with business performance insights, especially across hybrid and on-premise environments. It excels at correlating application performance with real-time business metrics, enabling teams to prioritize issues based on their impact on conversion, revenue, or service-level objectives.
Standout Features
- AI-powered root-cause analysis: Automatically detects anomalies and pinpoints the underlying issue using machine learning.
- Insights into Business performance: You can see how app or transaction data affects your main KPIs, such as business revenue, conversions, etc.
- Unified observability within the Splunk ecosystem: Seamlessly integrates AppDynamics with Splunk log analytics to maintain context across tools—no tool switching required.
Key Features
- Business transaction monitoring: Tracks critical workflows (like checkouts or logins) and correlates them with business outcomes.
- App security monitoring: The tool can detect vulnerabilities in your app along with runtime security threats, and prioritizes issue fixation based on their risks to your business.
- Digital Experience Monitoring (DEM): Includes RUM, session replay, and synthetic monitoring for web and mobile.
- Hybrid infrastructure visibility: Offers deep monitoring even in SAP, legacy, or multi-tier architectures.
Pros
- Strong business-context observability with AIOps
- Real-time visibility into both modern and legacy enterprises
- Unified Splunk integration that maintains telemetry context
Cons
- Slow update cycle
- Alert inefficiencies
Best for
Splunk AppDynamics is best for large, enterprise teams managing complex hybrid environments who need business-aware monitoring, contextual log integration, and powerful AI-driven troubleshooting, and already rely on or plan to adopt Splunk’s observability ecosystem.
Pricing & Customer Reviews
- Pricing: Infrastructure edition starts at ~$6/vCPU/month; Premium at ~$33/vCPU/month; Enterprise around ~$50/vCPU/month
- G2 rating: 4.3/5
- Praised for: deep business analytics, hybrid stack support, unified Splunk observability
- Criticized for: alert issues
Splunk AppDynamics vs Logmanager
While Logmanager specializes in SIEM-style log dashboards and compliance monitoring, Splunk AppDynamics provides deep, business-aligned observability with APM, security, DEM, and tight Splunk log correlation—making it ideal for organizations seeking richer context and AI-driven insights.
6. Elastic Observability
Known for
Elastic Observability is known for delivering AI-driven, full-stack observability built atop Elastic’s Search AI Platform, enabling organizations to unify logs, metrics, traces, infrastructure, RUM, and synthetic monitoring within a highly scalable architecture. It stands out for its powerful search capabilities, AI assistance, and seamless ingestion across formats—with a consistent focus on real-time analytics and long-term storage efficiency.
Standout Features
- OpenTelemetry-native ingestion: Built-in OTLP pipeline support enables vendor-neutral observability from the start.
- Search AI Lake and tiered storage: Allows petabyte-scale data retention with cost-efficient tiered storage and searchable snapshots.
- AI Assistant & AIOps: Automated root-cause insights and anomaly detection powered by AI and LLM-enhanced analysis.
Key Features
- Log analytics at scale: Instantly search and visualize petabytes of logs via Discover, custom dashboards, and ES|QL ad hoc queries.
- Unified telemetry ingestion: Bring in logs, metrics, traces, RUM, infrastructure, and synthetics in one platform.
- 400+ integrations: Out-of-the-box connections to cloud, container, messaging, databases, and monitoring systems.
- Zero-config anomaly detection: Automatically surface patterns, correlations, and issues without manual setup.
- Digital experience monitoring: The tool offers RUM, synthetic and uptime monitoring, so you can understand user experience and fix issues.
- LLM-powered assistance: Natural-language queries and AI insights via Elastic’s AI assistant to investigate issues faster.
Pros
- Massive scalability with efficient AI-driven search and analytics
- True OpenTelemetry compatibility and vendor-neutral instrumentation
- Flexible and cost-effective retention via tiered storage and searchable archives
Cons
- Complex to set up, especially self-managed
- Costly premium support (5-15% of billing)
Best for
Elastic Observability is best for organizations seeking highly scalable, AI-enhanced observability that can manage massive data volumes while offering deep analytics and flexible, vendor-neutral ingestion—especially when long-term retention, searchable archives, and real-time correlation are priorities.
Pricing & Customer Reviews
- Pricing: Cloud-hosted: $99-184/month; serverless: $0.09/GB; self-managed: Custom
- G2 rating: 4.2/5
- Praised for: search performance and AI-based insights
- Criticized for: complexity of setup and cost
Elastic Observability vs Logmanager
Compared to Logmanager’s log aggregation and compliance emphasis, Elastic Observability offers end-to-end, AI-powered telemetry correlation with efficient, long-term search capabilities. While Logmanager is favored for simplicity and quick value in log-heavy environments, Elastic provides deeper visibility, smarter search, broader signal collection, and data retention flexibility.
7. Graylog

Known for
Graylog is known for being a highly scalable open-source log management and security analytics platform, popular for both on-premise and cloud-based deployments. It excels in log aggregation, real-time search, compliance reporting, and incident investigation, often used as a cost-effective alternative to traditional SIEM tools.
Standout Features
- Illuminate Content Packs: Curated parsing rules, dashboards, and detection logic that simplify onboarding and analysis.
- Enterprise-ready data management: Includes tiered storage (hot, warm, archive), searchable snapshots, and data lake routing for cost-efficient retention.
- Access control & audit logging: Role-based access, audit trails, and compliance reports built into the core platform.
Key Features
- Streams & Pipelines: Flexible log routing, tagging, enrichment, and transformation before storage.
- Custom Dashboards & Search: Intuitive UI for building visualizations, queries, and real-time log exploration.
- Alerts & Notifications: Configurable event definitions, correlation, and real-time alerting workflows.
- UEBA & Threat Detection (Enterprise/Security): Includes user behaviour analytics, risk scoring, and MITRE ATT&CK mappings.
- SOAR & Investigations (Enterprise/Security): Built-in case management, evidence timelines, and automated report generation.
- Flexible deployment models: Available as open-source (Graylog Open), self-managed Enterprise, or fully managed Graylog Cloud.
Pros
- Open-source flexibility with robust log processing
- Rich compliance and security features in higher tiers
- Cost-predictable pricing: pay for what you analyze, not just ingest
- Scalable platform with tier-based data storage
- Flexible deployment options, including SaaS and self-hosted
Cons
- Not a full-stack platform
- Setup and optimization can be difficult
Best for
Graylog is best for DevOps, security, and compliance teams seeking a powerful, open-source log management and SIEM platform that scales affordably using tiered storage, supports structured investigations, and offers deployment flexibility ranging from on-prem to cloud.
Pricing & Customer Reviews
- Pricing: starts at $15,000 per year
- G2 rating: 4.4/5
- Praised for: pricing transparency, tiered storage, alerting
- Criticized for: complexity in deploying and configuring advanced features
Graylog vs Logmanager
Unlike Logmanager’s SIEM-lite, appliance-based offering, Graylog provides greater deployment flexibility (open-source, cloud, or enterprise SaaS) and granular control over storage, analytics, and investigation workflows. While Logmanager focuses on simplicity and rapid compliance dashboards, Graylog’s strength lies in customizable log enrichment, multi-tier retention, and deeper security capabilities, making it better suited for teams with complex log and compliance needs.
Conclusion
Logmanager is a solid log management and SIEM-lite tool, but it has certain limitations, such as being difficult to set up and learn, rollover-based retention, lack of full-stack observability.
CubeAPM stands out as the best Logmanager alternative with full MELT coverage (metrics, events, logs, traces), OpenTelemetry-native ingestion, smart sampling, unlimited retention, no egress charges, and 800+ integrations. It delivers cost-effective, end-to-end observability with a self-hosting option and Slack/WhatsApp support.
Book a free demo today for deeper visibility.
Disclaimer: The information in this article reflects the latest details available at the time of publication and may change as technologies and products evolve.
FAQs
1. Why should I consider Logmanager alternatives?
Logmanager is effective for centralized log collection and compliance dashboards, but has limitations, such as a learning curve, setup complexity, and not being a full-stack monitoring suite.
2. What is the best alternative to Logmanager?
CubeAPM is the best Logmanager alternative because it offers full-stack observability (logs, metrics, traces, RUM, synthetics), smart sampling, unlimited retention, no egress costs, and over 800 integrations. It also provides self-hosting for compliance needs and transparent pricing at $0.15/GB, making it cost-efficient compared to legacy platforms.
3. How does CubeAPM compare to Logmanager on pricing?
Logmanager charges by log sources and forwarders, with rollover costs. In contrast, CubeAPM uses clear per-GB pricing ($0.15.GB) with no per-user fees or retention charges.
4. Which other tools are strong Logmanager alternatives?
Aside from CubeAPM, popular alternatives include Datadog, New Relic, Dynatrace, Splunk AppDynamics, Elastic Observability, and Graylog. These platforms offer broader observability, AI-driven insights, and scalable cloud options.
5. What deployment options does Logmanager support?
Logmanager can be deployed as a virtual appliance (VMware, Hyper-V, Proxmox) or as a hardware appliance, with quick setup and integration.


