Logit.io offers full MELT observability using managed open-source tools such as OpenSearch/ELK for logs, Prometheus for metrics, Grafana for dashboards, and Jaeger for tracing, removing the need to self-host these stacks. Its main limitation is the operational overhead that comes from managing and correlating multiple underlying backends, which can add complexity as environments scale.
CubeAPM is a strong alternative to Logit.io, delivering truly unified MELT observability—logs, metrics, traces, RUM, and synthetics—on a single backend with OpenTelemetry-native ingestion, smart sampling, and predictable usage-based pricing, eliminating the operational complexity of managing multiple observability backends.
In this article, we’ll explore the top 8 Logit.io alternatives—comparing features, pricing, support, and use cases. Whether you’re looking for better OpenTelemetry support, lower costs, or faster support, this guide will help you find the right fit.
Top 8 Logit.io Alternatives
- CubeAPM
- Elastic Observability
- Dynatrace
- Datadog
- New Relic
- Splunk AppDynamics
- Sumo Logic
- Better Stack
Why Look for Logit.io Alternatives?
Despite its strengths in cost-effective, open-source observability, many teams are moving away from Logit.io due to growing concerns around feature limitations, usability, deployment flexibility, and support. Here are the top five issues commonly cited in observability tool discussions on platforms like Reddit, G2, and SourceForge:
1. Steep Learning Curve and Sparse Documentation
Leveraging open-source tools like OpenSearch and OpenTelemetry, Logit.io poses a steep learning curve for teams without ELK Stack expertise. Users report challenges with tasks like custom Logstash filter setup, worsened by documentation lacking depth for advanced use cases. Frustration with setup complexity forces engineers to lean on support or external resources.
2. Complex Tool Stack & Operational Overhead
Logit.io is built on multiple hosted open-source components (OpenSearch/ELK, Prometheus, Grafana, Jaeger), which can introduce operational complexity when correlating and managing those disparate systems at scale, especially for teams without deep ELK/Prometheus expertise.
Criteria for Suggesting Logit.io Alternatives
To recommend viable Logit.io alternatives, we evaluated tools based on the following criteria, ensuring alignment with diverse organizational needs and addressing Logit.io’s key limitations:
1. Native OTEL Support
Alternatives must provide native OpenTelemetry (OTel) support to ensure standardized, vendor-neutral collection of telemetry data (metrics, logs, traces). Native OTel integration enables seamless instrumentation, avoids proprietary lock-in, and supports modern cloud-native environments like Kubernetes. Unlike Logit.io, which integrates OTel but may require additional configuration for advanced use cases, top alternatives should offer out-of-the-box OTel compatibility for streamlined setup and future-proof observability.
2. Full MELT Stack Coverage (Metrics, Events, Logs, Traces)
An alternative should offer deep observability across the stack—not just infrastructure monitoring. This includes logs with search, traces with latency insights, infrastructure metrics, and event-driven alerting.
3. Smart Sampling & Cost Optimization
Tools like CubeAPM use intelligent tail-based sampling to retain rare and anomalous traces while reducing noise and cost. In contrast, legacy tools like SolarWinds and Datadog often rely on probabilistic sampling that either floods storage or misses critical data.
4. Comprehensive Feature Coverage
Alternatives should deliver robust APM, log management, metrics, and tracing, with added support for synthetic monitoring and real user monitoring (RUM) to address Logit.io’s gaps. Integration with popular observability stacks (e.g., Prometheus, Grafana) and advanced features like AI-driven analytics are critical for holistic monitoring and proactive issue resolution.
5. Support and Ease of Use
Robust support channels (e.g., live chat, dedicated account managers) and intuitive interfaces are vital for quick onboarding and issue resolution. Logit.io’s steep learning curve and inconsistent support for lower-tier plans highlight the need for alternatives with user-friendly setups and responsive, accessible support, even for smaller teams.
Logit.io Overview
Known For
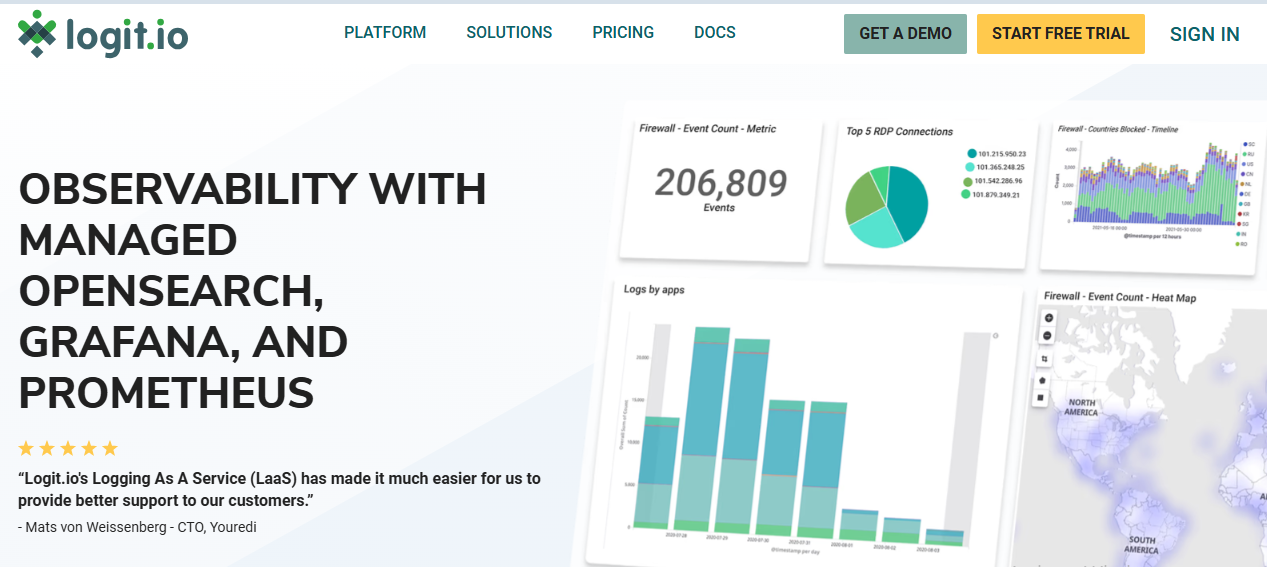
Logit.io is recognized for providing a fully managed, open-source observability platform that integrates logging, metrics, traces, and security monitoring. It leverages technologies like OpenSearch (formerly ELK), Prometheus, Grafana, and Jaeger to offer scalable and compliant observability solutions.
Standout Features
- Open-Source Stack: Utilizes industry-standard open-source tools, ensuring flexibility and avoiding vendor lock-in.
- Full-Stack Observability: Offers comprehensive monitoring across logs, metrics, and traces, providing a unified view of system health.
- Security & Compliance: Adheres to ISO 27001, HIPAA, PCI, and GDPR standards, ensuring data security and privacy.
- OpenTelemetry Integration: Supports native integration with OpenTelemetry, facilitating seamless data collection and analysis.
Key Features
- Managed OpenSearch (ELK Stack): Centralizes and analyzes logs from various sources, enabling real-time insights and troubleshooting.
- Metrics Monitoring with Prometheus & Grafana: Monitors system performance metrics, providing visualizations and alerts for proactive issue resolution.
- Application Performance Monitoring (APM): Diagnoses and optimizes application performance, identifying bottlenecks and improving user experience.
- Security Information and Event Management (SIEM): Monitors and analyzes security events, aiding in compliance and threat detection.
- OpenTelemetry Support: Facilitates the collection and analysis of telemetry data, enhancing observability across services.
Pros
- Cost-effective, offers competitive pricing,
- Accommodates growing data needs without compromising performance or reliability.
- Provides an intuitive dashboard for easy navigation and monitoring.
- Receives positive feedback for responsive and helpful customer service.
Cons
- Operational complexity when correlating and managing those disparate systems at scale
- Learning curve and setup Challenges
Best For
- Small to Medium Enterprises (SMEs): Organizations seeking a cost-effective and scalable observability solution.
- DevOps Teams: Teams requiring comprehensive monitoring across logs, metrics, and traces.
- Security-Conscious Organizations: Businesses needing to adhere to strict compliance and security standards.Logit.io
Pricing & Customer Reviews
- Logs: starts at $9/month for development and $160 per month for business
- Metrics: starts at $5/month for development and $120/month for business
- APM starts at $4/month for development and $80/month for business
- G2 Rating: 3.5/5(G2)
Top 8 Logit.io Alternatives
1. CubeAPM

Known For
CubeAPM is a full-stack, OpenTelemetry-native Application Performance Management (APM) platform designed to provide cost-efficient, compliance-ready hosting with fast ingestion speeds. It’s perfect for DevOps and Site Reliability Engineering (SRE) teams who need reliable observability without breaking the bank or sacrificing control.
Standout Features
- Smart Sampling Engine: Unlike legacy tools, CubeAPM uses Smart Sampling to intelligently filter and retain only the most critical traces, reducing volume by up to 70% and lowering storage and compute costs.
- Full MELT Support: Native support for Metrics, Events, Logs, and Traces, alongside Real User Monitoring (RUM), synthetics, and error tracking—all on one unified platform.
- 1-Hour Setup & Agent Compatibility: Drop-in agent compatibility with Datadog, Prometheus, OpenTelemetry, and New Relic, making migration seamless with pre-built dashboards and auto-instrumentation.
Key Features
- Full MELT Support: Native integration of Metrics, Events, Logs, and Traces, alongside RUM and synthetics.
- Smart Sampling: Intelligent trace filtering that reduces noise and optimizes cost.
- Compliance-Ready Hosting: Ensures local data processing for compliance with international regulations.
- Seamless Migration: Works out-of-the-box with agents from Datadog, New Relic, and OpenTelemetry, easing setup.
Pros
- Full-stack observability with OpenTelemetry-native ingestion.
- Huge integration ecosystem, with 800+ integrations
- Transparent, flat-rate pricing. Zero cloud egress costs
- 2-4x faster ingestion performance.
- Ideal for data localization and compliance-driven environments.
- Supports popular platforms like AWS, Kubernetes, and Redis.
Cons
- Not suitable for teams looking for off-prem solutions.
- Strictly an observability platform; it doesn’t handle cloud security management.
Best For
- Engineering teams seeking cost-effective control over telemetry data.
- Startups and mid-sized teams scaling fast while managing budgets.
Pricing & Customer Reviews
- Pricing: $0.15/GB flat ingestion rate, with zero cloud egress costs
- Rating: 4.7/5 (based on pilot programs, Slack feedback, and demos).
- Praised for: Developer-friendly UX, transparent pricing, and powerful trace sampling.
- Criticized for: Minimum security features.
CubeAPM vs Logit.io
CubeAPM is an OpenTelemetry-native observability platform that unifies logs, metrics, and traces in a single backend with smart sampling and flexible deployment options, including self-hosted setups for greater data control. Logit.io, by comparison, delivers full MELT observability through managed open-source tools like OpenSearch/ELK, Prometheus, Grafana, and Jaeger, which can introduce additional operational overhead when managing and correlating multiple backends at scale.
2. Elastic Observability
Known For
Elastic Observability is known for its robust log analytics and centralized monitoring capabilities, built on the popular ELK Stack (Elasticsearch, Logstash, Kibana). It excels in environments dealing with large volumes of machine data—especially logs and metrics—across distributed systems. Elastic Observability offers in-depth insights into telemetry data, with advanced querying and visualization features.
Standout Features
- Sampling: Elastic Observability uses tail-based sampling with ingest filters (e.g., trace duration, error status), optimizing storage by keeping only high-value traces.
- Kibana Dashboards: Leverages Kibana to provide powerful, customizable visualizations for logs, metrics, and traces, making monitoring complex systems easier.
- Elasticsearch Query Language (KQL): KQL allows for complex, full-text search and filtering across large datasets, enabling fast analysis of massive telemetry volumes.
- Elastic Common Schema (ECS): ECS normalizes data from multiple sources, streamlining the analysis of diverse telemetry data in a standardized format.
- Index Lifecycle Management (ILM): Manages data retention by tiering data into hot, warm, or cold phases based on its importance and age, helping optimize storage costs.
Key Features
- Centralized Log Management: Efficiently ingests, indexes, and queries logs from various sources.
- Metrics Monitoring: Monitors time-series metrics from infrastructure, services, and containers.
- Elastic APM: Offers distributed tracing with service maps and latency breakdowns for backend services.
- Uptime Monitoring: Provides basic synthetic checks to monitor service availability.
- Basic RUM Support: Includes JavaScript agents for browser monitoring, but with limited depth compared to other tools.
- Alerting and Anomaly Detection: Offers threshold-based and machine-learning-driven alerting for metrics and logs.
Pros
- Highly scalable, capable of handling massive volumes of logs and metrics.
- Built on open-source ELK stack components, which are widely adopted and flexible.
- Powerful search and query capabilities that allow quick analysis even on large datasets.
- Kibana provides customizable dashboards and visual tools for deeper monitoring insights.
Cons
- Steep learning curve requiring extensive training and expertise
- Users find the complex configuration burdensome
- Users find a lack of log integration frustrating, as it hinders comprehensive application monitoring
Best For
- Large enterprises with significant Elasticsearch expertise or those prioritizing log analytics over full-stack observability.
- Teams already invested in the Elastic ecosystem, capable of dedicating engineers to manage and tune the platform.
- Organizations looking for powerful log analytics and querying capabilities rather than a comprehensive observability solution.
Pricing & Customer Reviews
- Standard: $99/month
- Gold: $114/month
- Platinum: $131/month
- Enterprise: $184/month
- Rating: 4.2/5 on G2.
- Praised for: Strong logging and analytics, customizable dashboards, and a rich query engine.
- Criticized for: Complexity of use, high costs, and steep learning curve.
Elastic Observability vs Logit.io
Elastic Observability provides a unified observability platform built on the Elastic Stack, combining logs, metrics, and traces with powerful search and analytics. Logit.io offers full MELT observability using managed open-source tools such as OpenSearch/ELK, Prometheus, Grafana, and Jaeger, prioritizing managed infrastructure but requiring coordination across multiple backends.
3. Dynatrace
Known For
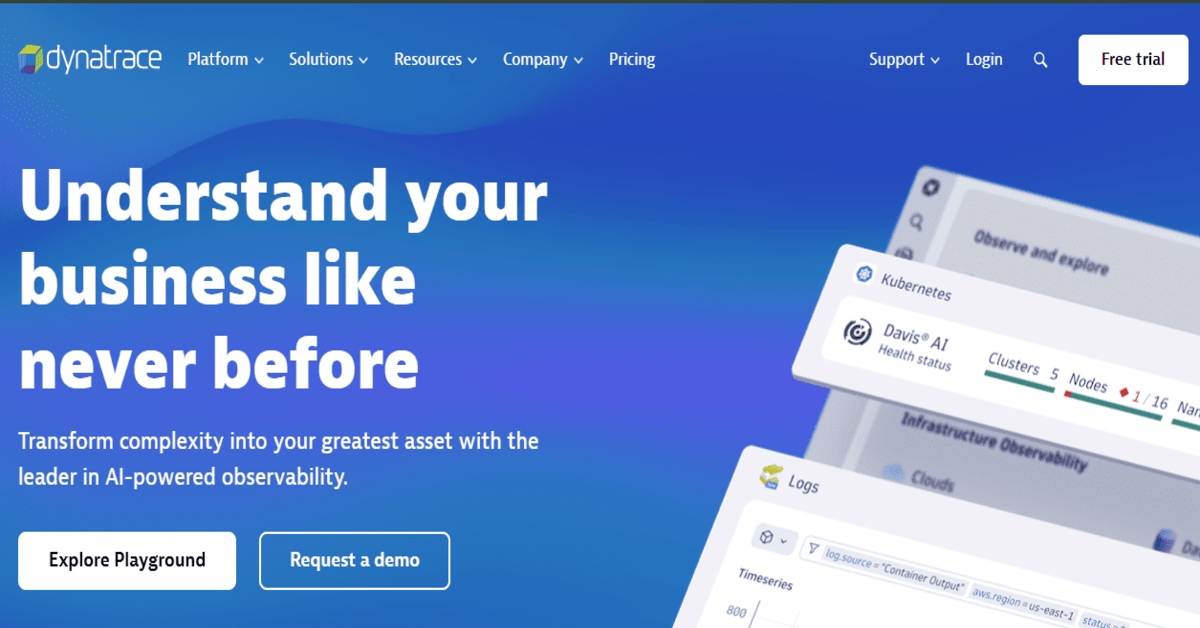
Dynatrace is an AI-powered enterprise observability platform with robust infrastructure monitoring, real-time analytics, and application security. Known for its full-stack automation and its Davis AI engine, Dynatrace excels in environments with complex microservices and cloud-native workloads.
Standout Features
- Davis AI Engine: Detects anomalies, reduces alert fatigue, and auto-discovers root causes across dynamic environments.
- OneAgent Deployment: Auto-discovers services and dependencies across containers, hosts, and serverless environments.
- Security + Observability: Combines observability with runtime application protection (RASP) and vulnerability analytics.
- Cloud Automation: Intelligent integrations with AWS, Azure, and Kubernetes for workload placement and auto-scaling recommendations.
Key Features
- AI-Driven Root Cause Analysis: Automated root cause detection powered by the Davis AI engine.
- OneAgent Deployment: Simplifies deployment across a variety of infrastructures.
- Comprehensive Observability: Provides visibility across infrastructure, applications, and security.
- Cloud Automation: Seamless integrations for efficient cloud management.
Pros
- Enterprise-grade scalability and resilience.
- No sampling; captures 100% of transactions.
- Strong AI-backed analytics and auto-baselining.
- Complete visibility across infrastructure, applications, users, and cloud.
Cons
- Expensive with complex pricing models.
- Steep learning curve for new users.
- The complex initial setup is burdensome
Best For
- Large enterprises with high observability maturity.
- Teams managing massive multi-cloud microservices.
- Enterprises seeking a combined observability and security platform.
Pricing & Customer Reviews
- Infrastructure Monitoring: $29 / mo per host
- Full-Stack Monitoring: $58 / mo per 8 GiB host
- Rating: 4.5/5 on G2.
- Praised for: Automation, AI capabilities, and end-to-end visibility.
- Criticized for: High cost and complexity.
Dynatrace vs Logit.io
Dynatrace is an enterprise observability platform that provides deep application and infrastructure visibility with automated dependency mapping and root-cause analysis on a unified platform. Logit.io, in comparison, offers full MELT observability through managed open-source tools such as OpenSearch/ELK, Prometheus, Grafana, and Jaeger, which can introduce additional operational effort when managing and correlating multiple backends.
4. Datadog
Known For
Datadog is a leading cloud-native observability platform known for its robust monitoring and analytics capabilities. It provides comprehensive coverage across metrics, logs, traces, and synthetic monitoring, making it a popular choice for DevOps and IT teams managing large-scale infrastructures and microservices.
Standout Features
- Unified Observability: Datadog integrates logs, metrics, traces, and synthetics, offering end-to-end visibility into infrastructure, applications, and user experiences.
- AI-Driven Insights: Uses machine learning to automatically detect anomalies, forecast trends, and correlate data across various sources.
- Synthetic Monitoring: Offers synthetic tests to monitor application performance, ensuring uptime and availability from the user’s perspective.
- Distributed Tracing: Supports detailed distributed tracing with service maps, latency breakdowns, and detailed diagnostics for microservices architectures.
- Integration Ecosystem: Datadog integrates with thousands of technologies, making it highly adaptable to various environments.
Key Features
- Full-Stack Monitoring: Combines infrastructure, application, and network monitoring with real-time logs and traces.
- Synthetic Monitoring: Offers automated browser-based tests to simulate real user behavior and monitor performance.
- Real-Time Dashboards: Interactive dashboards that offer real-time data visualizations for metrics, logs, and traces.
- Cloud Security: Includes capabilities for monitoring cloud security configurations and vulnerabilities, providing full observability across cloud-native environments.
- AI-Powered Alerts: Uses machine learning to reduce alert fatigue by detecting anomalies and providing actionable insights.
Pros
- End-to-End Observability: Comprehensive monitoring across infrastructure, applications, logs, and user experiences.
- Strong Integrations: Works seamlessly with over 450 technologies and services, including AWS, Azure, Kubernetes, and Docker.
- Automatic Instrumentation: Offers native and auto-instrumentation support for popular programming languages (e.g., Java, Node.js, Python).
- Powerful Dashboards: Customizable, interactive dashboards that provide deep insights into system performance.
- Security Features: Includes cloud security monitoring and integrations for vulnerability scanning and configuration management.
Cons
- Expensive at Scale. Pricing is usage-based, which can result in high costs for large teams or high data volumes.
- Learning Curve. The platform is feature-rich, and it can take time to understand and set up effectively.
- Complex Pricing. Datadog’s pricing model is complex and can become unpredictable as data volumes grow.
Best For
- Large enterprises or organizations with complex, distributed systems and a need for comprehensive observability.
- DevOps and SRE teams that need high-end monitoring, anomaly detection, and performance troubleshooting at scale.
- Security-conscious organizations requiring integrated security and observability features.
Pricing & Customer Reviews
- APM (Pro Plan): $35/host/month
- Infra (Pro Plan): $15/host/month
- Ingested Logs: $0.10 per ingested or scanned GB per month
- Rating: 4.5/5 on G2.
- Praised for: Easy setup, comprehensive coverage, wide integrations, and advanced AI-driven insights.
- Criticized for: High costs at scale, complex pricing, and limited flexibility for smaller teams.
Datadog vs Logit.io
Datadog is a unified SaaS observability platform that integrates logs, metrics, traces, real-user monitoring, and security signals with advanced analytics, correlation, and alerting across distributed systems. Logit.io, by contrast, delivers full MELT observability using managed open-source tools like OpenSearch/ELK, Prometheus, Grafana, and Jaeger, which reduces infrastructure setup but can require more effort to tie together and operate multiple backends.
5. New Relic
Known For
New Relic is a full-stack observability platform with an all-in-one approach to telemetry collection, analysis, and visualization. It is well known for its unified UI, instrumentation libraries, and usage-based pricing model, which offers great visibility but can become costly at scale.
Standout Features
- Unified Telemetry Platform: Integrates metrics, events, logs, and traces into a single platform called New Relic One, simplifying observability for users.
- Auto Instrumentation: Provides native agents and auto-instrumentation support for popular languages (Java, Node.js, Python, Ruby), making setup easy.
- Distributed Tracing & Service Maps: Offers detailed distributed tracing and visual service maps to help debug latency and dependency issues.
- Head-Based Sampling: Uses predefined sampling rates (e.g., 1%, 5%) but may miss important traces if not manually adjusted.
Key Features
- All-in-One Telemetry Platform: Combines metrics, logs, events, and traces in one unified UI.
- Real-Time Dashboards & Alerts: Provides real-time monitoring, error tracking, and diagnostics at the code level.
- AI-Powered Anomaly Detection: Detects anomalies in system performance with the help of AI assistance.
- OpenTelemetry Support: Offers limited OTEL integration but requires extra configuration.
Pros
- Easy onboarding with pre-built integrations.
- Comprehensive visibility from backend to frontend.
- Strong documentation and a robust support ecosystem.
- Excellent real-time error tracking and monitoring capabilities.
Cons
- Expensive, especially at scale, due to its usage-based pricing model.
- Users find the initial setup complex, requiring significant knowledge to configure.
- Steep learning curve requiring significant training.
Best For
- Mid-to-large teams requiring fast setup and full-stack visibility.
- Companies with multi-language microservices and SRE workflows.
- Teams that are comfortable with SaaS-only solutions and don’t need on-prem hosting.
Pricing & Customer Reviews
- Free tier: 100GB/month ingested.
- Pro Plan: $0.40/GB ingested beyond the 100GB/month free limit.
- Pro Plan: $349/month for a full platform user.
- Rating: 4.4/5 on G2.
- Praised for: Out-of-the-box user experience, wide language support, powerful UI.
- Criticized for: Pricing complexity, sampling limitations, and limited data control.
New Relic vs Logit.io
New Relic is a comprehensive observability platform that unifies logs, metrics, traces, and real-user monitoring with powerful analytics and built-in insights across applications and infrastructure. Logit.io, by contrast, offers full MELT observability through managed open-source tools like OpenSearch/ELK, Prometheus, Grafana, and Jaeger, simplifying infrastructure maintenance but requiring more effort to tie together and operate multiple separate backends.
6. Splunk AppDynamics
Known For
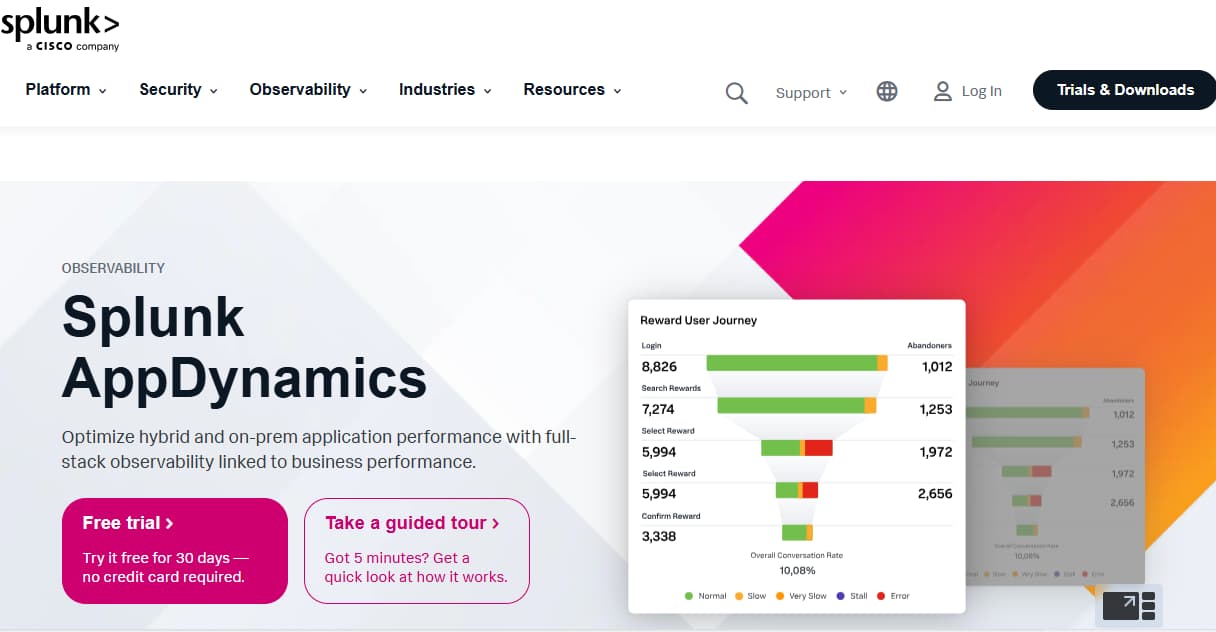
Splunk AppDynamics, originally developed by AppDynamics and later acquired by Cisco, is an APM platform designed for large enterprises. It is well-known for its business transaction monitoring, deep code-level diagnostics, and performance analysis, especially in industries like banking, telecom, and insurance.
Standout Features
- Business Transaction Monitoring: Observability is centered around business transactions, making it easier to align engineering and business teams on service health.
- Code-Level Diagnostics: Provides detailed stack traces, database call visibility, and execution timing, making it ideal for debugging backend performance issues.
- AI-Powered Root Cause Analysis: Uses machine learning to detect performance anomalies and identify root causes.
- Hybrid Deployment Options: Available in SaaS, self-hosted, or hybrid modes, making it ideal for enterprises with strict data residency or air-gapped requirements.
Key Features
- Business Transaction Monitoring: Focuses on transactions that are critical to business processes.
- Code-Level Diagnostics: Provides granular visibility into stack traces and performance down to the line of code.
- AI-Powered Root Cause Detection: Automates the identification of root causes of performance issues across application layers.
- Flexible Deployment Options: Supports SaaS, on-premise, and hybrid deployments for flexibility.
Pros
- Enterprise-ready with strong SLAs and compliance certifications.
- Detailed stack and database visibility.
- Mature ecosystem of integrations and agent coverage.
- Flexible deployment options (on-prem, hybrid, SaaS).
Cons
- Expensive and modular pricing, especially for APM units.
- UI and dashboards feel complex and overwhelming for beginners.
- High data volumes can lead to increased costs.
Best For
- Large enterprises with complex infrastructures or compliance constraints.
- Teams that need detailed business transaction-level monitoring.
- Organizations that prioritize performance diagnostics over full-stack observability.
Pricing & Customer Reviews
- AppDynamics APM: starts at $33/month/CPU core.
- Infra Monitoring: starts at $6/month/CPU core.
- Rating: 4.3/5 on G2.
- Praised for: Deep diagnostics, flexible deployment, business alignment.
- Criticized for: High cost, ageing UI, and complex setup.
Splunk AppDynamics vs Logit.io
Splunk (with AppDynamics) is an enterprise observability and APM suite that provides deep application performance insights, real-time analytics, and powerful search across logs, metrics, and traces with strong anomaly detection and root-cause capabilities. Logit.io, in comparison, delivers full MELT observability using managed open-source tools like OpenSearch/ELK, Prometheus, Grafana, and Jaeger, which simplifies infrastructure hosting but can require more effort to correlate and operate multiple separate backends.
7. Sumo Logic
Known For
Sumo Logic is a cloud-native log management and SIEM platform designed for security-conscious organizations. It integrates log management, metrics, and security analytics, enabling scalable log ingestion and elastic compute without requiring infrastructure management.
Standout Features
- Unified Log and Metrics Platform: Combines logs, metrics, and security analytics into a single platform, offering seamless visibility for DevSecOps teams.
- Cloud-Native Architecture: Fully SaaS-based, with multi-cloud support for AWS, Azure, and GCP.
- Security & Compliance Analytics: Includes compliance templates and threat detection for standards like PCI, HIPAA, and SOC2.
- Flexible Query Language: Uses its proprietary query language (LogReduce) for customizable monitoring.
Key Features
- Unified Log and Metrics Platform: Consolidates logs, metrics, and security analytics into one dashboard.
- Cloud-Native Architecture: Supports high-scale data ingestion with multi-cloud flexibility.
- Security and Compliance: Built-in threat detection and compliance templates.
- Real-Time Dashboards: Provides live query capabilities and customizable monitoring dashboards.
Pros
- No infrastructure management overhead.
- Deep log analytics and flexible querying.
- Strong integration with Kubernetes and AWS.
- Scalable, cloud-native platform with multi-cloud support.
Cons
- High costs at scale due to tiered data plans.
- Proprietary query language adds a learning curve.
Best For
- Enterprises needing combined SIEM and observability in a single solution.
- Teams with log-heavy observability needs.
- Organizations with a cloud-first architecture.
Pricing & Customer Reviews
- Pricing: Estimated at $3.14 per TB scanned.
- Rating: 4.2/5 on G2.
- Praised for: Prebuilt dashboards, log depth, security integrations.
- Criticized for: High cost and steep learning curve.
Sumo Logic vs Logit.io
Sumo Logic is a cloud-native observability and security analytics platform that unifies logs, metrics, traces, and security insights with built-in analytics, machine-assisted pattern detection, and scalable multi-tenant architecture. Logit.io, by comparison, provides full MELT observability through managed open-source tools like OpenSearch/ELK, Prometheus, Grafana, and Jaeger, which reduces infrastructure management but can require more effort to correlate and operate multiple separate backends.
8. Better Stack
Known For
Better Stack is a modern observability platform designed for startups and small teams, with a focus on log management and uptime monitoring. It is known for its clean, intuitive UI and quick setup process, ideal for teams needing essential observability without the complexity of full-stack APM tools.
Standout Features
- Logtail: A powerful log management solution built on ClickHouse, providing fast and storage-efficient log processing.
- Better Uptime: Combines uptime monitoring with incident management and status pages, making it perfect for SRE teams.
- Simplicity and Speed: Easy setup and minimal configuration required for small teams.
- Logs-Only Focus: Currently focuses only on log management, lacking support for tracing or metrics.
Key Features
- Logtail: Centralized log management with SQL-style query capabilities and real-time log tailing.
- Better Uptime: Synthetic monitoring and incident alerts, with status pages.
- Simple Alerts: Integrates with Slack and email for clean, minimalistic alerting workflows.
- SaaS-Only: A fully cloud-based solution with no infrastructure management.
Pros
- Extremely fast setup with minimal complexity.
- Clean, user-friendly interface designed for developers.
- Affordable pricing for small teams and startups.
- Best for uptime and incident visibility.
Cons
- Startups and small teams find the cost expensive.
- Users have raised concerns about missing features, such as outgoing webhooks.
- Steep learning curve requiring training to master it.
Best For
- Startups and small teams needing log aggregation and uptime monitoring.
- Frontend teams and engineers focused on incident response.
- Teams without backend observability complexity.
Pricing & Customer Reviews
- Pricing: Free tier available; Paid plans start at $25/month per user, with production plans at $850/month.
- Rating: 4.8/5 on G2.
- Praised for: UI/UX, ease of use, speed of setup.
- Criticized for: Lack of APM features, OTEL support, and limited scalability.
Better Stack vs Logit.io
Better Stack is an integrated observability platform focused on simplicity and reliability, combining logs, metrics, uptime monitoring, and error tracking in a single SaaS solution with minimal setup and clear alerting. Logit.io, in contrast, delivers full MELT observability by hosting open-source components such as OpenSearch/ELK, Prometheus, Grafana, and Jaeger, which can reduce infrastructure overhead but may require more effort to correlate and manage multiple backends as systems scale.
Conclusion
CubeAPM offers the perfect balance of cost-effectiveness, performance, and full-stack observability with predictable pricing and AI-powered Smart Sampling. While platforms like Datadog and Dynatrace excel in large-scale environments, CubeAPM provides powerful features without the financial strain, making it ideal for small to medium-sized teams. Its ability to combine metrics, logs, traces, and RUM while optimizing storage costs sets it apart as a top choice for modern engineering teams.
Why CubeAPM is the Best
CubeAPM stands out for its cost-effective, AI-powered Smart Sampling, full-stack observability, and predictable flat-rate pricing. It delivers real-time insights with minimal data volume, offering flexibility in deployment and scaling, making it the best solution for teams seeking comprehensive observability without the complexity or high costs of other tools.
Disclaimer: The information in this article reflects the latest details available at the time of publication and may change as technologies and products evolve.
FAQs
1. What are the best alternatives to Logit.io?
If you’re looking for alternatives to Logit.io, consider CubeAPM, which offers a cost-effective, AI-powered Smart Sampling solution with full-stack observability, alongside other alternatives like Datadog and Dynatrace. These platforms also provide comprehensive observability but with varied pricing models and features. CubeAPM stands out for its transparent pricing and powerful trace filtering, making it a great option for teams seeking scalable, affordable observability.
2. Why should I consider alternatives to Logit.io?
While Logit.io offers robust observability features, CubeAPM is a strong alternative due to its cost-efficiency and intelligent sampling capabilities that reduce unnecessary data, offering better storage optimization. Other alternatives include Datadog and LogicMonitor, which cater to enterprises but may come with higher costs and complex pricing models.
3. Are there free alternatives to Logit.io?
Yes, several free alternatives to Logit.io are available. CubeAPM offers a free trial with access to key observability features like Smart Sampling and full-stack monitoring, making it a great option for teams on a budget. Other free options include Grafana and Zabbix, both of which provide basic monitoring features but may require more manual configuration.
4. Which alternative is best for small businesses?
For small businesses, CubeAPM is an excellent alternative to Logit.io due to its predictable pricing and easy setup, making it ideal for smaller teams with limited resources. Other alternatives include Logtail and Zabbix, both of which offer lightweight observability solutions but may require more technical expertise for setup and management. CubeAPM’s transparent pricing makes it easier for startups to monitor their systems without overspending.
5. Which alternative is best for enterprises?
Enterprises seeking an alternative to Logit.io should consider CubeAPM for its robust Smart Sampling and full-stack visibility at a predictable cost. Datadog and Dynatrace are also excellent alternatives for large-scale operations, providing enterprise-grade features such as AI-driven insights and advanced security monitoring. However, CubeAPM offers a more affordable solution with flexible deployment options, making it ideal for businesses that need to scale without the high costs of traditional enterprise observability tools.


