LogicMonitor built its reputation as a robust infrastructure monitoring platform trusted by enterprise IT teams for its broad device coverage, SNMP-driven network visibility, and automated discovery. However, its pricing model — built around tiered packages and hybrid-unit licensing — can become expensive as environments scale.
CubeAPM is the best alternative to LogicMonitor as it offers pricing of $0.15, has a rich integrations ecosystem has great UX. CubeAPM delivers smart sampling for cost efficiency, Slack/WhatsApp support with minute-level TAT, and self-hosting for teams that need full control over data residency and compliance.
In this article, we’ll walk through the top 11 LogicMonitor alternatives of 2025—including CubeAPM, Datadog, and more—evaluating each platform based on capabilities, pricing, telemetry support, and fit for modern DevOps teams.
Top 7 LogicMonitor Alternatives
- CubeAPM
- Better Stack
- Datadog
- New Relic
- Dynatrace
- Honeycomb
- Signoz
- Sumo Logic
Why Look for LogicMonitor Alternatives?
Despite its strong infrastructure monitoring capabilities, LogicMonitor falls short in several key areas that matter to modern engineering teams. Below are the most cited reasons why teams are replacing it with more flexible, OpenTelemetry-centric solutions:
1. Missing or Limited Monitoring Coverage for Certain Technologies
Users highlight gaps in LogicMonitor’s support for specific environments (e.g., Azure Virtual Desktop, niche network devices, or certain application layers). When a monitoring platform lacks native coverage, teams must build custom datasources, scripts, or external probes — adding operational overhead and slowing down incident response. A tool meant to simplify observability becomes harder to manage as the environment grows.
2. Complex and Unintuitive Interface for Dashboards
Users frequently describe the UI as “confusing,” “cluttered,” or difficult to customise. This becomes a real disadvantage because observability tools are used during high-pressure situations — outages, deployments, or SLA breaches. A non-intuitive UI slows engineers down, increases cognitive load, and makes it harder to extract actionable insights quickly.
“The user interface is not particularly intuitive, the new interface has many improvements” (G2)
3. High Enterprise Licensing Fees
LogicMonitor uses a combination of tiered hybrid-unit packages and fixed per-resource pricing. In the per-resource model, infrastructure and cloud VMs start at $22 per resource/month, while Kubernetes and cloud PaaS components cost $3 per resource/month, and wireless access points are billed at $4 per resource/month. Although predictable, this resource-based billing becomes expensive in modern environments where microservices, containers, and dynamic cloud services dramatically increase the number of billable components — making overall costs difficult to control at scale.
4. Steep Learning Curve
LogicMonitor’s interface presents notable usability challenges, particularly for modern DevOps and SRE teams. The platform is known for its steep learning curve, making it difficult for new users to get up and running without formal training or extensive documentation.
Many report that while initial setup is manageable, configuring custom dashboards, data sources, and alerts requires in-depth knowledge of scripting (Groovy/Jython) or APIs.
5. Built-in Integrations Often Require Manual Fixes or Workarounds
Some users note that even LogicMonitor’s native integrations or datasources don’t always “just work” in their environment. Missing metrics, unhelpful default dashboards, or unreliable polling means teams must manually adjust configurations. This undermines the promise of a turnkey observability solution and results in extra engineering effort just to maintain baseline monitoring.
Criteria for Suggesting LogicMonitor Alternatives
When evaluating the best alternatives to LogicMonitor, we focused on platforms that address its key shortcomings—especially in pricing flexibility, cloud-native support, and usability. The tools featured in this comparison were selected based on the following criteria:
1. Smart Sampling and AI-Powered Cost Optimization
To reduce data volumes and ingestion costs, we prioritized tools that support smart or AI-based sampling—where telemetry is selectively retained based on anomalies, latency, or error signals. This dramatically reduces overhead while preserving high-value data, something LogicMonitor lacks.
2. Native OTEL Support
While LogicMonitor supports OTEL through a managed collector, it relies heavily on external pipelines and lacks true native OTEL integration. When evaluating alternatives, we prioritized platforms that are built natively on OpenTelemetry—offering in-platform support for OTEL SDKs, direct ingestion of traces, metrics, and logs, and built-in pipelines for sampling, filtering, and enrichment. Native OTEL platforms reduce operational complexity, ensure better observability fidelity, and align with the open standard ecosystem without vendor lock-in.
3. Flexible Deployment Options
Given that LogicMonitor is SaaS-only, we included alternatives that support self-hosting, bring-your-own-cloud (BYOC), or hybrid deployment models. This is especially critical for teams in regulated industries requiring data residency and compliance control.
4. Transparent, Scalable Pricing
We selected tools that offer predictable, usage-based pricing—either per GB or per host—without complex licensing tiers or hidden add-on fees. Platforms with public pricing, free trials, or clear calculators were favored over those requiring sales contact.
5. Better UX and Faster Onboarding
A major reason teams move away from LogicMonitor is its steep learning curve and rigid UI. We highlighted platforms with intuitive dashboards, easy setup, and lower time-to-value, making them accessible even to smaller teams without dedicated monitoring experts.
6. Real-Time Support Experience
We focused on tools that offer real-time support via Slack, WhatsApp, or live chat, with fast response times and strong community or documentation backing.
LogicMonitor Overview
Known For
LogicMonitor does not provide native OpenTelemetry SDKs or built-in log pipelines. Instead, it relies on the OpenTelemetry Collector—offered as a managed component via their portal—for ingesting logs and telemetry data. Users must manually configure external sources to forward logs into LogicMonitor. Unlike platforms like Datadog or Splunk, LogicMonitor lacks a full-featured log search and analytics UI; logs are parsed and visualized through dashboards and defined templates rather than dynamic queries
Standout Features
- Automated discovery & topology mapping across cloud and on-prem environments
- AIOps-driven alerting with anomaly detection and predictive forecasting
- NetFlow/sFlow traffic analysis for granular network visibility and bandwidth optimization
- Cloud monitoring templates for AWS, Azure, and GCP with pre-built dashboards and alert policies
Key Features
- Agentless monitoring of servers, storage, databases, containers, and cloud services
- Built-in integrations with tools like ServiceNow, Jira, Microsoft Teams, and Slack
- REST APIs, custom data sources, and push metrics for extensibility
- Dynamic thresholding and intelligent alert suppression
- OpenTelemetry Collector support for trace ingestion (recently introduced)
Pros
- Fast implementation with automatic configuration of infrastructure resources
- Wide range of integrations for hybrid infrastructure, including legacy and cloud
- Highly reliable alerting engine and detailed visualizations for network mapping
- Deep integrations ecosystem, and ease of scaling
Cons
- Steep learning curve
- Users find the poor UI of LogicMonitor challenging
- Concerns over missing features, like AVD is time time-consuming and frustrating
Best For
Enterprises, MSPs, and IT teams managing large-scale infrastructure and network devices—especially those focused on uptime, device health, and CMDB-based workflows in hybrid environments.
Pricing & Customer Reviews:
- Essentials: $16 per hybrid unit*
- Advanced: $27 per hybrid unit*
- Signature + Edwin AI: $53 per hybrid unit*
- Rating G2 : 4.5/5
Top 7 LogicMonitor Alternatives
1. CubeAPM
Known For
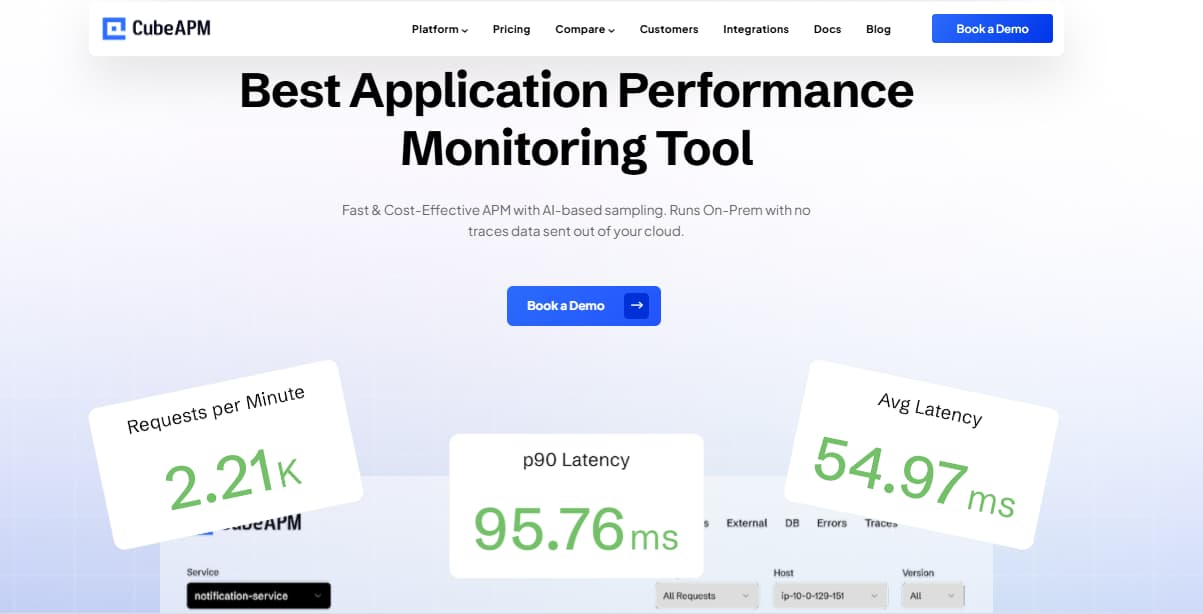
CubeAPM is a modern, OpenTelemetry-native observability platform tailored for engineering teams needing complete MELT (Metrics, Events, Logs, Traces) coverage, data sovereignty, and predictable pricing. Designed for compliance and scalability, CubeAPM avoids the blind spots and billing unpredictability of volume-based SaaS platforms like Better Stack. It supports on-premise deployments, making it ideal for organizations with strict data localization requirements. Unlike Better Stack, CubeAPM provides full-stack observability—including synthetics, RUM, and smart sampling—at a significantly lower cost.
Standout Features
- Smart Sampling Engine: Intelligently samples high-value traces (e.g., errors, high latency, anomalies), reducing data volume by 60–80% while preserving critical insights for root-cause analysis.
- Flexible Hosting for Compliance: Deployable on-premise or in VPCs, ensuring 100% telemetry control for GDPR, HIPAA, India’s DPDP Act, and other regulations. Better Stack’s SaaS-only model routes data through its servers, limiting compliance flexibility.
- Instant Migration & Compatibility: Fully supports Datadog, New Relic, AppDynamics, OpenTelemetry, and Prometheus, enabling migration in under an hour with preserved pipelines, dashboards, and alerts.
- Slack-Native Engineering Support: Direct Slack/WhatsApp support from engineers, reducing response times from hours (as with Better Stack) to minutes, critical for incident resolution.
Key Features
- Unified MELT Observability: Native support for logs, traces, metrics, synthetics, and Real User Monitoring (RUM) in one platform, no add-ons required.
- OpenTelemetry-First: Built for full OTEL compatibility, supporting vendor-neutral instrumentation and flexible pipelines.
- Contextual Smart Sampling: Retains high-value telemetry (errors, latency spikes) while discarding low-value data, cutting ingest by 60–80%.
- Transparent Pricing: Flat-rate at $0.15/GB for ingestion
- Kubernetes-Native Monitoring: Captures container, pod, and cluster metrics, integrated with logs and traces for seamless correlation.
- Optimized Dashboards: Prebuilt, real-time dashboards for databases, services, infrastructure, and APIs with minimal setup.
- Enterprise-Grade Security: Includes RBAC, SSO, MFA, and audit logs for secure, compliant telemetry.
Pros
- 60–80% cheaper than Datadog, New Relic, and Better Stack.
- Drop-in migration for OpenTelemetry, Datadog, or Prometheus users.
- Includes RUM, synthetics, error tracking, and alerts.
- On-premise/hybrid deployments for compliance needs.
- Real-time Slack support from engineers.
- Intuitive dashboards with a minimal learning curve.
- 800+ integrations
Cons
- Not suited for off-premise-only observability solutions.
- Focused on observability, not cloud security management.
Best For
- Engineering, DevOps, and platform teams at SaaS startups, mid-sized tech firms, and regulated enterprises needing full MELT observability, high sampling precision, self-hosted options, and fast support without vendor lock-in.
Pricing & Customer Reviews
- Ingestion: $0.15/GB
- Customer Sentiment:
- G2 Rating: 4.7/5.
- Praised for: Transparent pricing, fast support, smart sampling, and low-latency dashboards.
CubeAPM vs. LogicMonitor
CubeAPM delivers modern, OpenTelemetry-native MELT observability with simple $0.15/GB ingestion pricing and optional self-hosting — making it far more predictable for cloud-native, microservices, and high-volume environments. LogicMonitor excels at infrastructure and network monitoring, but its hybrid-unit and per-resource pricing become expensive as Kubernetes, PaaS, and dynamic services scale. For teams wanting full-stack visibility without runaway costs, CubeAPM is the more efficient choice.
2. Better Stack

Known For
Better Stack is a developer-centric observability platform that integrates uptime monitoring, log and trace management, infrastructure monitoring, incident management, and status pages into a unified toolkit. It’s particularly favored by small to mid-sized engineering teams and SaaS startups for its quick setup and user-friendly interface.
Standout Features
- eBPF-based OpenTelemetry Tracing & Infrastructure Collection: Automatically instruments applications and infrastructure without code changes.
- Integrated Incident Management with Slack Workflows: Supports on-call scheduling, AI-driven post-mortems, intelligent alert merging, and escalation via Slack, phone, or SMS.
- Uptime Monitoring & Status Pages: Provides 30-second checks, traceroute/MTR diagnostics, cron heartbeats, SSL/domain expiry monitoring, and customizable branded status pages.
- Rich Dashboards & SQL-like Log Queries: Utilizes ClickHouse for rapid, index-backed queries across logs, metrics, and traces.
Key Features
- Unified Telemetry: Combines logs, traces, metrics, and uptime in a single interface.
- Install-Free Tracing: eBPF-powered OTEL collectors eliminate manual instrumentation.
- On-Call & Alerting: Offers unlimited phone/SMS calls, Slack/Teams integration, and AI-based noise suppression for incidents.
- Configurable Uptime Checks: Includes network diagnostics, Playwright-based synthetic tests, and heartbeat monitoring.
Pros
- Intuitive platform for both beginners and experts.
- Generous free tier: 10 monitors, 1 status page, 3 GB logs, 2 billion metrics (30-day retention), and Slack/email alerts.
- Developer-focused with simple setup and collaborative dashboards.
- All-in-one solution eliminates the need for tools like PagerDuty, Statuspage.io, or Pingdom.
- ClickHouse enables fast querying on large datasets.
Cons
- It is expensive, especially for startups and small teams
- Missing features, such as webhooks and app notifications, limit usability
- Complex initial setup for those unfamiliar with observability
Best For
- Fast-paced SaaS startups and mid-sized tech teams seeking comprehensive observability without managing multiple tools.
- Teams leveraging a robust free tier for uptime, logs, metrics, tracing, and incident response.
- Dev-centric workflows prioritizing Slack-based incident management and rapid time-to-value.
Pricing & Customer Reviews
- Free tier available for personal projects
- Logs: $0.15/GB
- Metrics: $7.50, 2TB included
- Errors: $0.000075/exception
- G2 Rating: 4.8/5 (292 reviews).
- Praised for: Ease of use, polished UX, free SMS/phone alerts, and strong uptime/status page support.
- Criticized for: Complex pricing, steep learning curve, and overwhelming UI
Better Stack vs. LogicMonitor
Better Stack focuses on real-time application performance (APM), logging, and error tracking — with a usage-based pricing model optimized for developers and modern SaaS stacks. LogicMonitor, by contrast, emphasizes infrastructure, network, and hybrid-IT monitoring — often relying on per-resource or hybrid-unit licensing, which can get costly in dynamic or containerized environments.
3. Datadog
Known For
Datadog is a cloud-native, all-in-one observability and security platform, widely used by DevOps teams for its robust integrations, real-time monitoring, and support for infrastructure, logs, APM, and security via SaaS.
Standout Features
- Extensive Integrations: Supports 900+ technologies (AWS, Azure, GCP, Kubernetes, Docker, Jenkins, PostgreSQL, Redis, Kafka) for seamless telemetry unification.
- Notebooks & Live Dashboards: Interactive drag-and-drop dashboards and Notebooks for collaborative incident analysis across metrics, logs, and traces.
- Integrated Security Monitoring: Combines observability with DevSecOps, including CSPM, runtime threat detection, audit logs, and SIEM-style alerting.
Key Features
- Full-Stack Observability: Covers MELT, RUM, synthetics, and CI/CD visibility.
- Distributed Tracing: Code-level insights with trace explorer, service maps, and span-level drilldowns.
- Infrastructure Monitoring: Tracks CPU, memory, disk, network, containers, and Kubernetes via topology maps.
- Log Management: “Logging without Limits™” supports full log ingestion with tiered querying and anomaly detection.
- RUM & Synthetics: Monitors user sessions, session replay, and browser/API performance.
- AI-Powered Insights: Watchdog uses ML for anomaly detection and root cause analysis.
- Security Modules: Includes cloud workload security, CSPM, cloud SIEM, and audit trails.
Pros
- Extensive integration ecosystem.
- Unified platform for observability, security, and CI/CD.
- Real-time dashboards and collaborative Notebooks.
- Ideal for complex, multi-cloud, Kubernetes environments.
- Strong enterprise and security features.
Cons
- Complex pricing based on per-host, per-GB
- Steep learning covers impedes onboarding
- Expensive, especially when scaling
- UI can be overwhelming for beginners
Best For
Mid-to-large DevOps teams, cloud-native organizations, and security-conscious firms needing a unified observability and security platform, despite complex pricing and SaaS dependency.
Pricing & Customer Reviews
- APM (Pro Plan): $31/host/month
- Infra Monitoring(Pro Plan): $15/host/month
- Infra Cost: starting at $15/host/month
- G2 Rating: 4.4/5 (600+ reviews).
- Praised for: Integrations, feature breadth, and visualization quality.
- Criticized for: Cost unpredictability, complexity, and high ingestion fees.
Datadog vs. LogicMonitor
Datadog is built for cloud-native and microservices environments, offering deep APM, log analytics, and container visibility with strong integrations for modern developer workflows. LogicMonitor, meanwhile, focuses on infrastructure, network devices, and hybrid IT monitoring through SNMP, agentless discovery, and broad device coverage. In practice, teams with fast-changing cloud workloads tend to prefer Datadog’s application-level depth, while organizations with large on-prem or hybrid infrastructure often find LogicMonitor better suited to their operational needs.
4. New Relic
Known For
New Relic is a flexible, developer-friendly observability platform offering full-stack monitoring, custom dashboards, and rich telemetry exploration via its NRQL query language. It’s popular for real-time analytics, APM, infrastructure visibility, and frontend monitoring in a unified SaaS interface.
Standout Features
- NRQL (New Relic Query Language): SQL-like engine for real-time correlation of metrics, logs, events, and traces, enabling advanced dashboards and anomaly detection.
- Explorer View: Topology-aware UI visualizes dependencies across apps, services, containers, and databases for debugging distributed systems.
- Lookout Anomaly Detection: ML-driven detection of regressions and unusual telemetry behavior, reducing manual alert tuning.
- Customizable Dashboards: Prebuilt widgets and custom visualizations for system health, MTTR, SLOs, and service performance.
Key Features
- Full-MELT Observability: Covers metrics, events, logs, traces, and RUM, with browser session replay and synthetic checks.
- Polyglot Instrumentation: Supports Java, Python, .NET, Node.js, Go, Ruby, PHP for tracing, profiling, and diagnostics.
- Partial OTEL & Prometheus Support: Compatible with OpenTelemetry, though often requires dual agents; supports Prometheus metrics with separate configuration.
- Alerting & Anomaly Thresholds: NRQL-based, static, and Lookout-driven anomaly alerts with multi-condition policies.
- Cloud-Native Integrations: Monitors AWS, GCP, Azure, Kubernetes, Lambda, and containers in hybrid/multi-cloud setups.
Pros
- NRQL enables precise telemetry querying and correlation.
- Explorer topologies and live dashboards provide strong visual feedback.
- Lookout reduces alert noise with ML-driven issue detection.
- Comprehensive APM and observability controls.
- Ideal for query-driven analytics users.
Cons
- Complex, usage-based pricing with ingestion and user fees.
- Steep learning curve for NRQL and alerts.
- Costs can quickly escalate especially when scaling
Best For
Engineering and DevOps teams needing fine-grained observability and advanced querying via NRQL in a SaaS environment, comfortable with a query-centric workflow.
Pricing & Customer Reviews
- Free: 100GB/month ingested
- Data ingested (Pro Plam): $0.40/GB beyond the free 100 GB
- Full Platform User (Pro Plan): $349/user(for monthly pay as you go)(monthly).
- G2 Rating: 4.4/5 (500+ reviews).
- Praised for: NRQL power, custom dashboards, performance monitoring.
- Criticized for: Pricing complexity, overwhelming UI, steep learning curve
New Relic vs. LogicMonitor
New Relic delivers broad MELT coverage—metrics, events, logs, and traces—within a unified UI, with strong support for OpenTelemetry and AI-powered anomaly detection. It appeals to cloud-native teams seeking deep application-level insights. However, its usage-based pricing and per-GB ingest model often lead to unpredictable bills as telemetry scales. LogicMonitor, by contrast, focuses heavily on infrastructure and network monitoring, offering robust SNMP and NetFlow support.
5. Dynatrace
Known For
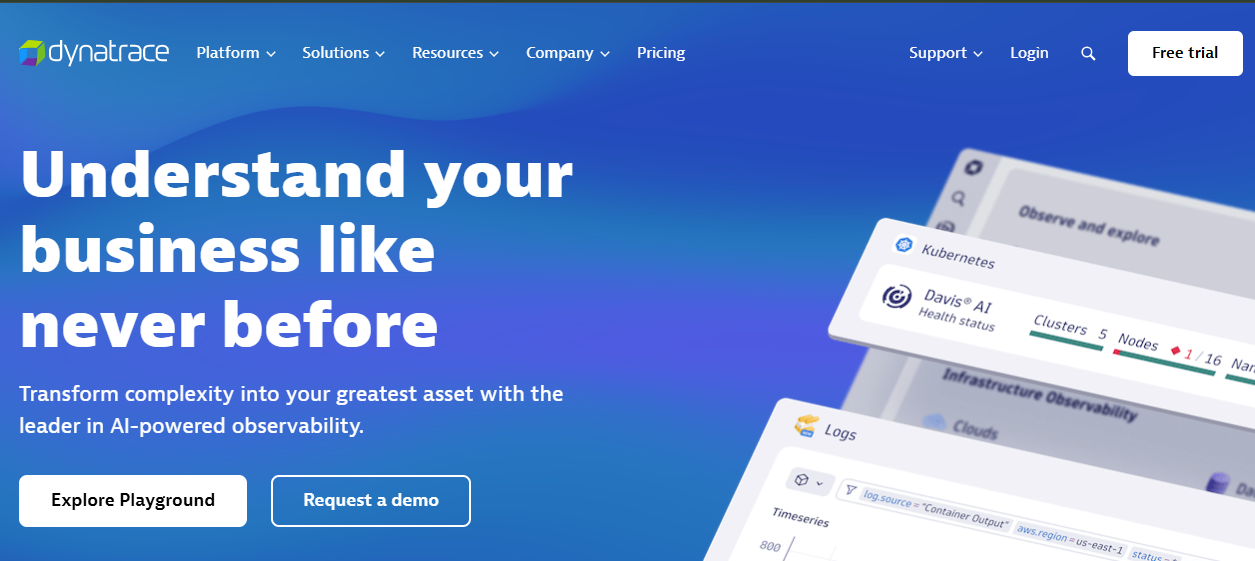
Dynatrace is a premium full-stack observability platform with AI-driven automation, automated dependency mapping, and integrated application security. It’s favored by enterprises managing complex cloud, on-premise, or hybrid systems requiring real-time root cause analysis and infrastructure intelligence.
Standout Features
- Davis AI for Root Cause Automation: Correlates telemetry across infrastructure, apps, and services to pinpoint root causes, using SmartScape topology for automated decisions.
- SmartScape Topology Mapping: Real-time dependency graphs visualize relationships among infrastructure, services, containers, and processes for debugging microservices.
- Runtime Application Protection (RASP): Monitors apps for vulnerabilities and malicious behavior, integrating observability with DevSecOps.
- Digital Experience Monitoring (DEM): Combines RUM and synthetic tests to track end-to-end user experience and correlate frontend/backend performance.
Key Features
- Full MELT Coverage: Includes logs, metrics, events, traces, infrastructure, RUM, and synthetic checks.
- Auto-Instrumentation: OneAgent auto-discovers apps, containers, VMs, and serverless across Java, .NET, PHP, Node.js, Python.
- Code-Level Insights: Transaction traces with method-level granularity.
- AI-Powered Alert Correlation: Davis groups related incidents, reducing alert fatigue.
- Cloud-Native Integration: Deep observability for AWS, Azure, GCP, and Kubernetes.
- Log Analytics: Indexed logs with contextual correlation.
Pros
- Comprehensive observability and security platform.
- Davis AI provides fast, accurate root cause identification.
- SmartScape offers real-time dependency visualization.
- Auto-instrumentation minimizes setup effort.
- Strong monitoring for cloud-native environments.
Cons
- Expensive, becomes particularly challenging for smaller teams
- Steep learning curve for setup and SmartScape tuning
- Data center or on-premise support is limited
Best For
Large enterprises and platform teams managing complex, high-scale cloud/hybrid systems needing AI-driven root cause analysis, topology visibility, and built-in security in a tightly integrated environment.
Pricing & Customer Reviews
- Full-Stack Monitoring: $58 /month/8 GiB host
- Infra Monitoring: $29/month/8 GiB host
- G2 Rating: 4.5/5 (1,300+ reviews).
- Praised for: AI insights, automation, enterprise-grade security.
- Criticized for: Complex pricing, limited OTEL support, and no full on-premise options.
Dynatrace vs. LogicMonitor
Dynatrace is a full-stack observability platform with deep APM, infrastructure, and AI-powered root cause analysis. Its automation-first approach, Grail data lakehouse, and Davis AI engine make it ideal for large enterprises with complex microservices and high telemetry volume. While LogicMonitor provides solid infrastructure and SNMP monitoring. Teams seeking modern, autonomous observability across the MELT stack often find Dynatrace more comprehensive—though also more complex and expensive—than LogicMonitor’s legacy-focused approach.
6. Honeycomb
Known For
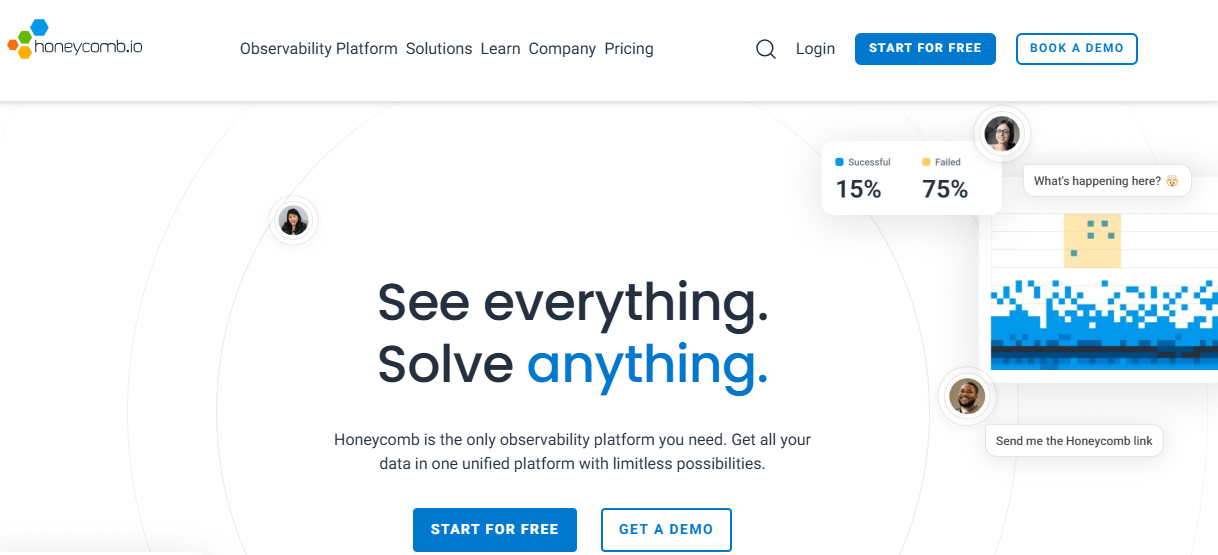
Honeycomb is best known for its high-cardinality trace analysis and interactive debugging capabilities tailored for complex, distributed systems. Designed for engineering teams navigating microservices and dynamic environments, Honeycomb provides powerful query-driven visualizations that help uncover patterns, anomalies, and outliers across millions of trace events—making it a go-to tool for root cause analysis and understanding service-level behavior at scale.
Standout Features
- Native OTEL Support: Honeycomb offers native integration with OpenTelemetry, allowing teams to ingest standardized telemetry data without vendor lock-in. This ensures flexibility and compatibility across diverse environments while enabling easy instrumentation across services.
- BubbleUp Debugger: A powerful visual tool that automatically surfaces anomalies in high-cardinality fields, helping engineers quickly pinpoint the root cause of issues without writing complex queries.
- Columnar Query Engine: Honeycomb’s custom-built columnar engine is optimized for structured, event-based telemetry, enabling high-speed, flexible querying at scale—even in environments with millions of spans.
- Tail-Based Sampling: Supports capturing traces after completion, preserving rare but critical anomalies such as latency outliers. This leads to better signal retention and more accurate debugging, especially in distributed systems.
Key Features
- High-Cardinality Event Support: Handles millions of unique field combinations—ideal for dynamic metadata like user IDs, sessions, or geographic segments.
- Custom Query Builder: Honeycomb uses a SQL-like interface to enable fine-grained slicing/dicing of telemetry data for interactive debugging.
- Service Map & Trace Spans Explorer: Visualizations for service-to-service call flows and deep inspection of individual spans and attributes.
- Frontend SDKs (RUM): Recently added support for Real User Monitoring via JavaScript SDKs, though this requires manual setup and lacks out-of-the-box UX metrics.
- Basic Alerting & SLOs: Provides alerting based on derived columns or thresholds. More suited for debugging than real-time operational monitoring.
Pros
- Excellent for debugging high-cardinality production issues
- Fast query performance even across billions of events
- Ideal for event-driven architectures and async systems
- Integrates well with OpenTelemetry pipelines
Cons
- Costs can escalate with high event volume
- Less emphasis on long-term aggregates / business-metric rollups
- Steep learning curve for teams new to event-based observability
Best For
- DevOps and SRE teams focused on trace-level debugging
- Use cases involving microservices, high-cardinality data, and asynchronous systems
- Organizations that already manage logging/infra separately and want a tracing-first workflow
Pricing & Customer Reviews
- Free Tier: 20 million events/month
- Pro Tier: $130/month per 100 million events
- G2 Rating: 4.7/5
Most users praise its power and speed for debugging. Common complaints include the lack of full-stack support, steep learning curve, and difficulty forecasting costs.
Honeycomb vs. LogicMonitor
Honeycomb specializes in high-cardinality, event-driven observability, giving teams granular insights into distributed systems and microservices. It’s built around OpenTelemetry and emphasizes exploratory debugging with powerful query capabilities and heatmaps. In contrast, LogicMonitor focuses on infrastructure and network visibility but lacks deep trace analytics and fast queries. For teams needing real-time, production-level debugging and flexible telemetry analysis, Honeycomb offers a more modern and developer-friendly alternative.
7. SigNoz
Known For
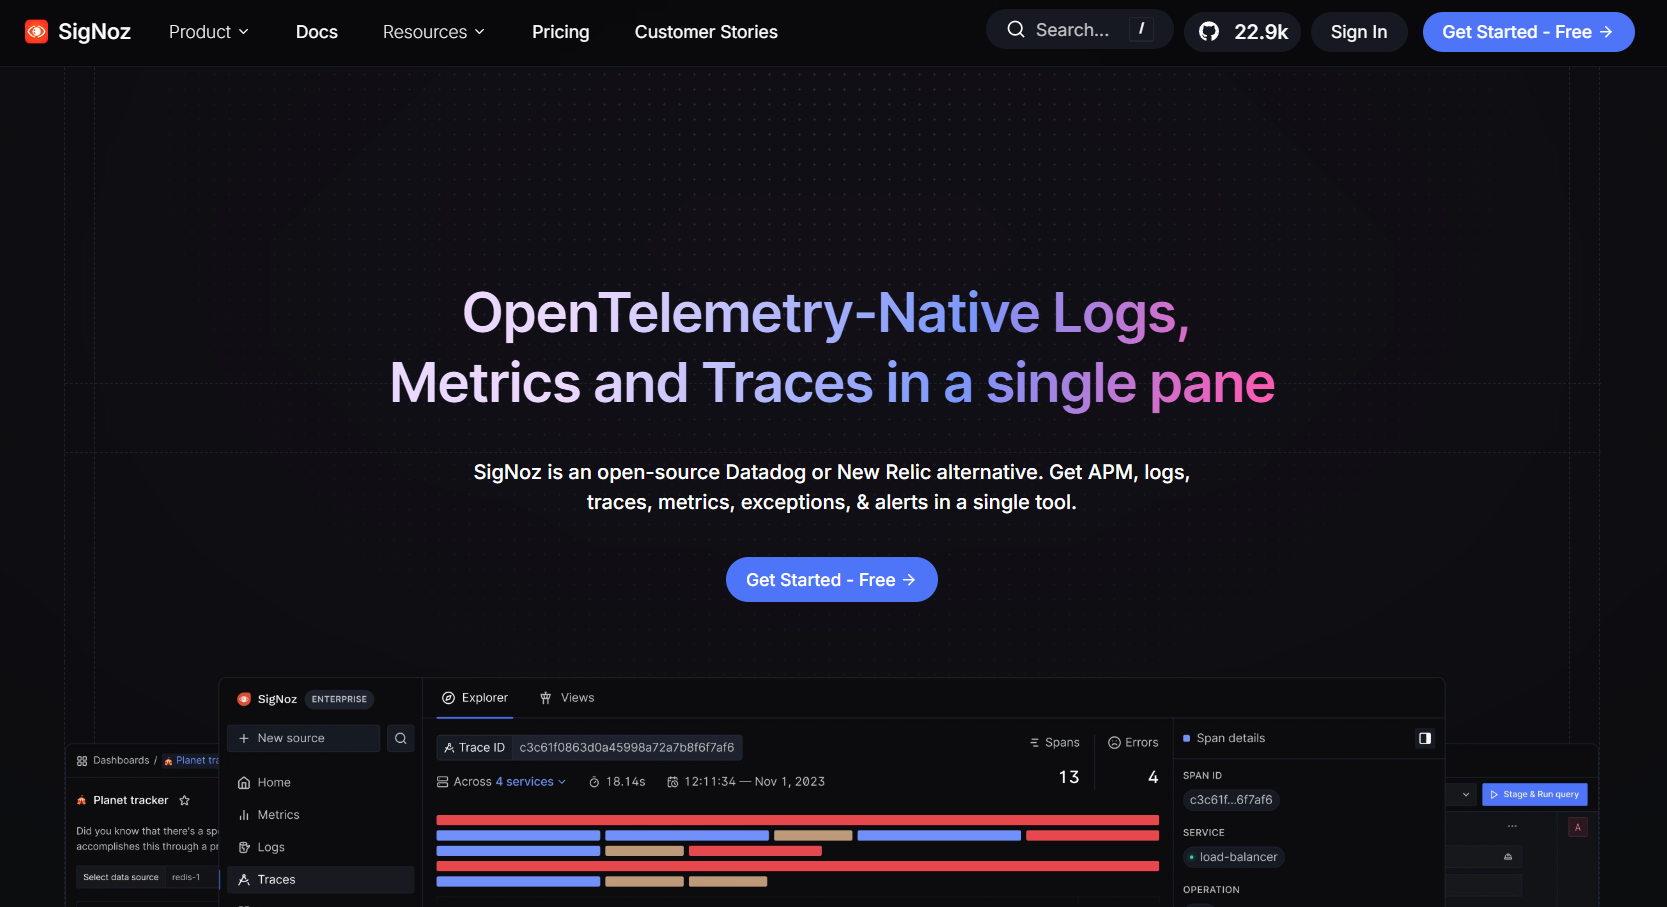
SigNoz is an open-source, full-stack observability platform powered by ClickHouse and Apache Kafka, offering unified logging, tracing, and metrics without vendor lock-in or high SaaS costs. It’s popular among developers seeking cost-effective, self-hosted observability.
Standout Features
- ClickHouse-Powered Analytics: Enables fast querying for logs, metrics, and traces at scale.
- Full OTEL Native: 100% OpenTelemetry support for metrics, logs, and traces, ensuring vendor portability.
- Self-Hosting & On-Prem Options: Deployable via Helm Charts or Docker Compose for full data sovereignty.
- Error & Alerting Support: Latency, error rate, and anomaly-based alerts integrated with dashboards.
Key Features
- Unified UI for Logs & Traces: Interactive correlation of traces and logs for debugging.
- Host & Kubernetes Monitoring: Real-time metrics for CPU, memory, network, pods, and containers.
- Service Maps & Trace Analytics: Visualizes service dependencies for root-cause analysis.
- Prometheus-Compatible: Supports Prometheus metrics alongside OTEL data.
- Alerting with Webhooks: Integrates with Slack, PagerDuty, email, and custom endpoints.
Pros
- No vendor lock-in with self-hostable stack.
- Full MELT observability with strong linkages.
- Cost-effective with ClickHouse for large workloads.
- Rapid onboarding with community support and intuitive UI.
- Transparent, open-standards pipeline.
Cons
- Managing ClickHouse memory usage is time-consuming
- Operational complexity, especially for managing the stacks
- The UI, while functional, might feel cluttered
Best For
Engineering, DevOps, or SRE teams in startups/mid-sized firms seeking scalable, OTEL-native, self-hosted observability with no hidden costs.
Pricing & Customer Reviews
- Pricing:
- Free tier; paid plans start at $49/month.
- Traces: $0.30/GB.
- Logs: $0.30/GB.
- Metrics: $0.10/million samples.
- Customer Sentiment:
- G2 Rating: 4.6/5.
- Praised for: OTEL support, UI clarity, cost-effectiveness.
- Criticized for: operational overhead especially managing ClickHouse backend
SigNoz vs. LogicMonitor
SigNoz is an open-source, OpenTelemetry-native observability tool unifying logs, metrics, traces, and exceptions in a single UI, built on ClickHouse for high-performance querying. While LogicMonitor excels in infrastructure and SNMP-based monitoring. With SigNoz, teams get transparent usage-based pricing (starting at $0.30/GB for logs/traces, $0.10 per million metrics, no host or user fees) and flexible deployment options. For cloud-native teams wanting full MELT observability and control over costs and telemetry, SigNoz is a compelling alternative to LogicMonitor’s legacy, SaaS-only model.
8. Sumo Logic

Known For
Sumo Logic is a cloud-native SIEM and log analytics platform focused on security, compliance, and advanced log monitoring, integrating logs, metrics, and traces for real-time threat detection and operational intelligence.
Standout Features
- Cloud SIEM & Threat Detection: Combines log analytics with security monitoring, anomaly detection, and threat hunting.
- Machine Learning Analytics: Anomaly detection, predictive forecasting, and smart baselines for telemetry signals.
- Pre-Built Compliance Content: Templates and alerts for PCI DSS, HIPAA, GDPR, and other regulations.
Key Features
- Log, Metric & Trace Analytics: Aggregates telemetry with integrations for AWS, Azure, GCP, Kubernetes, and Docker.
- Streaming Analytics Engine: Real-time log/metric processing for pre-storage alerts.
- Interactive Dashboards & Search: Real-time exploration with LogReduce and LogCompare tools.
- SIEM & Security Modules: Security analytics, user tracking, threat intelligence, and compliance alerting.
- Cloud Platform Monitoring: Visibility into containers, serverless, and infrastructure health.
Pros
- Strong log security analysis for compliance-heavy environments.
- Real-time ML-driven detection and alerting.
- SaaS-based scaling with minimal setup complexity.
- Rich compliance-focused dashboards and tools.
- Support via portal, email, and phone.
Cons
- Costly at high ingestion volumes or advanced feature tiers.
- Complex pricing leads to opaque billing.
- Limited sampling; log-indexing focused.
- SaaS/hybrid deployment; moderate setup complexity.
- Limited full-stack telemetry compared to MELT platforms.
Best For
Security-centric, compliance-heavy enterprises needing powerful log analytics, real-time threat detection, and SIEM capabilities.
Pricing & Customer Reviews
- $3.14/TB scanned
- Customer Sentiment:
- Gartner Peer Insights: 4.3/5.
- Praised for: Security analytics, dashboards, compliance support.
- Criticized for: Cost, pricing opacity, limited APM telemetry.
Sumo Logic vs. LogicMonitor
Sumo Logic focuses on cloud-native log analytics, offering fast search, structured queries, and flexible pricing based on ingestion and retention. While LogicMonitor excels at infrastructure and network monitoring. For teams prioritizing log performance, cost control, and scalable analytics, Sumo Logic presents a modern alternative to LogicMonitor’s more traditional, infrastructure-heavy approach.
Conclusion
CubeAPM stands out as a versatile, cost-effective solution, offering full MELT observability, OTEL-native support, smart sampling, transparent pricing ($0.15/GB ingestion, $0.01/GB transfer), and flexible on-premise/hybrid deployments for compliance. With instant migration, real-time Slack support, and advanced features like RUM and synthetics, CubeAPM is ideal for startups, mid-sized firms, and enterprises seeking control, scalability, and cost predictability without sacrificing depth.
For teams prioritizing enterprise-grade AI and security, Dynatrace or Datadog excel but come with complex pricing. New Relic offers powerful analytics via NRQL. CubeAPM strikes the perfect balance for modern, scalable observability needs.
Disclaimer: The information in this article reflects the latest details available at the time of publication and may change as technologies and products evolve.
FAQs
1. What are the best LogicMonitor alternatives for infrastructure and cloud monitoring?
Some of the most popular alternatives to LogicMonitor include CubeAPM, Datadog, and Chronosphere. These tools offer varying levels of infrastructure coverage, log management, and support for modern telemetry standards like OpenTelemetry. CubeAPM stands out for its full MELT support, cost transparency, and smart sampling capabilities.
2. Why are teams switching from LogicMonitor to other observability platforms?
Many teams are moving away from LogicMonitor due to its high per-resource costs, lack of native RUM and synthetic monitoring, and SaaS-only deployment model. Others cite its steep learning curve, dashboard limitations, and slow support response times as key reasons for switching.
3. Is there a more affordable alternative to LogicMonitor for growing teams?
Yes. CubeAPM, for example, offers usage-based pricing starting at $0.15/GB with no per-user or per-resource fees. This makes it significantly more cost-effective compared to LogicMonitor’s resource-based pricing which can be significantly high, especially for teams ingesting large volumes of telemetry.
4. Which LogicMonitor alternatives support OpenTelemetry natively?
Platforms like CubeAPM, Chronosphere, Coralogix, and HyperDX offer native OpenTelemetry support, allowing teams to standardize telemetry across logs, metrics, and traces. While LogicMonitor recently added OTEL Collector compatibility, its OTEL integration is still limited compared to more modern observability platforms.
5. Are there LogicMonitor alternatives that support on-prem deployment?
Yes. Unlike LogicMonitor, which is SaaS-only, tools like CubeAPM and Coralogix offer self-hosted or bring-your-own-cloud (BYOC) options. This is especially important for organizations with strict compliance, data residency, or sovereignty requirements.


