Django monitoring tools are now essential for teams running large-scale web applications for fintech, SaaS, and e-commerce platforms. According to the CNCF Annual Survey 2024, more than 84% of organizations now use observability tooling in production.
The biggest challenge for teams is choosing the right Django monitoring tools that balance cost, scalability, and compliance. Incumbent vendors often charge steep licensing fees and cap retention, while open-source tools may lack enterprise-grade support. Pricing unpredictability and poor integrations are among the top reasons teams churn from legacy APM platforms.
CubeAPM is the best Django monitoring tool provider, offering full-stack observability with Smart Sampling and self-hosting deployments. For Django workloads, CubeAPM delivers deep tracing of ORM queries, Celery jobs, and API endpoints while retaining logs, metrics, and traces at scale. In this article, we’ll explore the top Django monitoring tools.
Top 9 Django Monitoring Tools
- CubeAPM
- New Relic
- Datadog
- Dynatrace
- Sentry
- SigNoz
- AppSignal
- Atatus
- Middleware
What is a Django Monitoring Tool?
A Django monitoring tool is a specialized Application Performance Monitoring (APM) solution designed to track the health, performance, and reliability of applications built with the Django framework. It provides real-time visibility into how requests move through Django views, middleware, database queries, Celery tasks, and APIs—helping teams identify performance bottlenecks before they impact users.
For modern businesses, Django monitoring is no longer optional; it’s critical for ensuring seamless customer experiences and keeping operational costs under control. By using these tools, organizations can:
- Pinpoint bottlenecks in real time: Trace slow database queries, API latency, or caching issues directly to Django code paths.
- Reduce downtime and revenue loss: Proactive alerting prevents prolonged outages and supports faster mean-time-to-resolution (MTTR).
- Correlate signals across stack: Combine logs, traces, and infrastructure metrics for complete visibility into Kubernetes, cloud, and on-premise environments.
- Ensure compliance and governance: Tools like CubeAPM support GDPR, HIPAA, and India DPDP regulations by offering BYOC and unlimited retention.
- Lower monitoring costs: Smart Sampling and transparent per-GB pricing avoid the runaway bills that come with legacy tools.
In short, Django monitoring tools give engineering, DevOps, and SRE teams the confidence that their applications will scale reliably without surprise costs or hidden blind spots.
Example: Diagnosing Slow Checkout in a Django E-commerce App with CubeAPM
Imagine a Django-based e-commerce platform where customers experience checkout delays during peak sales. Using CubeAPM’s distributed tracing, the engineering team can follow each request across Django views, ORM queries, and Celery background jobs. CubeAPM highlights that a single PostgreSQL query in the orders model is spiking latency, correlating it with CPU throttling in the Kubernetes node.
Within the same dashboard, developers also see correlated error logs, real user monitoring (RUM) data showing session abandonment, and synthetic monitoring tests reproducing the latency from multiple regions. Armed with this context, the team optimizes the query and scales infra pods—reducing checkout latency by 45% while preventing lost revenue.
Why Teams Choose Different Django Monitoring Tools
When it comes to Django, monitoring isn’t a one-size-fits-all decision. Teams often switch or evaluate tools because of practical challenges they encounter at scale. Here are the most common reasons driving those choices:
Cost Predictability
Django workloads generate high-cardinality metrics—think ORM queries with dynamic tenant IDs or Celery tasks with unique tags. On some platforms, these explode monitoring bills without warning. Many SREs on Reddit and G2 reviews note that legacy APMs pile on charges for ingestion, retention, and “extra” features like error tracking, making costs unpredictable at scale.
OpenTelemetry-First Approach
With Django projects often mixing Python APIs, Celery workers, and microservices, lock-in is risky. OpenTelemetry (OTel) has become the de facto standard for Python monitoring, offering automatic instrumentation for Django and flexible manual APIs. Teams now prioritize vendors that accept OTel data natively so they can switch backends or deploy across Kubernetes without rewriting code.
Depth of Django-Specific Traces
Not all tools monitor Django the same way. Teams care about how well an APM breaks down WSGI/ASGI entry spans, middleware latency, ORM query performance, and Celery job timings. Platforms that expose slow template rendering or N+1 query issues directly in traces stand out, while generic tools often miss these Django-specific pain points.
Strong Cross-Signal Correlation
Debugging Django often requires correlating a slow checkout view with PostgreSQL query latency, Gunicorn worker CPU throttling, and error logs from Celery retries. Tools that bring together traces, logs, metrics, RUM, and infra in one place drastically reduce MTTR. Without this, engineers are stuck toggling between multiple dashboards and guesswork..
Multi-Cloud & Kubernetes Readiness
Modern Django deployments frequently run on EKS, AKS, or GKE. Teams need monitoring that auto-discovers Django pods, preserves trace context across rolling updates, and maps dependencies across services. Platforms that require heavy manual setup slow down adoption, while OTel-based or K8s-native options are often preferred for speed and flexibility.
Deployment & Compliance Needs
Fintech, healthcare, and government Django apps must comply with GDPR, HIPAA, or India DPDP. In these cases, businesses want control over where their data resides—whether that means on-prem, BYOC (bring your own cloud), or SaaS with strict regional guarantees. Vendors that support flexible deployment models win out over SaaS-only incumbents.
Ease of Customization for Django Edge Cases
Many Django shops extend their apps with GraphQL APIs, custom middleware, or heavy Celery pipelines. Teams need APIs that let them add custom spans and attributes—like tagging a tenant ID or order size to a transaction trace. Solutions that make this easy are seen as “developer-friendly,” while closed systems frustrate engineers at scale.
Top 8 Django Monitoring Tools
1. CubeAPM
Overview
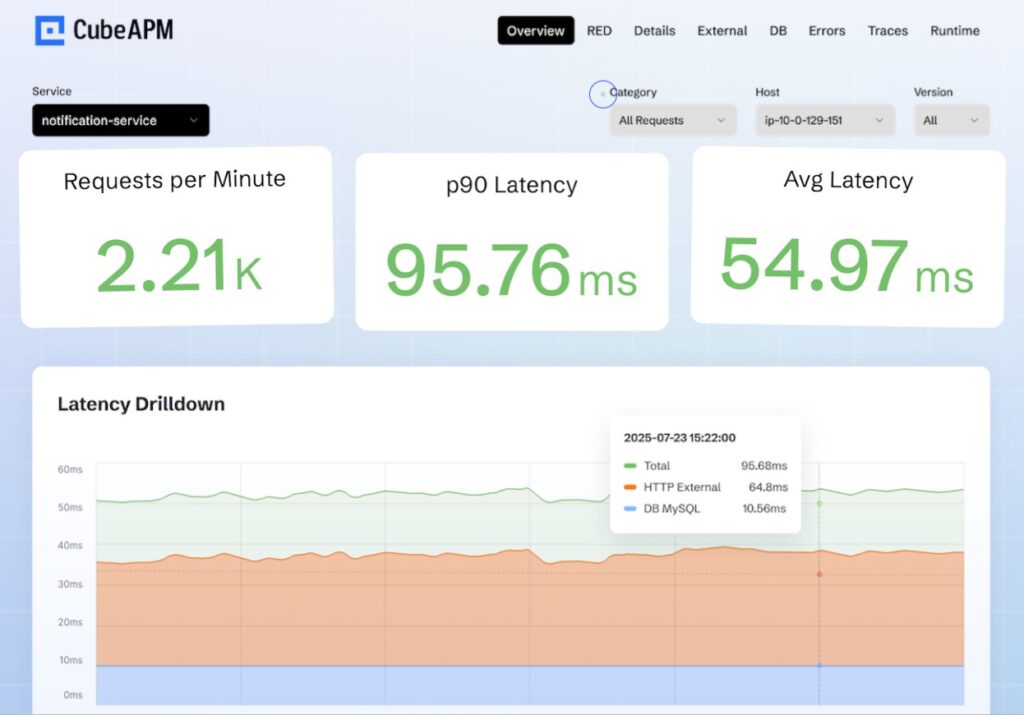
CubeAPM has established itself as a modern observability leader, widely adopted by engineering teams moving away from legacy APM vendors. It’s known for offering deep visibility into Django applications, with a strong market position as the cost-efficient, OpenTelemetry-native alternative to Datadog and New Relic. With 800+ integrations and seamless support for Django frameworks, it provides full-stack coverage across APIs, ORM queries, Celery jobs, and async workflows while ensuring compliance for industries like fintech and healthcare.
Key Advantage
Smart Sampling that preserves critical traces (slow queries, high-latency endpoints, errors) while cutting down on data noise and reducing monitoring spend.
Key Features
- Django APM instrumentation: Captures detailed traces for views, middleware, ORM queries, and Celery tasks.
- Error tracking: Surfaces Django exceptions with stack traces, correlated logs, and contextual metadata.
- Real User Monitoring (RUM): Tracks session-level performance and frontend impact for Django-powered apps.
- Log monitoring: Aggregates Django application logs and correlates them with traces for faster debugging.
- Synthetic monitoring: Simulates user journeys such as login and checkout to validate app performance under load.
Pros
- Transparent and predictable pricing
- Strong compliance readiness with self-hosting
- 800+ integrations for cloud and infra ecosystems
- Quick onboarding with OTel compatibility
Cons
- Not the best choice for teams needing fully managed, off-prem SaaS only
- Focused purely on observability without built-in cloud security features
CubeAPM Pricing at Scale
CubeAPM uses a transparent pricing model of $0.15 per GB ingested. For a mid-sized business generating 45 TB (~45,000 GB) of data per month, the monthly cost would be ~$7,200/month*.
*All pricing comparisons are calculated using standardized Small/Medium/Large team profiles defined in our internal benchmarking sheet, based on fixed log, metrics, trace, and retention assumptions. Actual pricing may vary by usage, region, and plan structure. Please confirm current pricing with each vendor.
Tech Fit
CubeAPM is especially strong for Python and Django, with optimized tracing for ORM, middleware, Celery, and API calls. Beyond Django, it also supports Node.js, Java, Go, Ruby, and modern Kubernetes-based microservices.
2. New Relic
Overview
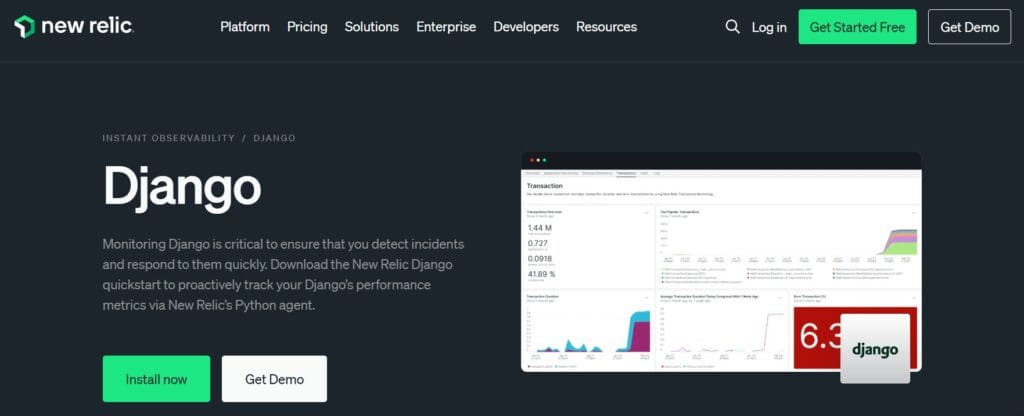
New Relic is a mature, developer-friendly observability platform with a long history of Python support and a dedicated Django quickstart. Its Python agent instruments Django in both WSGI and ASGI modes and can automatically add browser monitoring to HTML responses—giving end-to-end visibility from server spans to real user sessions for common Django stacks.
Key Advantage
Tight Django integration across server and browser: framework-aware Python agent (WSGI/ASGI) plus optional automatic/manual browser instrumentation for full back-to-front correlation.
Key Features
- Django-aware tracing: Captures transactions across WSGI/ASGI with framework-specific naming for views and middleware.
- ORM & runtime visibility: Auto-instrumented Python packages and runtime metrics (CPU, memory, GC) for deeper diagnostics.
- Celery & GraphQL coverage: Extended agent support for Celery tasks and Graphene-Django workloads.
- Browser monitoring for Django: Automatic injection or manual template tags to track real user performance.
- Python agent APIs: Add custom spans and metrics to enrich traces with app-specific context.
Pros
- Mature Python/Django agent with quickstart dashboards and documentation
- Works with Django in both WSGI and ASGI deployments
- Optional automatic browser monitoring for Django templates
- Rich agent APIs for custom spans and metrics when needed
Cons
- Data-ingest pricing can scale quickly for high-volume Django logs and traces
- SaaS-only deployment.
New Relic Pricing at Scale
New Relic’s billing is based on data ingested, user licenses, and optional add-ons. The free tier offers 100 GB of ingest per month, then it costs $0.40 per GB after that. For a business ingesting 45 TB of logs per month, the cost would come around $25,990/month*.
Tech Fit
Strong for Python/Django teams that want a polished agent, ASGI/WSGI flexibility, optional browser monitoring, and ready-made quickstarts—typical stacks include Gunicorn/NGINX, Postgres/Redis, Celery workers, and front-end RUM stitched together in one place.
3. Datadog
Overview
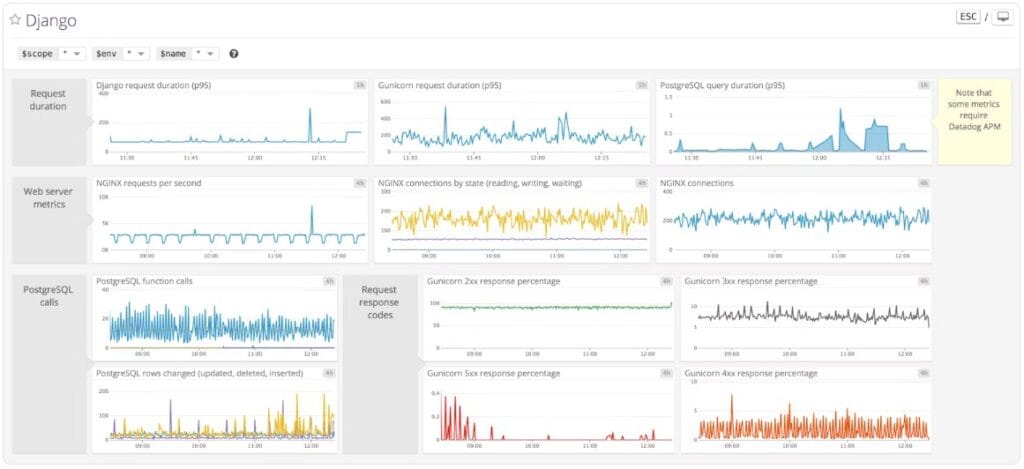
Datadog is a long-standing leader in application observability with deep Python coverage and 900+ turnkey integrations, which makes it a frequent default for teams that want Django tracing, logs, RUM, and infrastructure monitoring in one place. Its Django guide and Python APM resources show first-class support for auto-instrumentation across views, templates, and database queries, along with the ability to correlate everything via TraceID for faster root cause analysis.
Key Advantage
End-to-end correlation for Python and Django—trace a slow Django view, jump into the exact stack frame, and pivot to logs, database metrics, and RUM sessions from a single workspace.
Key Features
- Django auto-instrumentation: ddtrace captures requests, template renders, and database queries with minimal code changes.
- Trace ↔ log correlation: Use TraceID to link Python traces and logs for quicker debugging.
- Service Map & App Analytics: Visualize Django service dependencies and slice traces by endpoints, errors, or customers.
- RUM for Django apps: Measure page performance and Core Web Vitals to see the user impact of backend changes.
- Ecosystem coverage: Built-in integrations for Gunicorn, NGINX, Postgres, caches, and more around the Django stack.
Pros
- Mature Python/Django instrumentation with wide documentation and examples
- Strong cross-signal correlation across APM, logs, RUM, infrastructure, and DB monitoring
- 900+ integrations to bring surrounding services and components into the same view
- Useful developer UX (Service Map, App Analytics, Watchdog) for fast triage
Cons
- Pricing spans multiple meters (APM hosts, log GBs, RUM sessions, synthetics, indexed spans), which can make cost planning harder at scale
- SaaS-only deployment; no self-hosting
Datadog Pricing at Scale
Datadog charges differently for different capabilities. APM starts at $31/month; infra starts at $15/month; logs start at $0.10/GB, and so on. For a mid-sized business ingesting around 45 TB (~45,000 GB) of data per month, the cost would come around $27,475/month*.
Tech Fit
Best for Python/Django teams that also need a broad platform: Kubernetes or VM estates, Postgres/Redis/NGINX around Django, and front-end RUM—all stitched together with 900+ integrations and Django-aware APM.
4. Dynatrace
Overview
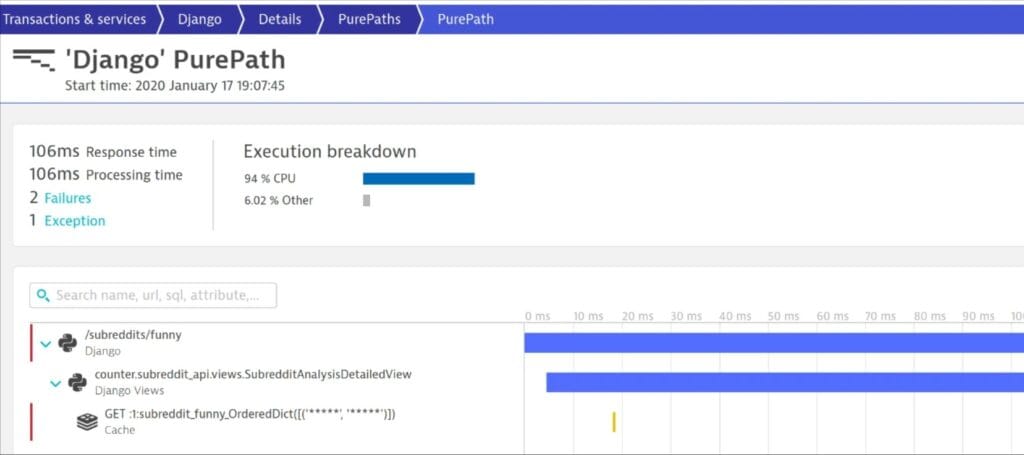
Dynatrace is an enterprise observability platform known for automated end-to-end tracing, dependency mapping, and AI-assisted root cause analysis. For Django specifically, OneAgent plus Python auto-instrumentation captures requests across views and middleware, ORM calls, Celery tasks, and external services, then ties them to Kubernetes and infrastructure context for a single, correlated picture.
Key Advantage
Davis AI with service flow and PurePath traces that pinpoint Django bottlenecks—whether in views, queries, caches, or external calls—and surface probable root causes with minimal manual effort.
Key Features
- Python/Django auto-instrumentation: Captures WSGI/ASGI requests, views, middleware, DB queries, and Celery spans with OneAgent and the Python SDK.
- Service flow & PurePaths: Visualizes request paths across Django, databases, caches, and downstream services to instantly spot the slow hop.
- Database call tracing: Correlates ORM queries and external calls with latency and errors to eliminate N+1s and slow transactions.
- Kubernetes awareness: Links Django traces to pods, nodes, and rollouts, so performance issues are seen in the cluster context.
- Davis-driven problem detection: Automated baselining, anomaly detection, and SLOs to catch regressions before they impact users.
Pros
- Deep end-to-end tracing with powerful dependency mapping
- Strong Kubernetes and multi-cloud visibility for complex estates
- Davis AI accelerates triage and SLO-driven operations
- Broad feature set, including RUM and synthetics in the same platform
Cons
- Pricing based on host memory plus data ingest and retention can raise TCO for Django at scale
- Steep learning curve for new users, particularly
Dynatrace Pricing at Scale
- Full stack: $0.01/8 GiB hour/month or $58/month/8GiB host
- Log Ingest & process: $0.20 per GiB
For a similar 45 TB (~45,000 GB/month) volume, the cost would be $21,850/month*.
Tech Fit
Dynatrace is best suited for Django teams operating in Kubernetes or multi-cloud environments where automated discovery, service flow mapping, and AI-assisted root cause analysis provide the most value—especially when Django apps span web nodes, Celery workers, databases, and third-party services.
5. Sentry
Overview
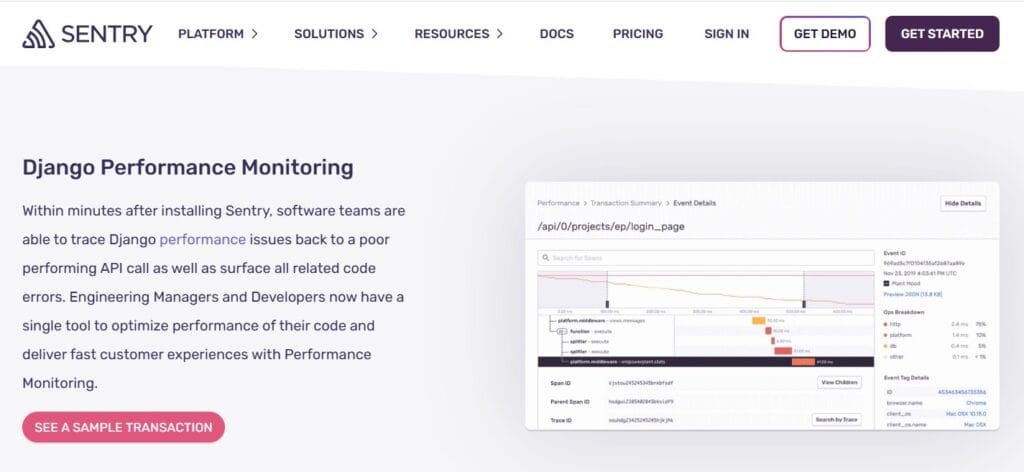
Sentry is a developer-first platform built around error monitoring and performance tracing for Django. It plugs directly into Django settings and middleware to capture exceptions, transactions, and user context, then ties them to releases and deploys so engineers can move from a stack trace to the exact commit in seconds—ideal when product teams want issue workflows and performance insights in one place.
Key Advantage
Exception-to-release workflow for Django: catch an error or slow transaction, see the impacted users and sessions, pinpoint the code change, and ship a fix with guardrails like alerts and regression detection.
Key Features
- Django integration: First-class SDK for views, middleware, templates, and management commands with minimal code changes.
- Error & issue management: Grouped issues, fingerprints, ownership rules, and release health to drive fast, accountable fixes.
- Performance tracing: Transaction spans for Django endpoints, database calls, and external services to uncover N+1 queries and latency regressions.
- User context & breadcrumbs: Link user/session data and action trails to errors and slow requests for clear reproduction steps.
- Release & deploy tracking: Map errors and performance to specific releases and commits for surgical rollback or hotfixes.
Pros
- Best-in-class developer UX for triaging Django errors and regressions
- Quick setup with rich defaults and opinionated issue workflows
- Strong performance tracing for endpoints, DB calls, and templates
- Tight linkage to releases, deploys, and source code ownership
Cons
- Error reporting delays
- Can be costly for smaller teams
Sentry Pricing at Scale
Free up to 5K events/month; Teams: from $26/month; Business: usage-based, with tiers for performance monitoring and session replay, starting from $80/month. For mid-sized teams ingesting 45 TB of data, the cost could be $12,100/month*.
Tech Fit
Great for product-led Django teams that prioritize error visibility, performance tracing, and release health with tight developer workflows. If you also need centralized logs, infra/Kubernetes metrics, and long-term retention under one bill, a full-stack platform like CubeAPM is the better fit.
6. SigNoz
Overview
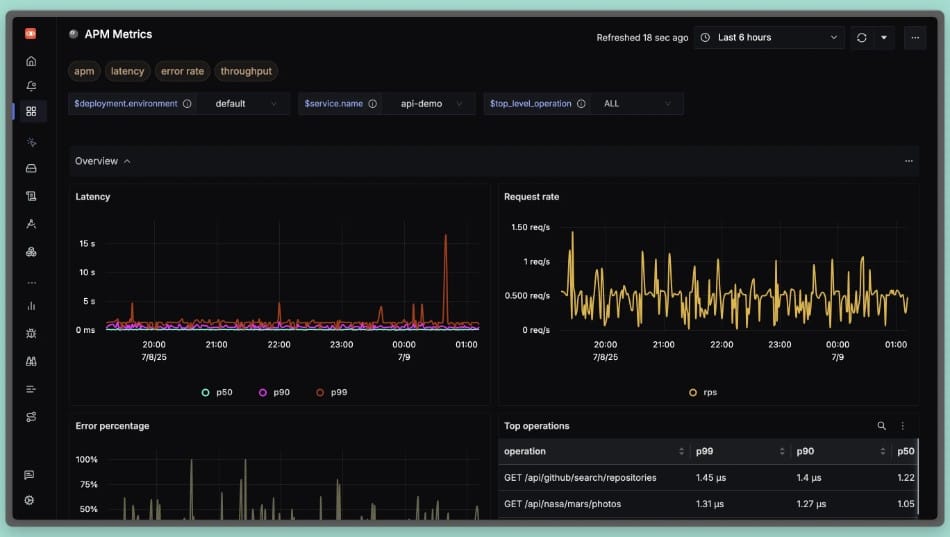
SigNoz is an OpenTelemetry-native observability platform that many Python teams choose when they want vendor-neutral instrumentation and a straightforward path to light up Django traces, logs, and metrics. Its Django guides cover OTel auto-instrumentation and logging patterns, and the product ships opinionated RED dashboards so you can see request rate, errors, and duration for your Django endpoints out of the box.
Key Advantage
OpenTelemetry-first Django monitoring that lets you instrument once and keep your backend options flexible while still getting usable RED dashboards and request traces quickly.
Key Features
- Django OTel auto-instrumentation: Capture transactions across views, middleware, ORM queries, and Celery tasks with minimal code changes.
- RED dashboards for Django: See request rate, error percentage, and latency by endpoint to spot regressions early.
- Django logging integration: Ingest structured application logs and correlate them with traces for faster root-cause analysis.
- Gunicorn/Kubernetes visibility: Track worker behavior and surface infra signals that impact Django request latency.
- Custom spans & attributes: Add tenant, user, or order context to traces for precise debugging in multi-tenant apps.
Pros
- OpenTelemetry-native approach reduces lock-in
- Clear onboarding for Python and Django with practical guides
- Good correlation across traces, logs, and baseline metrics
- Self-host or managed cloud options for different compliance needs
Cons
- Self-hosting introduces operational overhead for teams without platform capacity
- Fewer integrations
SigNoz Pricing at Scale
SigNoz Cloud bills logs/traces as per usage; around $0.30 per GB for ingested traces/logs, and $0.10/GB for metrics, plus you may wish to pay extra for add-ons. Using our 45 TB scenario, the cost could be $16,000/month*.
Tech Fit
Best for Django teams standardizing on OpenTelemetry who want quick wins with traces, logs, and RED metrics, and the flexibility to choose self-hosted or managed cloud as they scale.
7. AppSignal

Overview
AppSignal focuses on developer-friendly APM for Python with a clear Django path. Its Django agent instruments views, middleware, database calls, Celery workers, and templates, while built-in workflows help teams spot N+1 queries, slow endpoints, and error clusters. The experience is intentionally simple: quick install, opinionated defaults, and lightweight dashboards that tie traces, errors, and host metrics together.
Key Advantage
Practical Django performance tooling that highlights N+1 queries and slow database paths in context—so engineers can move from a slow view to the responsible query and fix it quickly.
Key Features
- Django-aware tracing: Views, middleware, template rendering, and external calls show up as readable spans for fast diagnosis.
- ORM & DB insight: Tracks Django ORM queries and timings for MySQL/Postgres/SQLite to expose N+1 and slow SQL.
- Celery visibility: Surfaces background job performance alongside web transactions to spot queue backlog and retries.
- Error monitoring: Groups exceptions with stack traces and request context for quick triage.
- Logging add-on: Centralize app logs and correlate them with traces; optional long-term log storage available.
Pros
- Very easy Django onboarding with opinionated defaults
- Helpful guidance and content for fixing N+1 and slow SQL
- Clean UI that keeps traces, errors, and host basics together
- Unlimited users, teams, and apps included on plans
Cons
- Quotas are request-based rather than per-GB; modeling very large data volumes requires tier upgrades or enterprise discussion
- Fewer integrations
AppSignal Pricing at Scale
AppSignal lists APM in USD at approximately $23.25/month (monthly) for 250K requests/month. Logging is a paid add-on with 1 GB included and larger storage buckets available on higher-priced tiers; enterprise add-ons (e.g., HIPAA, SAML SSO, long-term log storage) are billed separately.
For a mid-sized company emitting 45 TB/month of telemetry, the total cost depends on how that 45 TB splits across requests vs. logs and which logging buckets you choose, but at this volume, you’ll move beyond base allowances into larger buckets or enterprise discussions.
Tech Fit
Best for Django teams that want a lightweight APM focused on developer ergonomics—pinpointing N+1 queries, slow endpoints, and common pitfalls—without a heavy enterprise footprint. If your workloads emit very large log volumes or require strict retention under one price meter, CubeAPM’s per-GB model will be easier to budget.
8. Atatus
Overview
Atatus is a lightweight observability platform with a straightforward Django path, offering APM, logs, RUM, and synthetics under one roof. Its Python/Django agent focuses on request traces, database timing, error tracking, and template/render performance, and it pairs cleanly with infrastructure and log views so Django teams can follow an issue from view → query → host without jumping tools.
Key Advantage
Simple Django onboarding with clear, framework-aware tracing and error visibility that ties directly to logs and infra for quick, practical triage.
Key Features
- Django request tracing: Tracks views, middleware, and external calls to surface slow endpoints and dependencies.
- Database visibility: Captures query latency and throughput so you can spot slow SQL paths and N+1 patterns fast.
- Error tracking for Django: Groups exceptions with stack traces and context, tied to the exact transaction and release.
- Template/render insights: Highlights render time within Django transactions to isolate template bottlenecks.
- Log correlation: Links application logs with APM traces to reduce guesswork during incident response.
Pros
- Clear, developer-friendly UI for Django APM
- Easy setup and quick time to value
- Unified APM, logs, RUM, and synthetics
- Works well for teams that prefer a simple, guided workflow
Cons
- Log pricing is billed per GB per month and can become expensive at high volumes
- APM is billed per host-hour, so costs scale with host count and uptime
- Documentation needs improvement
Atatus Pricing at Scale
Atatus’s official pricing lists APM at ~$0.07 per host-hour, infrastructure at ~$0.021 per host-hour, and logs at $2 per GB ingested. Additional modules are billed separately, including RUM at $1.96 per 10K views, synthetics at $1.50 per 10K runs, and API analytics at $1 per 10K events. As environments scale, costs rise linearly with host count, log volume, and user traffic. Support is included, with optional premium support for enterprise plans. This makes Atatus predictable, but potentially expensive for high-volume, data-heavy workloads.
Tech Fit
A good fit for Django teams that want a clean, guided APM experience with practical traces, errors, and logs in one place. If your workloads generate large log volumes or you run many hosts, consider total cost carefully—or choose CubeAPM to keep pricing linear and easier to forecast.
9. Middleware
Overview
Middleware is a pay-as-you-go observability platform that leans on OpenTelemetry under the hood and provides a streamlined Python path for Django teams. Its Python APM adds both zero-code auto-instrumentation and a CLI wrapper (middleware-run) to capture traces, metrics, logs, profiling, and custom attributes—plus framework-specific run commands for Django and Gunicorn—so engineers can light up end-to-end telemetry with minimal code changes.
Key Advantage
Zero-code Python setup with framework-aware commands (including manage.py runserver and Gunicorn) that auto-installs OTel instrumentation libraries and starts streaming Django traces in minutes.
Key Features
- Django runtime coverage: Auto-instrument requests, view handling, DB calls, and background work with OTel libs installed via middleware-bootstrap.
- Zero-code start: Use middleware-run to wrap your Django server or Gunicorn/Uvicorn startup and emit traces, metrics, and logs.
- Custom telemetry: Add custom spans, metrics, and log attributes to tag tenants, users, or order IDs for faster RCA.
- Continuous profiling: Capture CPU/time hotspots alongside traces for deeper performance analysis.
- Kubernetes-friendly: Host-agent and env-var patterns integrate with cluster services so Django telemetry keeps flowing across rollouts.
Pros
- Fast Django onboarding with zero-code and CLI wrapper
- Full-stack signals in one place (traces, metrics, logs, profiling)
- OpenTelemetry alignment reduces vendor lock-in
- Clear, usage-based pricing with default 30-day retention
Cons
- Add-ons like RUM, synthetics, and OpsAI are separately metered and can raise the total cost at higher usage
- Complex to set up
- Steep learning curve
Middleware Pricing at Scale
Middleware prices metrics, logs, and traces at $0.30 per GB, with a default 30-day retention, and optional add-ons (e.g., $1 per 1K RUM sessions, $1 per 5K synthetic checks). For a mid-sized team ingesting 45 TB/month (45,000 GB), the cost would be:
45,000 GB × $0.30/GB = $13,500/month (excluding errors, RUM, or synthetics)
Tech Fit
A strong fit for Python/Django apps that want OTel-based auto-instrumentation, quick CLI onboarding, and flexible self-service configuration—especially teams standardizing on Kubernetes and looking to correlate traces, logs, profiling, and custom attributes without heavy code changes.
How to Choose the Right Django Monitoring Tool
Align with Django workload patterns
Select a tool that understands Django’s runtime model—transaction lifecycles in WSGI/ASGI, template rendering, middleware chains, ORM query introspection, and async tasks. A generic APM that doesn’t break out Django internals may hide critical bottlenecks (e.g., N+1 queries).
Prioritize vendor-agnostic instrumentation
Go for tools that accept OpenTelemetry instrumentation out of the box. That way, you avoid rewriting instrumentation if you switch backends or evolve into microservices. Projects using Django + Celery benefit greatly from this flexibility.
Ensure cross-layer signal correlation
Your monitoring tool should correlate logs ↔ traces ↔ metrics ↔ real-user sessions in the context of Django. For example, a slow view should link automatically to the offending SQL query, infra CPU spike, and user-session impact, all in one pane.
Evaluate retention, storage & cost models
Django apps generate bursts (e.g., log events per HTTP request, background job retries). You want a tool whose pricing and retention scale gracefully rather than exploding when tag cardinality or trace volume surges.
Consider deployment and compliance constraints
If your Django workload is subject to data sovereignty, regulatory compliance (HIPAA, GDPR, India DPDP), or security boundaries, you’ll want a monitoring tool that supports self-hosting, BYOC, regionally isolated installs, or data residency options.
Check scaling & multi-cluster compatibility
Django apps often live in Kubernetes or multi-cloud setups. The monitoring tool should auto-discover Django pods, maintain trace context during rollouts, and intelligently map dependencies across those clusters.
Look for customization & extension APIs
Real-world Django projects are rarely textbook. You’ll need the ability to add custom spans (e.g., background jobs, tenant flows) or enrich traces with application metadata (user ID, cart size). Tools that restrict customizing instrumentation become limiting over time.
Conclusion
Choosing a Django monitoring tool is tricky: costs balloon with per-host meters and event overages, Django-specific depth varies (views, ORM, Celery, templates), and many stacks still struggle to correlate logs ↔ traces ↔ RUM with multi-cloud/Kubernetes reality. Teams also need flexible deployment and compliance without rewiring instrumentation.
CubeAPM solves these pain points with OpenTelemetry-native Django monitoring, unified signals (APM, logs, RUM, synthetics), and compliance-ready deploy options. Smart Sampling preserves the signals that matter, and the simple $0.15/GB pricing keeps budgets predictable, even as traffic grows.
Ready to make Django performance obvious and billing boring?
Book a FREE demo with CubeAPM.
Disclaimer: The information in this article reflects the latest details available at the time of publication and may change as technologies and products evolve.
FAQs
1. What should I monitor first in a new Django app if I only have a day to set things up?
Start with request latency and error rate per endpoint, slowest DB queries, and Celery task failures. Add an alert for a sudden rise in 5xx on critical paths (login, checkout, payments) and a dashboard showing P50/P95/P99. This gives fast, high-value coverage without boiling the ocean.
2. Do Django monitoring tools work well with async (ASGI) and traditional WSGI setups?
Yes—modern tooling supports both. Just confirm the agent or OpenTelemetry auto-instrumentation covers ASGI middleware, lifespan events, and task queues. Mixed estates (ASGI web + WSGI admin + Celery workers) are common and fully supportable.
3. How do I keep costs predictable as my Django traffic grows?
Favor a single-meter pricing model and use sampling strategically. CubeAPM charges per-GB ingested with Smart Sampling to retain high-value traces (errors, slow calls) while trimming noise, so bills scale linearly and stay predictable as throughput rises.
4. Can I meet data residency/compliance needs with Django monitoring?
Yes—choose a platform that supports BYOC/self-host and retention controls. CubeAPM offers deployment flexibility and long-term retention without separate per-feature fees, making it easier to satisfy residency and audit requirements.
5. What’s the fastest way to correlate a spike in Django errors with the root cause?
Use cross-signal pivoting: open the spike in traces, jump to the failing view, inspect the linked SQL span and recent deploy, then pull the exact error log line for context. Tools that stitch logs ↔ traces ↔ RUM ↔ infra in one place (e.g., CubeAPM) cut MTTR dramatically compared to hopping between separate products.


