As of 2025, an overwhelming 94% of enterprises leverage cloud services to run critical workloads. This boom has fueled the rise of observability platforms like Splunk Observability Cloud, which offers a unified stack combining infrastructure monitoring, application performance monitoring, log analytics, real user monitoring, and synthetic testing.
However, Splunk Observability Cloud has a host-based pricing plan starting from $15 to $75 per host/month, which can scale high with a larger number of users. Users on G2 complain about platform setup complexity and dashboard issues. Also, Splunk Observability Cloud is a SaaS-only platform, so organizations with strict data residency needs must evaluate this carefully.
CubeAPM is the best Splunk Observability Cloud alternative, with an affordable, ingestion-based pricing of $0.15/GB and smart sampling to further reduce storage costs. It is OpenTelemetry-native, easy to use, supports 800+ integrations to simplify instrumentation, and supports self-hosting/on-prem deployment for compliance. This article discusses the top Splunk Observability Cloud alternatives based on pricing, features, and other details.
Top 7 Splunk Observability Cloud Alternatives
- CubeAPM
- Dynatrace
- Datadog
- New Relic
- IBM Instana
- Grafana Cloud
- Elastic Observability
Why Look for Splunk Observability Cloud Alternatives?
High Pricing
Splunk Observability Cloud’s host-based pricing model makes it expensive for smaller teams. Infrastructure monitoring starts at $15 per host/month, with full-stack plans rising to $75 per host/month. And that doesn’t include extra charges for data retention and add-ons. Many users flag escalating costs as the main reason they seek alternatives.
SaaS-Only
Splunk Observability Cloud is a SaaS-only platform with no option for on-premise or self-hosting deployment. While this takes away the effort to maintain the infrastructure from the team. Organizations with strict data residency requirements must carefully validate this before going forward.
Steep Learning Curve & UI Complexity
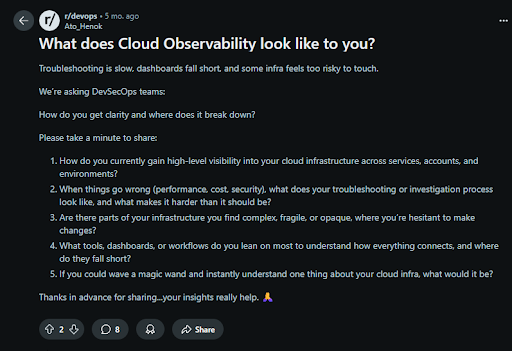
Splunk’s platform is powerful but not beginner-friendly. The interface is cluttered, and custom dashboards often require knowledge of Splunk’s proprietary query language. This makes onboarding new engineers slow and forces companies to rely on Splunk specialists. Reviews on G2 frequently mention the steep learning curve, while Reddit users compare Splunk unfavorably to simpler OTEL-native tools.
Criteria for Suggesting Splunk Observability Cloud Alternatives
When evaluating alternatives to Splunk Observability Cloud, it’s important to go beyond feature checklists and focus on long-term scalability, transparency, and operational efficiency. Here are the key criteria we used to identify the top options:
Transparent Pricing Models
One of the biggest challenges with Splunk Observability Cloud is its complex and often unpredictable pricing. Strong alternatives should offer clear, usage-based or flat GB-based pricing that scales fairly with data growth, instead of expensive host-based tiers and add-ons that quickly inflate bills.
OpenTelemetry-Native Support
Future-proof observability depends on open standards. Alternatives must be OpenTelemetry-native, ensuring easy instrumentation across services, portability between vendors, and freedom from vendor lock-in. This is critical for teams modernizing their monitoring pipelines.
Full MELT Coverage
Observability isn’t just about logs or metrics in isolation. The best tools provide end-to-end MELT coverage—metrics, events, logs, and traces—so teams can correlate issues in real time, reduce mean time to resolution (MTTR), and get holistic visibility into system health.
Scalability for Kubernetes & Cloud-Native Workloads
Modern environments are increasingly containerized and dynamic. Alternatives should be built for Kubernetes and cloud-native architectures, offering auto-discovery, service maps, and efficient scaling for workloads that change by the minute.
Enterprise-Grade Compliance & Hosting Options
Compliance and data governance remain top priorities. Leading alternatives provide flexible deployment models, including on-prem or self-hosted options for industries bound by HIPAA, GDPR, or data residency laws—without sacrificing performance.
Support Quality & Community Backing
Finally, observability tools are only as good as the support behind them. Alternatives must offer fast, developer-friendly support and active communities. Tools that provide real-time Slack or chat-based help and strong documentation dramatically reduce downtime and adoption friction.
Splunk Observability Cloud Overview
Known for
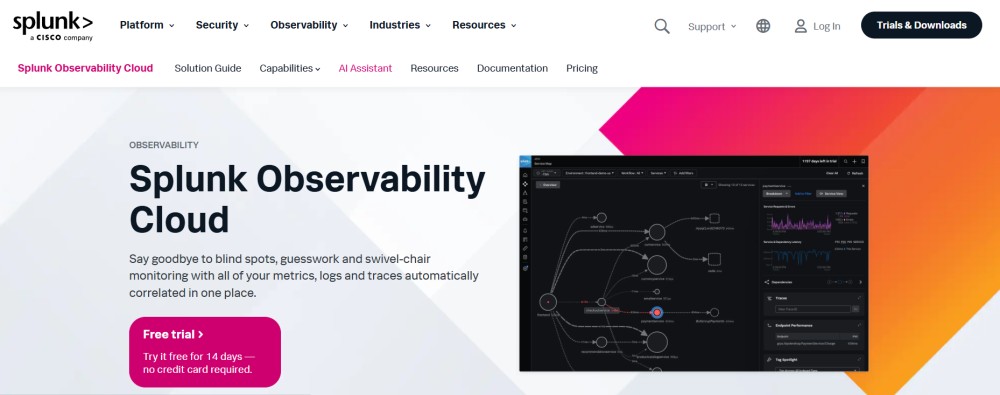
Splunk Observability Cloud is known as a cloud-native, full-stack observability solution that correlates metrics, traces, and logs in real time. It is primarily used by enterprises running hybrid or multi-cloud environments that need fast incident detection and system-wide visibility.
Standout Features
- Unified MELT data model: Brings together metrics, events, logs, and traces for correlation and faster investigations.
- Real-time streaming analytics: Processes telemetry data with sub-second latency for quick root cause analysis.
- OpenTelemetry support: Built with OTEL compatibility to reduce vendor lock-in and simplify instrumentation.
- Enterprise scalability: Designed for large-scale, distributed applications across hybrid and multi-cloud environments.
Key Features
- Infrastructure monitoring: Tracks servers, containers, and cloud services with live performance views.
- Application performance monitoring (APM): Offers distributed tracing, service maps, and dependency analysis.
- Logs: This tool collects and correlates logs with metrics and traces.
- Real User Monitoring (RUM): Provides visibility into end-user experience for web and mobile apps.
- Synthetic monitoring: Simulates user journeys and API checks to track uptime.
- Guided onboarding: Offers tutorials and templates for faster adoption.
Pros
- Strong analytics and real-time correlation across MELT data
- Scales well for hybrid and multi-cloud deployments
- Flexible pricing models with entity-based and activity-based options
- Backed by Splunk’s established enterprise ecosystem
Cons
- Costs increase quickly with more hosts and data volume
- Product modules can add complexity in setup and management
- Steeper learning curve for advanced dashboards and queries
Best for
Splunk Observability Cloud is best for large enterprises that need unified monitoring of applications and infrastructure at scale. It suits organizations already invested in the Splunk ecosystem or those requiring real-time visibility across hybrid and multi-cloud environments.
Splunk Observability Cloud Pricing & Customer Reviews
- Pricing: infra: $15/host/month (billed annually); APM & infra: $60/host/month; end-to-end: $75/host/month
- G2 rating: 4.4/5
- Praised for: Strong real-time streaming, scalability, and unified visibility
- Criticized for: High cost at scale, learning curve for new users
Top 7 Splunk Observability Cloud Alternatives
1. CubeAPM
Known for
CubeAPM is known as an OpenTelemetry-native, full-stack observability platform that provides affordable and predictable monitoring for metrics, logs, traces, and events. It is designed for modern engineering teams seeking a hybrid, compliance-ready observability solution, without vendor lock-in.
Standout Features
- Smart sampling technology: Retains high-value traces (error-prone, latency-heavy) while reducing overall storage needs by up to 50%.
- Compliance-ready on-prem & BYOC hosting: CubeAPM can be fully deployed as customer-managed on-prem or cloud environments. Its compliance-ready hosting makes it attractive to meet data residency requirements.
- Transparent pricing model: $0.15/GB with no hidden licenses or add-on fees.
- Slack-based real-time support: Direct connection with core engineers for faster issue resolution.
Key Features
- Application Performance Monitoring (APM): The APM comes with distributed tracing, service maps, and dependency analysis for faster root-cause detection.
- Log monitoring: CubeAPM lets you ingest, search, and correlate logs with metrics as well as traces.
- Infrastructure monitoring: Deep visibility into hosts, containers, and Kubernetes clusters.
- Synthetic monitoring: Simulate user transactions and APIs to ensure uptime and SLA compliance.
- RUM: You can track end-user experience on both web and mobile.
- Error tracking: Identify and resolve application errors with contextual telemetry data.
- Integrations: 800+ integrations with cloud services, databases, and popular developer tools.
Pros
- Affordable and predictable costs suitable for high-volume telemetry
- Full MELT coverage in a single unified platform
- Seamless OpenTelemetry, Prometheus, and Datadog/New Relic compatibility
- Onboarding is fast and easy
- 800+ integrations are available
Cons
- Less suited for organizations requiring fully vendor-hosted SaaS-only deployments
- Focused on observability only and does not extend to cloud security management
Best for
CubeAPM is best for companies that are looking for self-hosting plus BYOC observability solutions. It’s also ideal for those that ingesting terabytes of telemetry monthly and need affordable, compliance-ready solutions with fast support. Teams that use OpenTelemetry standards and want to skip vendor lock-in are also an excellent fit.
CubeAPM Pricing & Customer Reviews
- Pricing: $0.15/GB ingestion. No extra fees for users, hosts, or add-ons.
- G2 Rating: 4.7/5
- Praised for: Cost transparency, smart sampling, ease of setup, 800+ integrations, and responsive Slack-based support.
CubeAPM vs Splunk Observability Cloud
Although powerful, Splunk Observability Cloud’s host-based pricing is expensive at scale, and retention costs are extra. CubeAPM delivers the same MELT coverage at a $0.15/GB pricing, offers compliance-ready on-prem and BYOC deployments, and includes real-time support.
2. Dynatrace
Known for
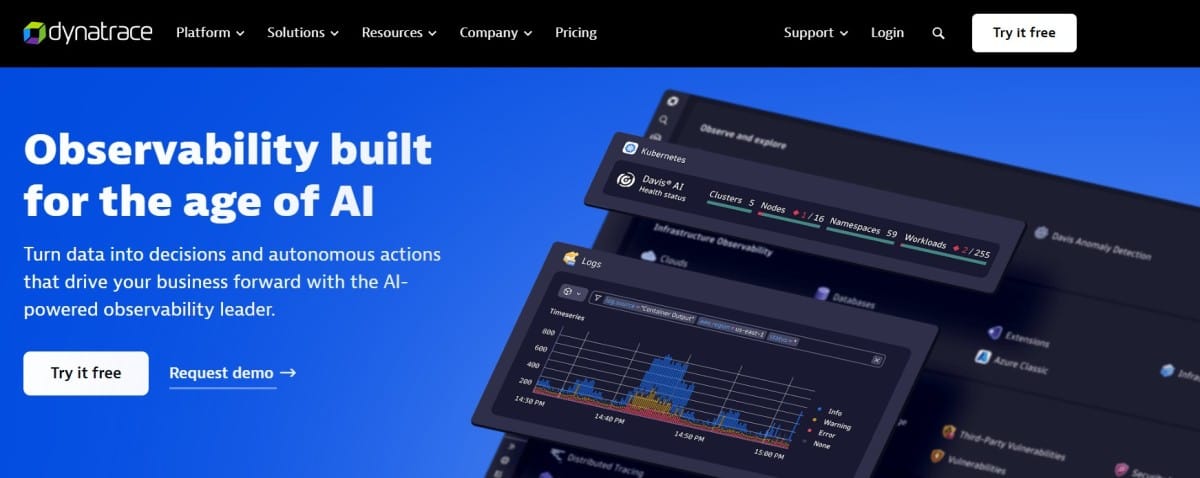
Dynatrace is known for delivering AI-driven, automated full-stack observability. Its platform automatically discovers, maps, and monitors even the most complex hybrid and multi-cloud environments, providing real-time insights with minimal manual setup. Primarily SaaS, but it’s also available as Dynatrace Managed, a self-hosted edition for on-prem or private cloud environments.
Standout Features
- OneAgent auto-instrumentation: Installs once and automatically discovers services, processes, and dependencies across hosts, containers, and cloud environments.
- Davis AI: Identifies anomalies and root causes using predictive and causal AI techniques to lower triage time.
- Grail with DQL analytics: Provides a high-performance data lakehouse and query language to analyze logs, metrics, and traces in context.
- Smartscape topology mapping: Continuously updates real-time maps of service dependencies, making complex systems easier to understand.
Key Features
- Infrastructure observability: Complete visibility into multi-cloud, containerized, and on-premise environments with unified health views.
- Application monitoring (APM): Includes distributed tracing, service flow analysis, and code-level diagnostics for pinpointing performance issues.
- Log management and analytics: Supports usage-based ingest and retention, with flexible options for querying and storage.
- Digital experience monitoring: Combines Real User Monitoring and session replay to connect user experience with backend performance.
- Automation and extensibility: Provides tools like AutomationEngine and AppEngine to build custom workflows and apps on top of observability data.
Pros
- Excellent for automation with topology mapping and OneAgent
- Accurate AI-based anomaly detection plus RCA
- Unified data model that combines logs, metrics, and traces
- Excellent fit for large, Kubernetes-heavy, multi-cloud environments
Cons
- Expensive for smaller teams
- Difficult to learn advanced features
Best for
Dynatrace is best for enterprises and scaling organizations running complex microservices architectures on Kubernetes and multi-cloud platforms. It’s ideal for teams that want automated setup, AI-powered troubleshooting, and end-to-end coverage without managing multiple separate tools.
Dynatrace Pricing & Customer Reviews
- Pricing: Full-Stack Monitoring is billed at about $0.08 per hour for an 8 GiB host
- G2 rating: 4.5/5 (based on 1,300+ reviews).
- Praised for: Automation through OneAgent, accurate root-cause analysis with Davis AI, and broad coverage across infrastructure, APM, and digital experience monitoring.
- Criticized for: Costly
Dynatrace vs Splunk Observability Cloud
Splunk focuses on real-time data streaming and correlation, while Dynatrace emphasizes automation and AI-powered causal analysis. Splunk’s pricing is tiered by host ($15–$75 per host/month), whereas Dynatrace charges by usage, such as per-hour host rates and data volume for logs.
3. Datadog
Known for
Datadog is known for full-stack, SaaS-based observability that combines infrastructure, APM, logs, real user monitoring, synthetics, and security in one platform. It’s widely adopted for its broad integrations and easy-to-use interface tailored to cloud-native teams. Datadog is a cloud-only SaaS platform and does not support on-prem or hybrid deployments. However, its agents can ingest telemetry from any environment into the Datadog cloud backend.
Standout Features
- Unified, modular platform: Infrastructure, APM, logs, RUM, and synthetics under one roof, reducing the need for multiple tools.
- 900+ integrations: Connects easily with cloud providers, databases, frameworks, and developer tools for quick adoption.
- Correlated telemetry: Brings together traces, metrics, logs, and UX data for faster root-cause analysis.
- AI assistance (Watchdog/Bits AI): Detects anomalies and surfaces actionable insights to cut through alert noise.
Key Features
- Infrastructure Monitoring: Monitors hosts, containers, serverless workloads, and cloud platforms with tag-based analytics.
- Application Performance Monitoring (APM): Offers distributed tracing, service maps, code-level insights, and change impact analysis.
- Log Management: Provides ingest, storage, search, and analysis with flexible retention options.
- Digital Experience Monitoring (RUM + Session Replay): Tracks front-end performance and user journeys with the ability to replay sessions.
- Synthetic Monitoring: helps you maintain your app’s uptime and reliability through mobile, API, and browser tests.
Pros
- Wide all-in-one coverage for observability and monitoring
- Mature ecosystem with hundreds of integrations
- Strong correlation across metrics, traces, logs, and user data
- User-friendly interface that scales well for teams and enterprises
Cons
- Costs rise quickly as more modules and retention add-ons are enabled
- SaaS-only; no self-hosting
Best for
Datadog is best for teams seeking a polished, SaaS-first observability suite with deep integrations and a single-pane-of-glass experience. It’s especially strong for fast-moving product teams on Kubernetes and multi-cloud setups.
Datadog Pricing & Customer Reviews
- Pricing: Infrastructure Monitoring starts at $15 per host/month (annual billing); APM is billed at around $35 per APM host/month; Logs are priced at $0.10 per GB ingested
- G2 rating: 4.4/5
- Praised for: Feature breadth, large integration ecosystem, and seamless correlation across telemetry data.
- Criticized for: Costly at scale
Datadog vs Splunk Observability Cloud
Datadog focuses on breadth and modularity, offering a vast integration catalog and an intuitive SaaS-first experience. Splunk Observability Cloud, on the other hand, emphasizes real-time streaming analytics and a simpler host-tiered pricing model. Teams wanting quick setup and broad integrations often prefer Datadog, while those already tied to Splunk’s ecosystem may choose Splunk OC.
4. New Relic
Known for
New Relic is known for being an all-in-one observability platform that unifies APM, infrastructure, logs, real user monitoring, and synthetics into a single SaaS product. It focuses heavily on correlating metrics, events, logs, and traces, giving engineering teams context-rich insights to troubleshoot faster. It’s delivered entirely as a SaaS service; no on-prem or hybrid edition is available. Teams send all telemetry data into New Relic’s managed backend.
Standout Features
- Usage-based pricing with free ingest: Offers 100 GB/month of free data ingest before shifting to predictable per-GB pricing.
- MELT with context: Features, such as Errors Inbox, connect issues to traces as well as spans directly, which helps you perform RCA easily.
- AI-driven assistance: Surfaces anomalies, gaps, and insights to reduce noise and streamline operations.
- Wide product breadth: More than 50 capabilities covering APM, infrastructure, digital experience monitoring, and log management.
Key Features
- Application performance monitoring (APM): Provides distributed tracing, service maps, and error analysis to pinpoint issues quickly.
- Infra monitoring: New Relic uses change detection to track your cloud containers, hosts, environments, etc.
- Log management: Collects logs from agents or open-source tools, centralizes them, and makes them searchable.
- Digital experience monitoring (RUM, mobile, synthetics): Measures frontend performance, user journeys, and simulates transactions.
- MELT foundation: Treats metrics, events, logs, and traces as unified building blocks across the platform.
Pros
- Strong correlation across logs, traces, and errors
- Intuitive dashboards and wide-ranging capabilities
- Straightforward onboarding with agents and open collectors
- Clear entry-level model with free ingest and pay-as-you-grow pricing
Cons
- Bills can increase rapidly with heavy data ingest and many active users
- No self-hosting; SaaS-only
Best for
New Relic is best for application-focused teams that want a single SaaS platform for monitoring performance, infrastructure, and user experience. It’s particularly appealing for organizations that prefer usage-based pricing and need in-context troubleshooting across all layers of their stack.
New Relic Pricing & Customer Reviews
- Pricing: Includes 100 GB/month free ingest, with data beyond that billed at about $0.40 per GB. Paid user-based plans start at $49/user/month
- G2 rating: 4.3/5
- Praised for: Easy-to-use dashboards, strong app-centric workflows, and context-driven troubleshooting.
- Criticized for: Costly at scale
New Relic vs Splunk Observability Cloud
Both New Relic and Splunk Observability Cloud cover the full observability stack. New Relic emphasizes usage-based pricing and context-driven troubleshooting, while Splunk focuses on real-time streaming correlation and a host-based pricing model. Teams looking for flexible entry points and app-centric features often prefer New Relic, whereas those invested in Splunk’s ecosystem or needing host-tiered pricing may opt for Splunk OC.
5. IBM Instana
Known for
IBM Instana is known for automated, AI-assisted full-stack observability that requires minimal manual setup. It continuously discovers services and dependencies, maps real-time relationships, and provides code-level insights, bringing APM, infrastructure, and digital experience monitoring together in one platform. Offered as SaaS and as self-hosted options, giving customers flexibility for on-prem or hybrid deployments.
Standout Features
- Auto-discovery and continuous dependency mapping: Instana’s agent automatically identifies services, processes, and dependencies across hybrid and multi-cloud environments to maintain an always-current topology.
- Unbounded analytics on unsampled data: Enables exploration of high-cardinality telemetry without sampling, so teams can ask detailed questions during or after incidents.
- Continuous profiling (AutoProfile): Monitors production code performance in real time and correlates it with traces to pinpoint performance bottlenecks.
- Unified Digital Experience Monitoring (DEM): Combines real user monitoring with synthetic tests in one dashboard for complete visibility of user journeys.
Key Features
- Application Performance Monitoring (APM): Distributed tracing, service maps, and code-level insights with tagging and filtering for faster root cause analysis.
- Infrastructure monitoring: Real-time monitoring that correlates system health, performance, events, and configurations to highlight anomalies.
- Digital Experience Monitoring: Combines real user data with simulated tests to proactively catch user-impacting issues.
- OpenTelemetry support: Ingests OTEL traces, metrics, and logs with full semantic compatibility, though some advanced log features require an add-on.
Pros
- Rapid time-to-value through automatic discovery and mapping
- Strong APM capabilities with continuous profiling
- Comprehensive OTEL support for metrics, logs, and traces
- Unified DEM provides a clear view of both frontend and backend issues
Cons
- High pricing at scale
- UI complexity introduces a learning curve for some teams
Best for
IBM Instana is a good option for enterprises and growing teams with requirements, such as instrumentation automation, code-level diagnostics, and an all-in-one observability tool for their infra, apps, and digital experience. It is especially valuable for organizations running complex Kubernetes or hybrid cloud environments.
IBM Instana Pricing & Customer Reviews
- Pricing: Starts $20/host/month to $75/host/month, on-demand: $0.03/MVS hour per month
- G2 rating: 4.5/5
- Praised for: Quick deployment, detailed insights, broad integrations, and reliable support.
- Criticized for: Costly at scale, UI issues
IBM Instana vs Splunk Observability Cloud
Instana emphasizes automation, continuous profiling, and unsampled analytics, while Splunk Observability Cloud focuses on real-time streaming correlation across MELT. Splunk’s pricing is typically tiered per host, whereas Instana offers tiered editions with flexible licensing. Organizations that value automatic discovery and code-level profiling often lean toward Instana, while those already embedded in Splunk’s ecosystem may prefer Splunk Observability Cloud.
6. Grafana Cloud

Known for
Grafana Cloud is known for providing an open, composable observability stack delivered as a fully managed service. It combines Prometheus-compatible metrics (Mimir), logs (Loki), traces (Tempo), and continuous profiling (Pyroscope) with Grafana’s dashboards, enabling teams to visualize and correlate telemetry without running and maintaining backends themselves. Grafana Cloud is SaaS, but Grafana Labs also supports self-hosted Grafana OSS/Enterprise for hybrid use cases.
Standout Features
- Open standards native: Built to work seamlessly with Prometheus and OpenTelemetry for future-proof instrumentation.
- Prebuilt workflows and service maps: Offers RED metrics dashboards, SLO views, and real-time service maps to speed up adoption.
- Granular, usage-based pricing: Transparent per-unit rates for metrics, logs, traces, profiles, and Kubernetes resources.
- Execution-based synthetic monitoring: API and browser checks priced per execution, with calculators to estimate usage costs.
Key Features
- Metrics (Mimir): Managed Prometheus-compatible metrics with long-term retention and pricing based on active series.
- Logs (Loki): Centralized log ingestion, indexing, and search within Grafana dashboards.
- Traces (Tempo): Grafana Cloud’s distributed tracing is connected directly to logs and metrics, which allows teams to troubleshoot issues quickly.
- Profiles (Pyroscope): Continuous code profiling to detect performance bottlenecks and optimize resources.
- Application Observability: Ready-to-use dashboards, anomaly detection, RED metrics, and integrated OTEL pipelines.
- Synthetic Monitoring: API and browser tests billed per execution, with global coverage and built-in usage estimators.
Pros
- Strong alignment with open standards (OTEL + Prometheus)
- Powerful dashboards that unify metrics, logs, traces, and profiles
- Clear, per-unit usage pricing with a generous free tier
- Well-suited for Kubernetes and multi-cloud teams that don’t want to run their own backends
Cons
- Setup can be complex
- Learning curve
Best for
Grafana Cloud is best for teams that want an open, standards-based observability platform with flexible usage pricing and powerful dashboards. It’s particularly valuable for Kubernetes and multi-cloud environments already using Prometheus metrics and OpenTelemetry traces.
Grafana Cloud Pricing & Customer Reviews
- Pricing: Free; Paid plans start at $19/month
- G2 rating: 4.5/5
- Praised for: Open ecosystem, excellent dashboards, straightforward per-unit pricing, and Kubernetes monitoring.
- Criticized for: Learning curve
Grafana Cloud vs Splunk Observability Cloud
Grafana Cloud focuses on open standards and modular usage-based pricing across metrics, logs, traces, and profiles. Splunk Observability Cloud instead emphasizes real-time streaming correlation and host-based pricing tiers. Teams wanting OTel/Prometheus-native monitoring with flexible cost control often prefer Grafana Cloud, while organizations tied into Splunk’s analytics-first ecosystem may continue with Splunk OC.
7. Elastic Observability
Known for
Elastic Observability offers full MELT capability with logs, metrics, traces, real user monitoring, synthetics, and profiling. It’s delivered as a managed Serverless or Cloud-hosted service, with strong OpenTelemetry (OTel) support and the option for self-managed Elastic Stack for teams that want more control.
Standout Features
- OpenTelemetry-native APM: Supports native OTel ingestion for logs, metrics, and traces with flexible sampling and AI-assisted root cause detection.
- Search-based analytics: Developers can query MELT data and correlate it using Elastic’s fast query language.
- Logsdb with tiered storage: Optimizes high-volume log storage costs while keeping logs searchable at scale.
- Unified digital experience monitoring: Combines real user monitoring with synthetic checks to track Core Web Vitals and replay user journeys.
- Flexible deployment options: Available as pay-per-use serverless, subscription-based cloud-hosted, or self-managed on-premise.
Key Features
- Application Performance Monitoring (APM): Distributed tracing, service maps, mobile app monitoring, and correlation across backend and frontend performance.
- Log monitoring and analytics: Automated anomaly detection, log pattern classification, and cost-optimized storage modes.
- Infra monitoring: Elastic offers plenty of integrations, including cloud services like Kubernetes, alongside health views and topology.
- Real User Monitoring (RUM): Client-side performance visibility by browser, device, and geography with built-in Core Web Vitals.
- Synthetic monitoring: Global API and browser checks to validate uptime and critical workflows.
Pros
- Strong support for open standards like OpenTelemetry
- Search-driven analytics that scale well for large datasets
- Multiple deployment models to suit cloud-native, hybrid, or self-managed needs
- Rich digital experience monitoring features for frontend and backend
Cons
- Complex setup
- Learning curve
- Costly premium support plan
Best for
Elastic Observability is best for teams that want an open, standards-based observability platform with search-grade analytics. It’s particularly useful for organizations handling large log volumes, hybrid estates, or those that want the flexibility to choose between serverless, hosted, or self-managed deployments.
Elastic Observability Pricing & Customer Reviews
- Pricing: Cloud-hosted: $99/month; Serverless: $0.09/GB, data egress includes 50 GB free, then $0.05 per GB, retention at $0.019/GB; self-hosting: custom
- G2 rating: 4.2/5
- Praised for: Scalable log analytics, powerful search capabilities, flexible deployment models, and strong integrations.
- Criticized for: Costs at a very large scale, learning curve
Elastic Observability vs Splunk Observability Cloud
Elastic emphasizes open standards, search-based analytics, and flexible deployment, with serverless per-GB pricing that helps manage cost predictability. Splunk, in contrast, uses host-based pricing tiers and emphasizes real-time streaming correlation. Teams that value openness, deep search, and flexible deployment options often lean toward Elastic, while those standardized on Splunk’s ecosystem may continue with Splunk Observability Cloud.
Conclusion
Splunk Observability Cloud offers strong full-stack observability and real-time analytics, but teams often struggle with its high costs, complex setup, steep learning curve, and SaaS-only deployment.
CubeAPM is the best alternative to Splunk Observability Cloud with an affordable $0.15/GB pricing and smart sampling to cut down costs. It offers an OpenTelemetry-native architecture, 800+ integrations, and self-hosting (BYOC/on-prem) deployment, and faster, real-time Slack-based support.
Book a Free Demo with CubeAPM today and experience full-stack monitoring without the complexity.
Disclaimer: The information in this article reflects the latest details available at the time of publication and may change as technologies and products evolve.
FAQs
1. Why do companies look for Splunk Observability Cloud alternatives?
Many organizations find Splunk Observability Cloud powerful but expensive (especially with host-based pricing), complex setup, learning curve, and SaaS-only deployment.
2. What is the best alternative to Splunk Observability Cloud?
CubeAPM is widely considered the best alternative. It delivers full MELT coverage at $0.15/GB pricing, 800+ integrations, self-hosting deployment, and smart sampling that cuts storage needs.
3. How does CubeAPM compare with other tools like Datadog, Dynatrace, or New Relic?
While Datadog, Dynatrace, and New Relic are strong platforms, they often come with premium pricing or complex licensing. CubeAPM is a predictable, transparent, lightweight, and self-hosting options, making it ideal for teams that want enterprise-grade observability without runaway costs.
4. Do Splunk alternatives support OpenTelemetry?
Yes. Leading alternatives such as CubeAPM, Datadog, New Relic, Grafana Cloud, Elastic Observability, and Instana are OpenTelemetry-native, ensuring flexible instrumentation and reducing vendor lock-in.
5. Which Splunk alternative is best for large-scale Kubernetes or cloud-native environments?
For Kubernetes-heavy, multi-cloud environments, CubeAPM is the most cost-efficient and flexible. It integrates seamlessly with Prometheus and OTel, scales effortlessly to handle high telemetry volumes, and offers on-prem and BYOC deployments.


