The main difference between Splunk AppDynamics, New Relic, and CubeAPM is how they approach observability architecture and cost control.
Splunk AppDynamics is built for large enterprises that need deep application performance monitoring with complex licensing and setup. New Relic follows a SaaS-first, usage-based model that prioritizes ease of adoption but ties cost and data control to the vendor.
CubeAPM takes a different path by offering a self-hosted, OpenTelemetry-native APM with predictable pricing and unlimited data retention. This difference becomes clear as teams scale. In this article, we’ll explore Splunk AppDynamics vs New Relic vs CubeAPM based on several factors.
Splunk AppDynamics vs New Relic vs CubeAPM Comparison
| Feature | CubeAPM | Splunk AppDynamics | New Relic |
| Known for | Unified MELT, native OTel, self-hosting, cost predictability | Enterprise APM, business transaction monitoring, dependency mapping | Full-stack APM, advanced analytics, service maps |
| Multi-Agent Support | Yes (OTel, New Relic, Datadog, Elastic, etc.) | Yes (AppDynamics agents, OTel collector, dual-signal agents) | Yes ( New Relic Agent, OTel, Prometheus) |
| MELT Support | Full MELT coverage | Full MELT coverage | Full MELT coverage |
| Deployment | Self-hosted with vendor-managed | SaaS & self-hosted | SaaS-only |
| Pricing | Ingestion-based: $0.15/GB | Infra: $6/vCPU/month; APM+infra:$33/vCPU/month; Enterprise: $50/vCPU/month | Free 100 GB/month; beyond that, $0.40/GB, per-user: $49-$349 |
| Sampling Strategy | Smart sampling, automated, context-aware | Agent-based, head- & tail-based via OTel Collector | Adaptive head-based and tail-based |
| Data Retention | Unlimited Retention (no extra cost) | Events: 8d; Metrics: 8d-13m (SaaS); 4h-13m (on-prem) | 30 days for logs/events (120 days in Data Plus); add-on retention |
| Support Channel & TAT | Slack, WhatsApp; response in minutes | Support portal (paid); TAT: 2d to 30 min based on tier (P1-P4) | Community, docs, ticket; TAT: 2d to 2 hrs, 1 hr (priority) |
Splunk AppDynamics vs New Relic vs CubeAPM: Feature-by-Feature Breakdown
In practice, teams usually evaluate these platforms only after experiencing cost surprises, operational friction, or blind spots during incidents. We’ve seen organizations run multiple observability tools in parallel during evaluations, and the differences between AppDynamics, New Relic, and self-hosted platforms like CubeAPM tend to surface most clearly under scale, failure conditions, and compliance reviews.
Known for
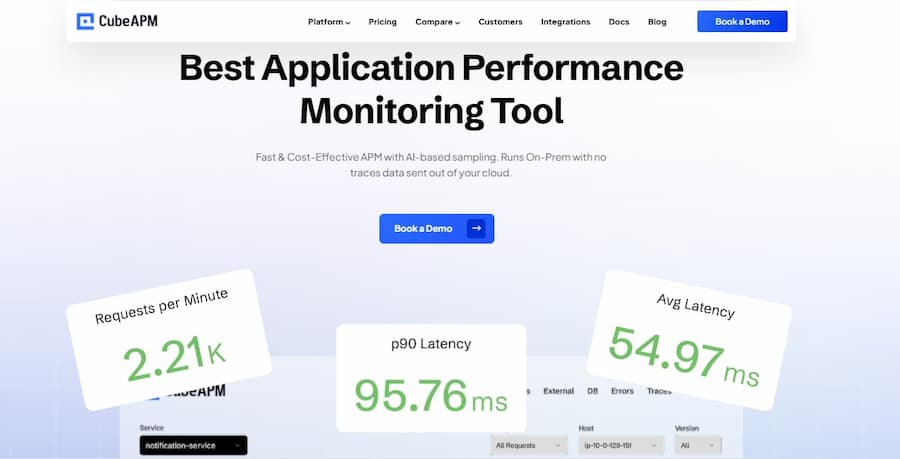
CubeAPM is known for providing unified MELT observability in a self-hosted, OpenTelemetry-native architecture with strong cost predictability. The platform is designed for teams that want full-stack visibility while keeping telemetry data inside their own cloud or on-prem environment. In practice, CubeAPM is often chosen by fast-growing SaaS teams and regulated organizations that want to avoid SaaS lock-in, control data residency, and retain observability data long term without retention-based pricing penalties.
Splunk AppDynamics is known for deep, enterprise-grade application performance monitoring with a strong focus on business transaction visibility. It excels at mapping complex application dependencies, monitoring long-running transactions, and correlating application health with business outcomes. AppDynamics is typically adopted by large enterprises running monolithic or hybrid systems where detailed transaction-level insight and executive reporting are prioritized over deployment simplicity.
New Relic is known for full-stack, SaaS-first observability with a broad set of features spanning APM, infrastructure monitoring, logs, frontend monitoring, and analytics. It is widely used for its quick onboarding experience, extensive integrations, and strong support for cloud-native workloads. New Relic works well for teams that value convenience and fast time-to-value.
Multi-Agent Support
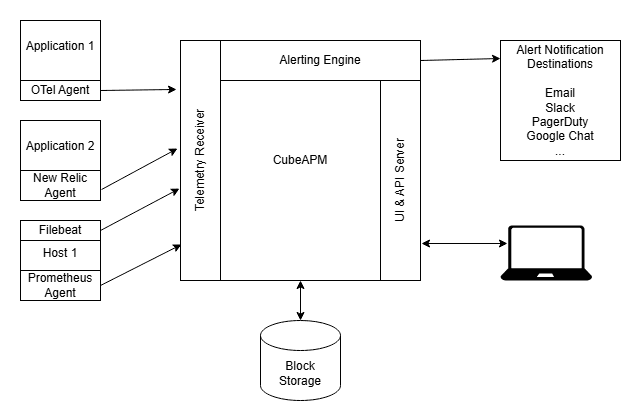
CubeAPM supports a broad range of instrumentation sources out of the box, including OpenTelemetry, New Relic agents, Datadog agents, and Elastic agents. This means if your services are already instrumented for another vendor, you can often reuse that instrumentation with CubeAPM, reducing migration friction. CubeAPM’s support for multiple agent types and OTLP (OpenTelemetry Protocol) makes it easier to unify telemetry without vendor lock-in.
Splunk AppDynamics offers flexible data collection primarily through its own AppDynamics agents, which are designed to automatically discover applications and trace transactions. AppDynamics also supports OpenTelemetry via the OpenTelemetry Collector or combined agent modes, allowing you to send telemetry into the platform using standard OTel pipelines as well.
New Relic supports instrumentation via its native agents as well as through OpenTelemetry SDKs and OTLP ingestion. New Relic’s documentation highlights that you can mix and match New Relic agents with OpenTelemetry-based telemetry sources, giving flexibility in how you collect data. This flexibility helps teams adopt open standards while still benefiting from New Relic’s integrated observability workflows.
MELT support
CubeAPM provides full MELT support with a focus on unified correlation across traces, logs, metrics, and events by default. The platform is designed so that logs and metrics are first-class citizens alongside traces, making it easier to pivot from a slow request to related logs or infrastructure signals without switching tools. In practice, CubeAPM emphasizes keeping MELT correlation lightweight and consistently available, even at higher data volumes, since pricing and retention are not segmented by signal type.
Splunk AppDynamics also supports all MELT components, with particular strength in traces, metrics, and business transactions. Application flows and dependency maps are tightly integrated with performance metrics, and logs are commonly brought in through Splunk’s broader logging ecosystem. This approach works well in environments already standardized on Splunk, though log correlation is often implemented as part of a broader Splunk observability.
New Relic offers comprehensive MELT support across APM, infrastructure, logs, browser monitoring, and events, all within a single SaaS platform. Correlation between signals is strong, especially for cloud-native workloads, and dashboards can combine multiple data types easily. However, because logs, traces, and metrics all contribute to usage-based pricing, teams often have to be intentional about how much data they retain and correlate at scale.
Deployment

CubeAPM is deployed inside the customer’s own cloud or on-prem environment, while still being vendor-managed. This model allows teams to keep all telemetry data within their infrastructure, which is especially important for organizations with strict data residency or compliance requirements. Based on CubeAPM documentation and demo deployments, setup typically takes under an hour, and customers avoid the operational burden usually associated with fully self-managed observability stacks .
Splunk AppDynamics supports both SaaS and self-hosted deployments. Enterprises can run AppDynamics on-prem or in their own cloud, which provides flexibility for regulated environments. However, according to AppDynamics documentation and customer usage patterns, self-hosted or hybrid deployments are more complex to operate and maintain, often requiring dedicated infrastructure, upgrades, and administrative overhead, making them better suited to large enterprises with mature operations teams.
New Relic follows a SaaS-only deployment model for core telemetry ingestion, processing, and storage. This makes onboarding fast and reduces infrastructure management for customers. At the same time, all observability data is processed in New Relic-managed environments, which can be a limiting factor for teams that need full control over where data is stored or must comply with strict internal or regulatory data-handling policies.
Pricing for Small, Mid, and Large Teams
To summarize the pricing:
*All pricing comparisons are calculated using standardized Small/Medium/Large team profiles defined in our internal benchmarking sheet, based on fixed log, metrics, trace, and retention assumptions. Actual pricing may vary by usage, region, and plan structure. Please confirm current pricing with each vendor.
| Approx. cost* for teams (size) | Small (~30) | Mid-Sized (~125) | Large (~250) |
| CubeAPM | $2,080 | $7,200 | $15,200 |
| New Relic | $7,896 | $25,990 | $57,970 |
| Splunk AppDynamics | $2,290 | $8,625 | $17,750 |
CubeAPM Costs in Detail
CubeAPM uses ingestion-based pricing at $0.15 per GB. Pricing is tied only to the volume of telemetry ingested, and there are no additional charges for users, features, or data retention. Based on CubeAPM demo environments and sales data, this model makes monthly observability costs predictable as usage grows, especially for teams running high-cardinality metrics, traces, and logs. CubeAPM can save teams up to 60% in observability costs compared to many platforms.
- Small teams (~ 30): $2,080
- Mid-sized teams (~ 125): $7,200
- Large teams (~250): $15,200
New Relic Cost in Detail
New Relic offers a free tier that includes 100 GB per month of data ingestion. Beyond that, usage is priced at $0.40 per GB. In addition, New Relic applies user-based licensing, with per-user pricing ranging from $49 to $349 per user, depending on access level and role. This combination of data-based and user-based pricing lowers initial entry cost but can introduce complexity as more teams and telemetry types are added.
- Small teams: $7,896
- Mid-size teams: $25,990
- Large teams: $57,970
Splunk AppDynamics Cost in Detail
Splunk AppDynamics follows a vCPU-based pricing model. Infrastructure monitoring is priced at $6 per vCPU per month, while combined APM and infrastructure monitoring is priced at $33 per vCPU per month. Enterprise plans extend this to $50 per vCPU per month with additional capabilities. This model aligns observability cost with compute capacity, but can scale quickly in containerized or autoscaling environments where vCPU usage fluctuates.
Here’s what the cost looks like for different teams:
- Small teams: $2,290
- Mid-size teams: $8,625
- Large teams: $17,750
Sampling Strategy
Sampling strategy determines how much telemetry is retained, which data is prioritized, and how much manual tuning is required to balance visibility and cost. All three tools support sampling, but they implement it in materially different ways.
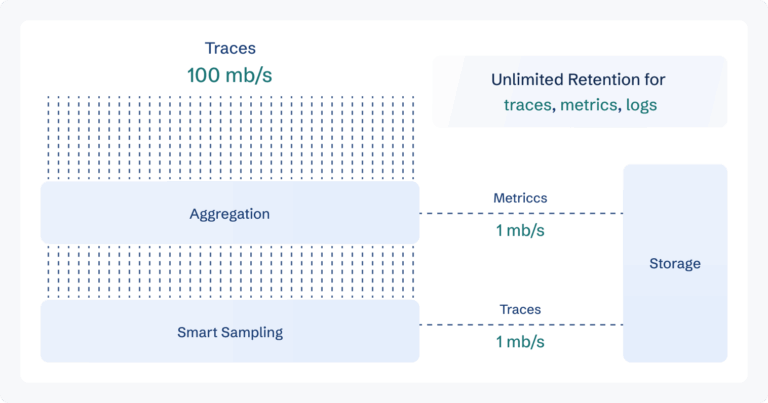
CubeAPM uses smart, fully automated, context-aware sampling. Sampling decisions are made based on signal value such as latency, errors, and request behavior, rather than fixed probabilities. This allows CubeAPM to retain slow and failing traces while aggressively sampling low-value traffic, without requiring engineers to define rules upfront. This approach is documented in CubeAPM’s sampling and architecture material and is designed to reduce MTTR while keeping ingestion predictable
Splunk AppDynamics primarily relies on agent-based sampling with configurable rules. By default, sampling is handled at the agent level, where teams can define thresholds or policies for which transactions to retain. AppDynamics also supports head-based and tail-based sampling through integration with the OpenTelemetry Collector.
New Relic supports adaptive head-based sampling through its native APM agents and tail-based sampling through Infinite Tracing or OpenTelemetry pipelines. Head-based sampling is automatic and agent-driven, while tail-based sampling requires additional setup and, in some cases, higher-tier plans.
Data Retention

CubeAPM provides unlimited data retention at no additional cost. Logs, metrics, traces, and events can be retained long term without retention-based pricing tiers. Because CubeAPM is deployed inside the customer’s own cloud or on-prem environment, retention is constrained only by the customer’s storage policies, not vendor limits. This approach is documented in CubeAPM’s platform and pricing material and is commonly used for long-running investigations, compliance audits, and historical performance analysis.
Splunk AppDynamics applies different retention limits by data type. Based on AppDynamics documentation, events are typically retained for 8 days by default, with options to extend retention to 30, 60, or 90 days depending on configuration and licensing. Metrics retention varies from 4 hours (1-minute resolution) to up to 13 months at 1-hour resolution in SaaS deployment. In an on-prem deployment, metrics can be retained 4 hours at 1-minute resolution, 48 hours at 10-minute resolution, and up to 13 months at 1-hour resolution.
New Relic retains logs and events for 30 days by default, with extended retention of up to 120 days available under the Data Plus tier. Additional retention beyond default limits typically requires paid add-ons or higher subscription levels. New Relic’s documentation highlights that longer retention increases usage and cost, which often leads teams to selectively retain or downsample data over time.
Support Channel and TAT
CubeAPM provides direct support channels via Slack and WhatsApp, with responses typically measured in minutes. Based on CubeAPM’s support model and customer onboarding process, users interact directly with core engineers rather than tiered support queues. This approach is documented in CubeAPM’s customer support and onboarding materials and is designed to reduce MTTR during active incidents by shortening feedback loops.
Splunk AppDynamics offers support primarily through a support portal, with response times determined by issue severity and the customer’s support tier. According to Splunk AppDynamics documentation, critical issues (P1) can receive responses in as little as 30 minutes, while lower-priority issues (P4) may take up to 2 days. Faster response times typically require premium or enterprise support agreements.
New Relic provides support through documentation, community forums, and ticket-based support. Response times vary by subscription level, with standard plans typically offering responses within 2 days, faster responses around 2 hours, and priority support offering responses in approximately 1 hour. New Relic’s support structure is closely tied to account tier and user licensing.
Which tool is best for you? Why brands choose CubeAPM
Splunk AppDynamics is best for large enterprises that need deep business transaction monitoring, dependency mapping, and are comfortable with complex licensing and heavier operational overhead. New Relic is best for teams that want a quick-to-adopt SaaS observability platform and are willing to trade long-term cost predictability and data control for convenience.
CubeAPM is best for teams that want full-stack observability with control, predictability, and modern OpenTelemetry-native architecture, without vendor lock-in.
Benefits of Using CubeAPM
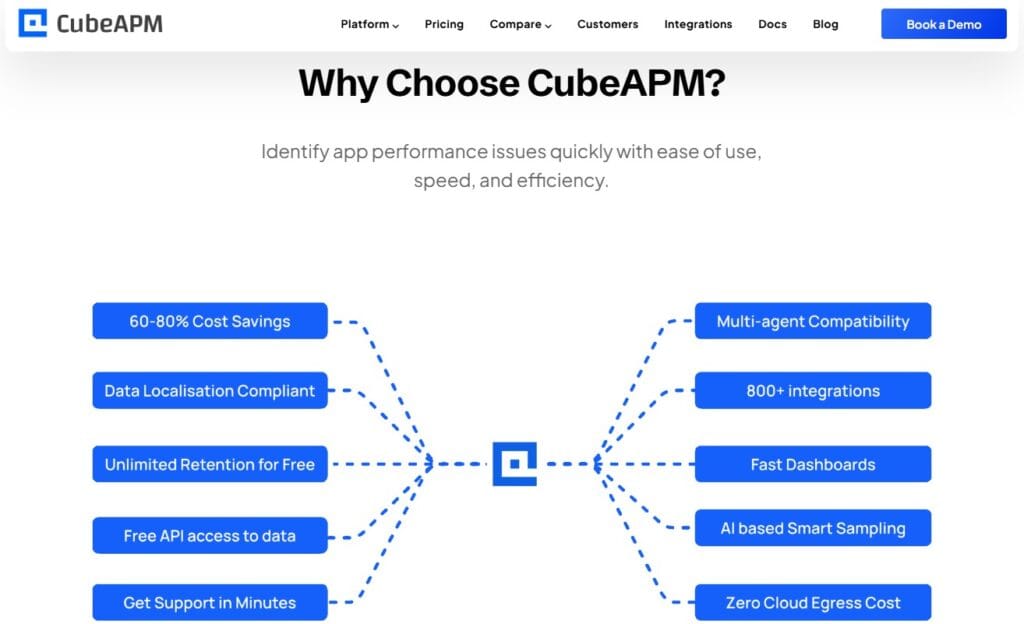
CubeAPM stands out because it aligns with how modern teams actually run production systems: distributed, data-heavy, cost-sensitive, and increasingly compliance-aware. It is especially well suited for startups, fast-scaling SaaS teams, and regulated organizations that want to reduce MTTR while retaining full ownership of their observability data.
- Self-hosted, vendor-managed deployment: CubeAPM runs inside your own cloud or on-prem environment while remaining vendor-managed, giving you data residency and compliance control without operational burden.
- Predictable ingestion-based pricing: Costs are tied to data volume rather than users, features, or tiers, making observability spend easier to forecast as telemetry grows.
- Unlimited data retention: Teams can retain logs, metrics, traces, and events long term for audits, investigations, and historical analysis without retention-based add-ons.
- OpenTelemetry-native by design: CubeAPM works seamlessly with OpenTelemetry and existing agents from New Relic, Datadog, Elastic, and others, reducing migration friction and avoiding re-instrumentation.
- Smart, automated sampling: Context-aware sampling prioritizes slow and failing requests automatically, helping teams reduce noise while preserving high-value signals.
- Direct engineer support: Real-time access to core engineers via Slack or WhatsApp shortens feedback loops and helps teams resolve incidents faster.
This combination is why CubeAPM is often chosen when teams explicitly search for a self-hosted, OpenTelemetry-based alternative that delivers full-stack observability without unpredictable costs.
Splunk AppDynamics vs New Relic vs CubeAPM: Use cases
Choose CubeAPM if:
CubeAPM is designed for teams that want full-stack observability without giving up cost control or data ownership.
- You are a startup or fast-scaling SaaS team that needs full-stack observability early, without committing to complex enterprise licensing. Based on demo and sales data, teams adopt CubeAPM quickly and scale usage predictably as traffic grows.
- You need a self-hosted, OpenTelemetry-based alternative because of strict data residency, compliance, or internal security requirements. CubeAPM runs inside your own cloud or on-prem environment while remaining vendor-managed.
- You want predictable observability costs as telemetry volume increases. Ingestion-based pricing and unlimited retention avoid the cost spikes commonly seen with usage- or user-based models.
- You are running microservices or distributed systems and need end-to-end tracing across services, databases, and infrastructure without re-instrumenting existing agents.
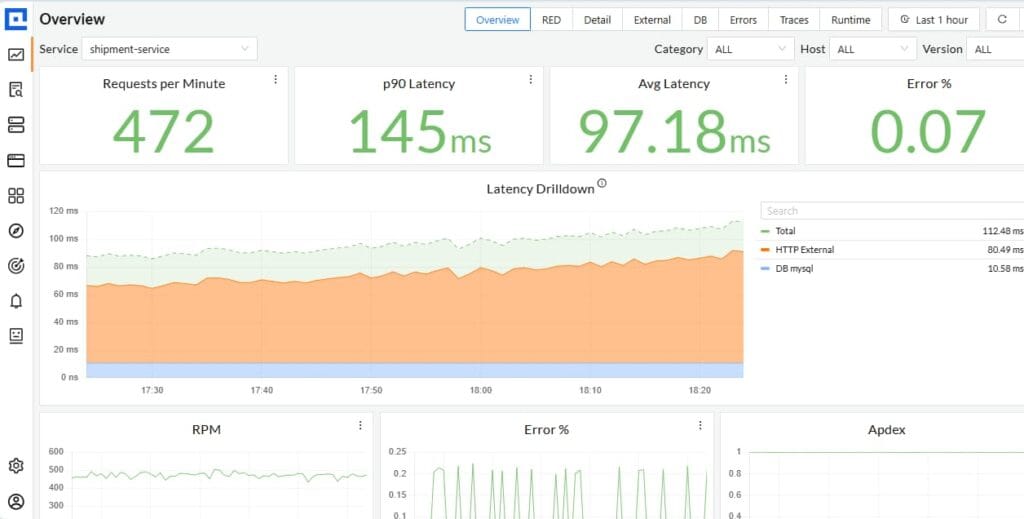
- You want to reduce mean time to resolution (MTTR) using smart, context-aware sampling that automatically preserves slow and failing requests instead of relying on manual rules.
- You need long-term access to observability data for audits, post-incident reviews, or historical analysis, without paying extra for extended retention.
Choose Splunk AppDynamics if:
Splunk AppDynamics is best suited for complex, enterprise environments where deep application visibility is a priority.
- You are a large enterprise running business-critical applications that require detailed business transaction monitoring and dependency mapping.
- You operate hybrid or legacy systems where long-running transactions and application topology visibility are more important than lightweight deployment.
- You already rely heavily on Splunk products and want tight integration between application performance data and broader Splunk observability or security workflows.
- You have dedicated operations teams that can manage agent configuration, infrastructure sizing, and enterprise support processes.
Choose New Relic if:
New Relic works well for teams that prioritize fast onboarding and SaaS convenience.
- You want a SaaS-first observability platform that can be enabled quickly with minimal infrastructure ownership.
- You are a cloud-native team that values integrated dashboards, service maps, and analytics across applications, infrastructure, and frontend monitoring.
- You are comfortable with usage-based pricing and user-based licensing, especially at smaller scale or during early adoption, based on New Relic’s published pricing model.
- You prefer managed infrastructure over self-hosted deployments, even if that means less control over data location and long-term retention.
This use-case framing is why CubeAPM is often selected when teams explicitly search for a lightweight, self-hosted, OpenTelemetry-native observability platform with predictable pricing and strong production support.
How Teams Typically Decide Between AppDynamics, New Relic, and Self-Hosted Observability
Teams evaluating Splunk AppDynamics, New Relic, and self-hosted observability platforms like CubeAPM rarely make the decision in isolation. The choice usually reflects a combination of technical requirements, financial constraints, and risk considerations that go beyond feature comparisons.
Who is involved in the decision
Observability decisions are typically cross-functional.
- Engineering teams lead the evaluation, focusing on ease of instrumentation, signal correlation, and impact on MTTR.
- Platform or SRE teams assess deployment complexity, scalability, and operational overhead.
- Finance teams get involved once usage-based or capacity-based pricing enters the discussion, especially to understand long-term cost exposure.
- Security and compliance teams play a key role when data residency, access controls, or regulatory requirements apply, which often influences whether SaaS-only or self-hosted models are acceptable.
What questions block decisions
Several recurring questions slow down decision-making.
- Teams often struggle to forecast how costs will scale as telemetry volume grows.
- Another common blocker is uncertainty around data control, including where observability data is stored and who can access it.
- Migration effort is also a concern, especially when switching from proprietary agents to OpenTelemetry or consolidating multiple tools into one platform.
- Support responsiveness and incident-time reliability are additional factors that teams want clarity on before committing.
Why comparisons alone are not enough
Feature-by-feature comparisons help narrow options, but they rarely capture how a tool behaves under real production pressure. Pricing models, sampling behavior, retention limits, and deployment constraints only become fully visible after sustained use.
This is why many teams complement comparisons with demos, proofs of concept, and cost modeling based on their own telemetry patterns. In practice, decisions often come down to architectural fit and long-term operational impact, not just which platform checks the most boxes on paper.
Conclusion
Splunk AppDynamics and New Relic are powerful, but they introduce trade-offs around complex licensing, SaaS-only data control, and costs that grow unpredictably as telemetry scales. These issues become clearer in modern, distributed environments.
CubeAPM addresses these gaps with self-hosted, vendor-managed deployment, OpenTelemetry-native instrumentation, predictable ingestion-based pricing, smart sampling, and unlimited data retention. Teams get full-stack MELT visibility while keeping data inside their own infrastructure and reducing MTTR.
For teams that want control, clarity, and scale without surprises, CubeAPM is the better observability platform. Book a CubeAPM demo to see it in action.
Disclaimer: The information in this article reflects the latest details available at the time of publication and may change as technologies and products evolve.
FAQs
1. Which tool is easier to migrate to from an existing APM setup?
CubeAPM is generally easier to migrate to because it supports OpenTelemetry and can ingest data from existing New Relic, Datadog, Elastic, and Prometheus agents. This reduces the need for re-instrumentation. Splunk AppDynamics and New Relic often require deeper alignment with their native agents to unlock full functionality.
2. Which platform works best for regulated industries like fintech or healthcare?
CubeAPM is better suited for regulated environments because it runs inside the customer’s own cloud or on-prem infrastructure, supporting strict data residency and compliance needs. Splunk AppDynamics can also be deployed on-prem but requires heavier operational effort, while New Relic’s SaaS-only model can be limiting for strict regulatory controls.
3. How do these tools compare for long-term historical analysis?
CubeAPM supports unlimited data retention, making it suitable for long-term performance analysis, audits, and post-incident reviews. AppDynamics and New Relic impose retention limits by data type or tier, which often requires teams to downsample or discard older data.
4. Which tool is better for modern microservices and OpenTelemetry adoption?
CubeAPM and New Relic both support OpenTelemetry, but CubeAPM is designed as OpenTelemetry-native and allows teams to standardize on open instrumentation without vendor lock-in. AppDynamics supports OpenTelemetry through collectors or hybrid setups, which can add complexity in large microservices environments.
5. Which option offers more predictable observability costs at scale?
CubeAPM offers more predictable and simple pricing because costs are tied to data ingestion rather than users, features, or multiple pricing tiers. AppDynamics pricing scales with vCPU usage, and New Relic combines data-based and user-based pricing, which can make long-term costs harder to forecast as usage grows.


