Pyroscope is an open-source continuous profiling tool for identifying CPU and memory performance issues with low overhead and Grafana integration, but it has a steep learning curve, requires profiling expertise, and needs ongoing operational management.
CubeAPM is the best alternative to Pyroscope, offering continuous profiling as part of a full-stack OpenTelemetry observability platform with simpler setup and less operational and expertise overhead.
In this article, we’ll explore the top Pyroscope alternatives, comparing features, pricing, deployment options, and suitability to help you choose the best fit for your observability needs.
Top 7 Pyroscope Alternatives
- CubeAPM
- Datadog
- New Relic
- Dynatrace
- Sentry
- LogicMonitor
- Zenoss
Why Look for Pyroscope Alternatives?
1. Operational Overhead
Running Pyroscope in production typically requires teams to deploy, scale, and maintain separate profiling infrastructure. For smaller teams or fast-moving environments, this added operational responsibility can slow adoption and increase maintenance effort.
2. Steep Learning Curve
Interpreting flame graphs and continuous profiling data effectively often requires prior profiling experience. Teams without deep performance engineering expertise may struggle to extract actionable insights quickly.
3. Complex Setup and Infrastructure Overhead
Deploying Pyroscope can require language-specific configuration or elevated permissions for eBPF integration. Its agent–server architecture also means additional setup overhead and supporting infrastructure are needed for optimal performance.
Criteria for Suggesting Pyroscope Alternatives
When evaluating alternatives to Pyroscope, especially for production-grade APM and observability needs, we considered the following:
1. Feature Breadth(OTEL Support, Full-Stack Observability)
Full-stack monitoring support covering APM, RUM, logs, infrastructure, errors, synthetics, and optionally profiling.
2. Integration Compatibility
Seamless interoperability with OpenTelemetry, Prometheus, and existing monitoring agents.
3. Cost Efficiency
Transparent pricing, fair retention policies, and sampling strategies that reduce unnecessary data collection costs.
4. Support & Response Times
Availability of responsive, developer-level support channels beyond standard email tickets.
Pyroscope Overview
Known For
Pyroscope is primarily known for continuous profiling, offering developers low-overhead, code-level insights into CPU, memory, I/O, goroutine, and lock behaviors over time. It’s used both proactively—to optimize resource usage—and reactively—to diagnose latency or performance issues with precision.
Standout Features
- Multi-profile types: Includes CPU time, wall time, memory (allocations and heap), goroutines, mutex/block profiling, exceptions, and more.
- Intuitive UI: Simplifies navigating profiling data, enabling proactive and reactive performance investigations.
- Language-agnostic: Open-source back end, supporting SDKs and instrumentation via eBPF or Alloy collector for flexible data ingestion and efficient storage.
- Flame graphs and trends over time: Enables identification of hotspots—down to the function or line of code—and capacity to “zoom in” or span long-term profiling trends.
Key Features
- Comprehensive Profiling Types: CPU, memory, goroutines, mutex, block, lock profiling, exceptions—all depending on instrumentation method.
- Flexible Instrumentation: Support for auto-instrumentation via Grafana Alloy (eBPF, Go, Java) and manual SDKs across various languages.
- Efficient Data Storage & UI: Open-source engine with efficient compression, low overhead, and flamegraph visualization for deep performance analysis.
- Observability Integration: Can be correlated with logs and traces to enhance investigation workflows.
Pros
- Minimal performance overhead, making production use feasible.
- Open-source and easy to adopt, both self-hosted and via Grafana Cloud.
- Detailed, long-term profiling data with the ability to “zoom” across time ranges and deep-dive into specific events.
- User-friendly UI with flame graphs and clear performance trends.
Cons
- Operational overhead, since it is self-hosted
- Requires deep expertise in profiling
- Steep learning curve
Best For
Teams that need deep code-level performance insights in production with low overhead, especially for optimizing CPU/memory or diagnosing bottlenecks. Ideal as part of a developer-centric performance workflow or as a complement to broader observability platforms.
Pricing & Customer Reviews
- Open-source self-hosted — Free under AGPL license.
- Grafana Cloud (Profiles) — Free tier available; paid tiers based on ingestion volume and retention.
- Rating: No Public Rating Information
Top 7 Pyroscope Alternatives
1. CubeAPM

Known For
CubeAPM is known for delivering full-stack observability in a single platform — covering APM, distributed tracing, log monitoring, infrastructure monitoring, database monitoring, synthetic monitoring, RUM, and error tracking. It is designed for cost efficiency, smart sampling, and compliance-ready on-prem hosting, making it ideal for organizations seeking to consolidate observability into one solution.
Key Features
- Full-Stack Observability: Monitors the complete MELT stack (Metrics, Events, Logs, Traces) with integrated APM, logs, infra, database, RUM, synthetics, and error tracking.
- Smart Sampling: Uses latency- and error-aware smart sampling to retain high-value traces at much higher efficiency, reducing ingestion and storage costs by 60–80% compared to standard probabilistic methods.
- Deployment Flexibility: Supports both SaaS and on-prem hosting, ensuring data residency, security, and compliance with localization laws.
- Broad Integration Support: Native compatibility with OpenTelemetry, Prometheus, Datadog, and New Relic agents for easy migration.
- Cost Transparency: Flat, predictable pricing per GB for ingestion and per host, with significantly lower rates than major incumbents.
Standout Features
- On-premise hosting to store all telemetry data in the customer’s own cloud.
- Real-time support via Slack/WhatsApp with core developers, offering minute-level response times.
- Zero hidden fees for retention, with unlimited data retention for self-hosted deployments.
Pros
- Comprehensive MELT observability in a single platform
- Significant cost savings (60–80%) over legacy APM tools
- Compliance-friendly on-prem hosting
- Highly compatible with existing agents and open standards
- Fast, developer-direct support channels
Cons
- Not suited for teams looking for off-prem solutions
- Strictly an observability platform and does not support cloud security management
Best For
Organizations wanting a cost-effective, all-in-one observability platform that supports both cloud and on-prem deployment, with strong OpenTelemetry integration and predictable pricing.
Pricing & Customer Reviews
- Pricing: $0.15/GB data ingestion
- G2 Rating: 4.7/5
CubeAPM vs Pyroscope
While Pyroscope focuses solely on continuous profiling, CubeAPM delivers full-stack observability—APM, RUM, logs, infrastructure, synthetics, and error tracking—in one platform. It also supports on-prem hosting, smart sampling for major cost savings, and broader compliance options, making it a more comprehensive solution for teams wanting all observability pillars under a single roof.
2. Datadog
Known For
Datadog is a leading cloud-based observability and security platform known for consolidating metrics, logs, traces, RUM, synthetics, and infrastructure monitoring into a single SaaS solution. It’s widely adopted by enterprises for its breadth of integrations and scalability in cloud-native environments.
Key Features
- Extensive Integrations: Over +900 prebuilt connectors for cloud providers, databases, orchestration tools, and programming languages.
- Full MELT Coverage: Offers metrics, events, logs, traces, RUM, synthetics, error tracking, network monitoring, and security features.
- Custom Dashboards & Visualization: Real-time, customizable dashboards with drag-and-drop widgets and multi-source correlation.
- AI-Driven Insights: Anomaly detection, forecasting, and alerting powered by machine learning.
- Cloud-Native Scalability: Fully SaaS-hosted with the ability to handle massive telemetry volumes globally.
Standout Features
- Unified SaaS observability with strong visualization tools.
- Marketplace for third-party apps and integrations.
- Auto-instrumentation for common frameworks and runtimes.
Pros
- Comprehensive monitoring across infrastructure, applications, and security.
- Large ecosystem and community support.
- Strong analytics and alerting capabilities.
Cons
- High cost at scale
- Complex pricing — separate charges for each feature category and data type
- Steep learning curve for new users
Best For
Large enterprises and DevOps teams that require a fully managed, integration-rich SaaS platform capable of monitoring complex, multi-cloud environments.
Pricing & Customer Reviews
- Infrastructure Monitoring (Pro Plan): $15/host/month
- APM (Pro Plan): $35/host/month
- Logs: $0.10/per ingested GB/month
- Rating: 4.4/5 on G2. Users praise its depth of features and dashboards, but frequently cite cost and billing complexity as pain points.
Datadog vs Pyroscope
Datadog provides a full observability suite with built-in profiling, metrics, traces, and logs in one hosted platform, making it easy to correlate performance data across signals without managing infrastructure. Pyroscope, by contrast, is a standalone open-source profiler best for deep, continuous profiling but requires setup and expertise, and lacks the broader integrated observability context that Datadog offers.
3. New Relic
Known For
New Relic is a cloud-based observability platform recognized for combining APM, infrastructure monitoring, logs, browser monitoring, synthetics, and error tracking in one product. It’s widely adopted for its user-friendly dashboards and long-standing presence in the performance monitoring market.
Key Features
- Unified Telemetry Platform: Collects and correlates metrics, events, logs, and traces from applications, infrastructure, and end-user devices.
- Full-Stack Monitoring: Covers APM, RUM, synthetics, mobile monitoring, serverless monitoring, and database performance.
- Programmable Dashboards: Customizable dashboards with advanced querying (NRQL) and visualization capabilities.
- Integrated Error & Incident Tracking: Real-time error inbox and anomaly detection for faster troubleshooting.
- OpenTelemetry Compatibility: Native support for OTEL, enabling migration and integration with other telemetry sources.
Standout Features
- Single UI for full observability data streams.
- Long-standing market presence with robust documentation and learning resources.
- NRQL for advanced, query-based analysis and custom KPIs.
Pros
- Comprehensive full-stack coverage.
- Easy-to-use interface and extensive learning materials.
- Good out-of-the-box dashboards for quick setup.
Cons
- High per-user licensing costs — $349/user/month in enterprise tiers.
- Pay-per-GB data ingestion pricing can become expensive at scale.
Best For
Enterprises seeking a mature, full-stack observability platform with a strong focus on ease of use, educational resources, and deep APM capabilities.
Pricing & Customer Reviews
- Free: 100GB/month ingested
- Data ingested: $0.40/GB beyond the free 100 GB
- Full Platform User: $418.80/user(for monthly pay as you go)
- Rating: 4.4/5 on G2. Users appreciate its all-in-one nature and ease of use, but mention cost escalation and limited data localization options as key drawbacks.
New Relic vs Pyroscope
New Relic offers a comprehensive hosted observability platform with integrated tracing, metrics, logs, and profiling alongside analytics and AI-assisted insights, making it easier to diagnose issues across the stack. Pyroscope focuses on continuous profiling, requiring separate setup and expertise, and doesn’t provide the same breadth of integrated telemetry as New Relic.
4. Dynatrace
Known For
Dynatrace is an AI-powered observability platform known for its deep application monitoring, infrastructure visibility, and automated root cause analysis. It leverages a proprietary OneAgent for auto-discovery and full-stack telemetry collection across cloud, on-prem, and hybrid environments.
Key Features
- AI-Driven Observability: Uses its Davis AI engine for anomaly detection, predictive analytics, and automatic root cause determination.
- Full-Stack Coverage: Includes APM, infrastructure monitoring, RUM, synthetics, log management, database monitoring, and application security.
- Auto-Instrumentation: The OneAgent automatically discovers applications, services, dependencies, and containers without manual configuration.
- Cloud & Container Visibility: Deep Kubernetes, OpenShift, and hybrid cloud monitoring with automatic topology mapping.
- OpenTelemetry Support: Ingests OTEL data for interoperability with other monitoring solutions.
Standout Features
- AI-powered Davis engine for proactive issue detection.
- Smartscape topology maps for real-time dependency visualization.
- End-to-end coverage from user experience to infrastructure.
Pros
- Strong automation with minimal manual setup.
- Comprehensive coverage across MELT, security, and business analytics.
- Scales well for large enterprise environments.
Cons
- Premium pricing makes it expensive for smaller teams.
- Some advanced features require steep learning and configuration effort.
Best For
Large enterprises and complex IT environments that value AI-assisted troubleshooting, automated discovery, and complete visibility from frontend to backend.
Pricing & Customer Reviews
- Full-Stack Monitoring: $58 /month/8 GiB host
- Infra Monitoring: $29/month/8 GiB host
- Rating: 4.5/5 on G2. Users praise its AI insights, automation, and scalability, but note the high cost and learning curve.
Dynatrace vs Pyroscope
Dynatrace delivers an AI-driven, full-stack observability and automation platform with built-in profiling, metrics, traces, and logs, all managed for you with minimal setup. Pyroscope, in contrast, is a standalone continuous profiling tool that requires self-management and profiling expertise and does not offer the same breadth of automated insights or integrated telemetry.
5. Sentry
Known For
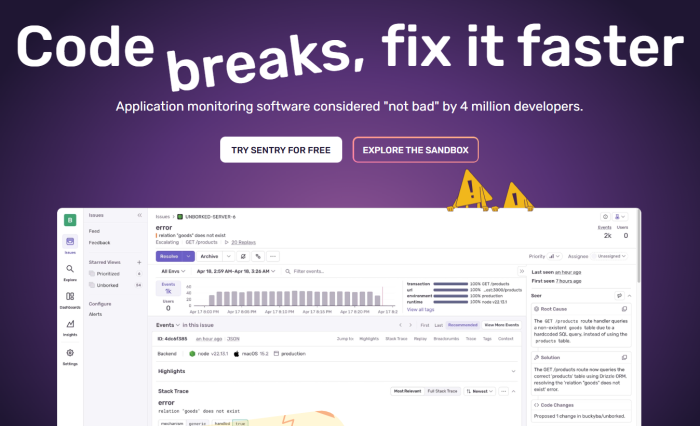
Sentry is widely known for error and performance monitoring, helping developers identify, triage, and resolve application issues quickly. It provides real-time crash reporting, performance tracing, and diagnostics for frontend, backend, and mobile applications.
Key Features
- Real-Time Error Tracking: Captures and aggregates application errors with stack traces, breadcrumbs, and contextual metadata.
- Performance Monitoring: Transaction tracing to measure latency, slow endpoints, and frontend performance bottlenecks.
- Release Tracking & Regression Alerts: Monitors deployments for new errors or regressions, enabling rapid rollback or fixes.
- Wide Language & Framework Support: SDKs for JavaScript, Python, Java, PHP, .NET, Ruby, Go, mobile platforms, and more.
- Issue Management & Integrations: Integrates with popular developer tools like GitHub, Jira, Slack, and CI/CD platforms.
Standout Features
- Strong focus on developer-friendly error reporting and debugging.
- Full visibility into the impact of errors on user experience.
- Release health monitoring for mobile and web applications.
Pros
- Easy setup with quick value delivery for error tracking.
- Comprehensive SDK coverage for multiple platforms.
- Free tier suitable for smaller projects or startups.
Cons
- Limited infrastructure and log monitoring capabilities.
- Not a full MELT observability platform.
- It can become costly at high event volumes.
Best For
Development teams prioritizing application error tracking and performance diagnostics with strong integrations into their existing development workflow.
Pricing & Customer Reviews
- Free tier: For solo devs
- Team: $26/month, unlimited users, third-party integrations, metric alerts and more
- Business: $80/month, insights (90-day lookback), Custom dashboards, Advanced quota management
- Enterprise: Custom-based pricing
- Rating: 4.5/5 on G2. Users appreciate its ease of use, actionable insights, and developer-focused interface, while noting the high costs as usage scales.
Sentry vs Pyroscope
Sentry is best suited for teams focused on application error tracking and performance monitoring, offering a hosted platform with traces and developer-friendly workflows. Pyroscope, on the other hand, specializes in continuous profiling for CPU and memory analysis and typically requires more hands-on setup and profiling expertise.
6. LogicMonitor
Known For
LogicMonitor is a cloud-based infrastructure monitoring platform designed to give IT and DevOps teams unified visibility into networks, servers, storage, applications, and cloud environments. It is known for automated device discovery and agentless data collection.
Key Features
- Unified Infrastructure Monitoring: Monitors on-prem, cloud, and hybrid infrastructure — including networks, servers, databases, and containers.
- Automated Device Discovery: Discovers and adds devices automatically, reducing onboarding time.
- Cloud & Hybrid Visibility: Native integrations for AWS, Azure, and GCP with prebuilt dashboards.
- Performance Forecasting: Predictive analytics to anticipate capacity and performance issues.
- Integration Ecosystem: Connects with ITSM, alerting, and collaboration tools for streamlined workflows.
Standout Features
- Agentless data collection minimizes resource impact.
- Strong hybrid IT coverage for complex enterprise networks.
- Preconfigured templates for rapid deployment.
Pros
- Broad coverage of infrastructure and cloud services.
- Automated onboarding reduces manual configuration.
- Scalable for large enterprise deployments.
Cons
- Steep learning curve
- Users find the poor UI of LogicMonitor challenging
- Concerns over missing features, like AVD is time time-consuming and frustrating
Best For
Enterprises with extensive hybrid infrastructure needing automated discovery, cloud integrations, and scalable infrastructure monitoring.
Pricing & Customer Reviews
- Essentials: $16 per hybrid unit*
- Advanced: $27 per hybrid unit*
- Signature + Edwin AI: $53 per hybrid unit*
- Rating: 4.5/5 on G2. Users value its infrastructure depth and automation, but note the cost, UI complexity, and limited cloud-native monitoring.
LogicMonitor vs Pyroscope
LogicMonitor is an infrastructure monitoring platform that helps teams track metrics and health across networks, servers, and cloud resources with automated alerting and dashboards. Pyroscope specializes in continuous profiling to analyze CPU and memory performance at the code level and generally requires more hands-on setup and profiling expertise.
7. Zenoss

Known For
Zenoss is an IT infrastructure monitoring and analytics platform designed to provide unified visibility into hybrid IT environments. It focuses on real-time service modeling, dependency mapping, and root cause analysis across on-premises, cloud, and virtualized infrastructure.
Key Features
- Hybrid IT Monitoring: Covers servers, storage, networks, containers, and cloud services in a single platform.
- Service Impact & Dependency Mapping: Dynamic topology mapping to visualize relationships and dependencies between IT components.
- Predictive Analytics: Detects anomalies and predicts potential service disruptions before they impact end users.
- Flexible Deployment Options: Available as SaaS, on-premises, or hybrid deployments.
- Integration with ITSM & Orchestration Tools: Connects to popular ITSM platforms and orchestration tools for automated incident workflows.
Standout Features
- Real-time service modelling to understand the impact of outages.
- Event correlation to reduce alert noise.
- Strong hybrid cloud visibility with multi-platform support.
Pros
- Unified view of complex, hybrid infrastructures.
- Advanced service dependency mapping.
- Multiple deployment options for flexibility.
Cons
- Steep learning curve for configuration and customization.
- Overwhelming UI for new users
Best For
IT operations teams managing complex hybrid environments that require advanced dependency mapping, service modelling, and predictive analytics.
Pricing & Customer Reviews
- Pricing: Not disclosed, custom-based pricing
- G2 Rating: 3.9/5 on G2. Users appreciate its depth in service modelling but note the complexity and high licensing costs.
Zenoss vs Pyroscope
Zenoss is an infrastructure and IT operations monitoring platform that provides unified visibility into networks, systems, and services with alerting and analytics for IT teams. Pyroscope focuses on continuous profiling to analyze application CPU and memory behavior and typically involves hands-on setup and profiling expertise.
Conclusion
Pyroscope remains a powerful choice for continuous profiling, offering developers deep insights into CPU, memory, and resource usage with minimal overhead. However, its complexity and steep learning curve mean organisations often need complementary tools.
The seven alternatives covered — CubeAPM, Datadog, New Relic, Dynatrace, Sentry, LogicMonitor, and Zenoss — each bring their own strengths. CubeAPM stands out for delivering a cost-efficient, all-in-one MELT observability solution with on-prem options and smart sampling. Datadog and New Relic offer expansive SaaS-based feature sets but at higher costs. Dynatrace delivers advanced AI-driven analytics for enterprise-scale deployments, while Sentry excels in developer-centric error tracking. LogicMonitor and Zenoss provide strong infrastructure visibility for hybrid IT environments.
Choosing the right alternative depends on your priorities — whether it’s full-stack coverage, cost optimization, AI-powered insights, developer-focused monitoring, or hybrid infrastructure management.
Disclaimer: The information in this article reflects the latest details available at the time of publication and may change as technologies and products evolve
FAQs
1. What are the best Pyroscope alternatives?
Leading alternatives include CubeAPM. It offers broader observability features beyond profiling, making it better suited for full-stack monitoring needs.
2. Why do companies look for Pyroscope alternatives?
While Pyroscope excels in continuous profiling, it lacks native APM, RUM, logging, infrastructure monitoring, and synthetic testing. Many teams prefer tools that combine profiling with complete MELT observability in one platform.
3. Which Pyroscope alternative is the most cost-effective?
CubeAPM is often considered the most cost-effective due to its flat, transparent pricing, smart sampling to minimize ingestion volume, and free unlimited retention for self-hosted deployments.
4. Do Pyroscope alternatives offer on-premises deployment?
Yes — solutions like CubeAPM offer on-prem deployment, allowing organizations to comply with strict data localization and security requirements.
5. Can I migrate easily from Pyroscope to an alternative?
Yes, most major alternatives support OpenTelemetry and other open standards, enabling straightforward migration without rewriting your instrumentation.


