










New Relic’s per-seat pricing creates a scaling problem: as teams grow, so does the monitoring bill even when data volumes stay flat. A 20-person engineering team pays $980 to $1,980/month in seat costs alone before a single byte of telemetry is ingested. OpenObserve positions itself as a lightweight alternative built on Rust and Apache Parquet, designed for teams that want low storage costs and simple deployment without SaaS billing complexity.
Both platforms handle logs, metrics, and traces, but their architecture, pricing, and deployment models differ fundamentally. New Relic is a mature, cloud-only SaaS with 30+ integrations and full-platform user tiers. OpenObserve is a newer, Apache-licensed tool optimized for cost efficiency and self-hosting, with a smaller ecosystem and less production documentation.
This guide compares OpenObserve and New Relic across pricing, deployment model, OpenTelemetry support, APM signal depth, and migration effort. Cost scenarios reflect public pricing as of early 2026. CubeAPM is included in the final comparison section as a third option for teams evaluating both platforms.
| OpenObserve | New Relic | |
|---|---|---|
| Pricing model | Free self-hosted; Cloud starts $9/mo for 200 GB | Free 100 GB/mo; Standard $0.40/GB + $49–$99/user/mo |
| Deployment | Self-hosted or cloud | SaaS only |
| OTel native | Yes | Partial (agents prioritized) |
| APM depth | Logs, metrics, traces (basic dashboards) | Full APM: traces, RUM, synthetics, errors, AI monitoring |
| Best for | Cost-conscious teams, simple log/metric setups | Enterprises needing managed APM with broad integrations |
OpenObserve Overview
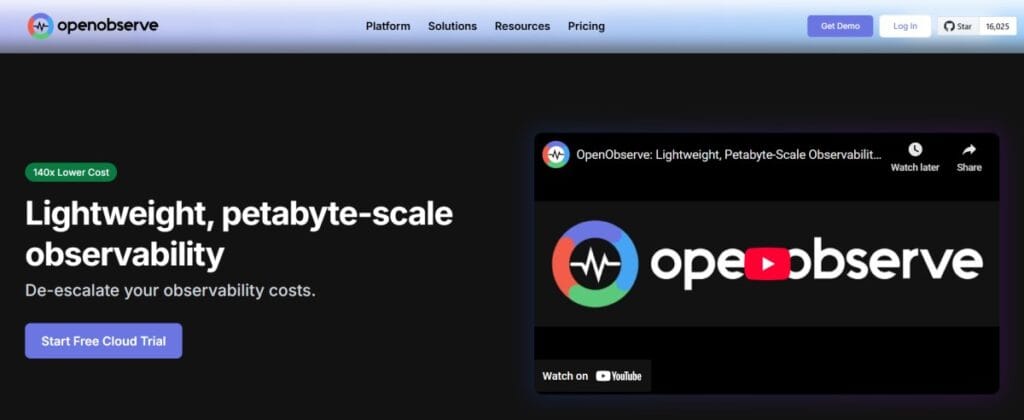
OpenObserve is an observability platform built with Rust and Apache Parquet designed to reduce storage costs by up to 140x compared to Elasticsearch. It supports logs, metrics, traces, and dashboards, with native OpenTelemetry compatibility and deployment options via Docker, Kubernetes, or a cloud service.
The platform’s storage efficiency comes from columnar compression (Parquet), which works well for analytical queries but limits real-time indexing compared to traditional log platforms. OpenObserve targets teams that want predictable costs, self-hosted control, and a lighter operational footprint than ELK or Splunk.
Pricing
OpenObserve offers a free self-hosted version with 50GB/day data ingestion. The cloud service is priced at $0.50/GB of data ingested plus 0.01/GB queried.
Compared to New Relic’s pricing, which charges $0.40/GB plus $49–$99 per full-platform user, OpenObserve removes the seat tax entirely.
For a team ingesting 10 TB/month with 15 users, OpenObserve Cloud costs $5,000/month. New Relic Standard costs $4,750 to $5,500/month (15 users at $49–$99 each, plus $4,000 for 10 TB after the free 100 GB).
Pricing based on publicly available information as of April 2026. Verify current rates at each vendor’s pricing page.
Pros
- 140x storage efficiency vs. Elasticsearch due to Parquet compression
- No per-user fees; flat ingestion-based pricing
- Self-hosted option with full data control
- Native OpenTelemetry support from day one
- Low memory footprint; runs on minimal infrastructure
Cons
- Limited APM features: no RUM, no synthetics, basic error tracking
- Smaller community and fewer integrations than established platforms
- Query performance degrades with high-cardinality fields
- Less documentation for production edge cases
- No built-in anomaly detection or AI-assisted troubleshooting
New Relic Overview

New Relic is a full-stack observability platform covering APM, infrastructure monitoring, logs, browser monitoring (RUM), synthetics, and AI monitoring. It processes over 100 petabytes of telemetry daily and supports 30+ programming languages, 500+ integrations, and native Kubernetes monitoring.
New Relic operates as a cloud-only SaaS. Teams send telemetry to New Relic’s infrastructure, where it is stored, indexed, and analyzed using NRQL (New Relic Query Language). The platform includes built-in dashboards, anomaly detection, and incident intelligence powered by its AIOps layer.
Pricing
New Relic offers two pricing models: Data Plus with user seats, or Compute Capacity Units (CCU) with no user limits.
Under Data Plus, the first 100 GB/month is free. Beyond that, data costs $0.40/GB. User seats are $49/month for Core users (basic dashboards), $99/month for Full Platform users (full APM access), and $349/month for users with Compute add-ons (AI monitoring, extended retention). A 20-person team ingesting 10 TB/month pays $980–$1,980 for seats plus $4,000 for data, totaling around $5,000–$6000/month.
Under CCU pricing, teams pay for compute capacity (processing power) without seat limits. Pricing starts around $0.25/CCU, but the cost per GB varies based on query complexity, retention, and feature usage. Reddit users have documented bills jumping from $900 to $8,000 in a single month after traffic spikes changed CCU consumption.
Understand more about New Relic pricing using our New Relic pricing calculator
Pricing based on publicly available information as of early 2026. Enterprise contracts may differ.
Pros
- Full APM depth: distributed tracing, RUM, synthetics, error tracking, AI monitoring
- Mature ecosystem with 500+ integrations and extensive documentation
- Built-in anomaly detection and AIOps-driven incident correlation
- Native support for 30+ languages and frameworks
- Strong compliance certifications (SOC 2, HIPAA, FedRAMP)
Cons
- Per-seat pricing compounds as teams grow
- CCU pricing is opaque and unpredictable
- Cloud-only; no self-hosted option for data residency
- NRQL query language creates lock-in
- Egress fees apply if you send telemetry out of New Relic’s infrastructure
Feature by Feature Comparison
APM and Distributed Tracing
New Relic provides full distributed tracing with automatic instrumentation for 30+ languages, span-level detail, trace sampling controls, and service maps showing dependency relationships. Traces link directly to logs, infrastructure metrics, and error events. New Relic’s APM UI includes automatic baselining, latency percentiles (p50, p95, p99), and throughput tracking per endpoint.
OpenObserve supports traces via OpenTelemetry and displays them in basic flamegraph views. It lacks automatic instrumentation; teams must configure OTel collectors and agents manually. There is no built-in service map, no automatic error correlation, and no native support for real user monitoring or synthetics. Tracing is functional but requires more manual setup than New Relic.
Verdict: New Relic leads significantly. Its APM depth and automatic instrumentation save engineering time.
Log Management
OpenObserve’s log ingestion uses Parquet storage, compressing data by 10–140x compared to Elasticsearch. Logs are searchable via SQL-like queries, but indexing is slower than platforms built on inverted indexes. OpenObserve supports structured and unstructured logs, automatic schema detection, and log correlation with traces using trace IDs.
New Relic Logs integrates tightly with APM, infrastructure, and Kubernetes data. Logs are indexed in real time and searchable via NRQL. New Relic automatically parses JSON, syslog, and common formats, correlates logs with traces, and surfaces logs directly in APM transaction views. Log queries run fast, but high-volume log ingestion drives up costs quickly.
Verdict: OpenObserve wins on storage cost; New Relic wins on query speed and integration depth.
Infrastructure Monitoring
New Relic Infrastructure Monitoring covers hosts, containers, Kubernetes clusters, and cloud services (AWS, Azure, GCP). It includes pre-built dashboards for CPU, memory, disk, network, and integrations for 100+ infrastructure components (databases, message queues, load balancers). Infrastructure data links directly to APM traces and logs.
OpenObserve tracks infrastructure metrics via Prometheus exporters or OpenTelemetry. It visualizes metrics in Grafana-style dashboards but lacks pre-built integrations. Teams must configure exporters manually and build dashboards from scratch. There is no automatic correlation between infrastructure metrics and APM traces.
Verdict: New Relic provides far more infrastructure depth out of the box.
Alerting
New Relic Alerts supports multi-condition alert policies, anomaly detection, incident intelligence (grouping related alerts), and integrations with PagerDuty, Slack, Jira, and 20+ incident management tools. Alerts can fire based on NRQL queries, allowing complex conditions across logs, metrics, traces, and infrastructure data.
OpenObserve Alerts are threshold-based only. You set alerts on metric or log queries, but there is no anomaly detection, no alert grouping, and no incident intelligence. Integrations are limited to webhooks and email.
Verdict: New Relic’s alerting is far more mature and flexible.
OpenTelemetry Support
OpenObserve is OpenTelemetry native. It ingests OTel logs, metrics, and traces without transformation. There are no proprietary agents; all instrumentation uses OTel SDKs and collectors.
New Relic supports OpenTelemetry but prioritizes its own proprietary agents for ease of use. OTel data is ingested via the New Relic OTLP endpoint, but some APM features (automatic instrumentation, error fingerprinting, transaction naming) work better with New Relic agents. New Relic’s documentation acknowledges that OTel instrumentation requires more manual configuration than native agents.
Verdict: OpenObserve is fully OTel native; New Relic supports OTel but with caveats.
Deployment Model
OpenObserve can be self-hosted via Docker, Kubernetes Helm chart, or binary. Teams control where data is stored and processed. The cloud version is managed SaaS but still stores data in object storage (S3, GCS, MinIO) rather than proprietary infrastructure.
New Relic is cloud-only. All telemetry is sent to New Relic’s SaaS infrastructure. There is no self-hosted option. For teams with data residency requirements (GDPR, HIPAA, data sovereignty), this is a non-starter.
Verdict: OpenObserve offers full deployment flexibility; New Relic does not.
Pricing Comparison
Below is a cost model for three team sizes using realistic ingestion volumes. Pricing reflects public rate cards as of April 2026.
| Team size | Data/month | OpenObserve Cloud | New Relic Standard (Data Plus) |
|---|---|---|---|
| Small (5 users) | 1 TB | $500/mo | ~$600–$900/mo (5 users + 900 GB at $0.40/GB) |
| Mid (15 users) | 10 TB | $5,000/mo | ~$4,750–$6,500/mo (15 users + 9.9 TB at $0.40/GB) |
| Large (50 users) | 50 TB | $25,000/mo | ~$22,500–$25,000/mo (50 users + 49.9 TB at $0.40/GB) |
This estimate models data ingestion only. New Relic add-ons (synthetics, extended retention, AI monitoring) increase costs further.
OpenObserve’s cost advantage is extreme at scale. However, New Relic includes APM, RUM, synthetics, error tracking, and infrastructure monitoring in those figures. OpenObserve provides logs, metrics, and basic traces only. For teams that need full observability, the comparison is not apples-to-apples.
Who Should Choose Each
Choose OpenObserve if:
- Your team needs predictable, low-cost log and metric storage
- You want full data control via self-hosting
- You already use OpenTelemetry and prefer vendor-neutral tooling
- Your observability needs are logs and metrics first, APM second
- You have the engineering bandwidth to configure collectors and build dashboards
Choose New Relic if:
- You need full-stack APM with RUM, synthetics, and error tracking
- You want a managed SaaS with zero infrastructure overhead
- Your team lacks time to configure OTel collectors and build dashboards
- You need compliance certifications (SOC 2, HIPAA, FedRAMP)
- You value anomaly detection and AI-assisted troubleshooting
OpenObserve vs New Relic vs CubeAPM
CubeAPM is a self-hosted observability platform covering APM, logs, infrastructure, Kubernetes, RUM, synthetics, and error tracking. It runs inside your cloud or on-premises, keeping telemetry data local. CubeAPM uses OpenTelemetry natively and charges $0.15/GB with no per-user fees.
| OpenObserve | New Relic | CubeAPM | |
|---|---|---|---|
| Pricing | $0.50/GB (cloud); self hosted free | $0.40/GB + $49–$99/user/mo | $0.20/GB, no user fees |
| Deployment | Self-hosted or cloud | SaaS only | Self-hosted, managed by vendor |
| APM depth | Logs, metrics, basic traces | Full APM, RUM, synthetics, errors | Full APM, RUM, synthetics, errors |
| OTel native | Yes | Partial | Yes |
| Best for | Log storage cost optimization | Managed full-stack observability | On-prem + full observability + cost control |
OpenObserve is the cheapest for log-heavy workloads but lacks APM depth. New Relic provides the most mature platform but costs 10–20x more at scale. CubeAPM combines full observability with on-premises deployment and ingestion-based pricing.
For teams evaluating both OpenObserve and New Relic, CubeAPM offers a middle path: full APM features like New Relic, self-hosted data control like OpenObserve, and pricing closer to OpenObserve’s model. Teams switching from New Relic to CubeAPM have documented 64–75% cost reductions.
Verdict
OpenObserve and New Relic serve different use cases. OpenObserve is a cost-optimized log and metric platform for teams that prioritize storage efficiency and self-hosting. New Relic is a mature, full-stack APM platform for teams that need managed observability with deep integrations, RUM, and synthetics.
If your primary need is affordable log storage with basic tracing, choose OpenObserve. If you need full APM depth with minimal setup, choose New Relic. If you want full observability with on-premises control and predictable pricing, evaluate CubeAPM as a New Relic alternative.
Disclaimer: The information in this article reflects the latest details available at the time of publication and may change as technologies and products evolve. Features, pricing, and plan limits can change over time. Always verify the latest information directly with the vendor before making purchasing or deployment decisions.
Frequently Asked Questions
What is the main difference between OpenObserve and New Relic?
OpenObserve is a cost-optimized, self-hosted observability platform focused on logs, metrics, and basic traces. New Relic is a full-stack, cloud-only APM platform with RUM, synthetics, error tracking, and AI monitoring. OpenObserve prioritizes storage efficiency and low cost; New Relic prioritizes managed APM depth and ease of use.
Is OpenObserve really 140x cheaper than Elasticsearch for log storage?
OpenObserve uses Parquet columnar storage, which compresses data far more efficiently than Elasticsearch’s inverted indexes. In log-heavy workloads with low query frequency, teams report 10–140x storage cost reductions. However, query performance for high-cardinality fields is slower than Elasticsearch.
Does New Relic support OpenTelemetry?
Yes, but with limitations. New Relic ingests OTel data via its OTLP endpoint, but some APM features work better with New Relic proprietary agents. OTel instrumentation requires more manual setup than native agents.
Can I self-host New Relic?
No. New Relic is cloud-only SaaS. All telemetry must be sent to New Relic’s infrastructure. For data residency or compliance requirements, this rules out New Relic entirely.
What is New Relic’s CCU pricing model?
CCU (Compute Capacity Units) is New Relic’s alternative to per-user pricing. Instead of paying per seat, you pay for compute capacity based on how much processing power your telemetry requires. Costs vary by query complexity and data retention, making CCU pricing hard to forecast.
Does OpenObserve support real user monitoring?
No. OpenObserve does not have RUM, synthetics, or browser monitoring. It focuses on backend observability: logs, metrics, and traces.
How does CubeAPM compare to OpenObserve and New Relic?
CubeAPM provides full-stack observability like New Relic, self-hosted deployment like OpenObserve, and flat $0.15/GB pricing with no user fees. It is a middle path for teams that need APM depth, on-premises control, and predictable costs.