










Windows Communication Foundation (WCF) services power critical backend workflows across industries, from banking APIs to logistics systems, yet most teams still monitor them through basic performance counters and application logs. When a WCF service slows or fails, the standard debugging path is to replay the request locally, check IIS logs, and hope the problem surfaces. Without distributed tracing, a latency spike in a downstream database or a timeout in an external SOAP call looks identical at the service boundary.
OpenTelemetry changes this. It brings distributed tracing to WCF services on both .NET Framework and CoreWCF, linking every request across HTTP, TCP, named pipes, and HTTPS bindings. When a WCF operation fails, OpenTelemetry captures the entire call chain from the client call through every service hop and backend dependency with exact timings, error states, and contextual metadata.
This guide covers how monitoring WCF services with OpenTelemetry works, what it captures, how to configure it for .NET Framework and CoreWCF, and which monitoring tools make the data actionable.
What Is WCF and Why It Still Matters in Production
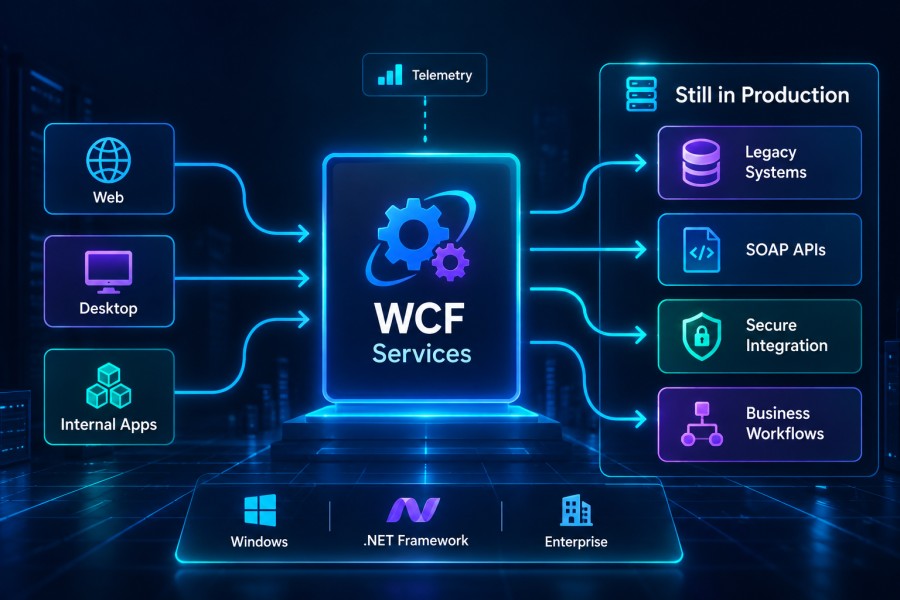
Windows Communication Foundation is Microsoft’s framework for building service-oriented applications. Released with .NET Framework 3.0 in 2006, WCF enables developers to build services that communicate over multiple transport protocols (HTTP, TCP, named pipes, MSMQ) using a unified programming model. While newer frameworks like ASP.NET Core and gRPC have gained traction, WCF remains deeply embedded in enterprise infrastructure, particularly in financial services, healthcare, and government systems where multi-year migration cycles mean legacy WCF services continue handling production traffic.
WCF services support SOAP, REST, and binary messaging over encrypted and unencrypted transports. They handle everything from synchronous request-response workflows to duplex communication and queued messaging. This flexibility made WCF powerful but also complex to monitor. A single service might expose endpoints over HTTP and TCP simultaneously, process messages encoded as text, binary, or MTOM, and authenticate clients through certificates, Windows credentials, or custom tokens. Without instrumentation that understands these protocol details, performance issues in WCF services remain opaque.
CoreWCF is the modern evolution of WCF, ported to .NET Core and .NET 5+. It brings the WCF programming model to cross-platform environments while integrating with ASP.NET Core middleware and dependency injection. For teams migrating WCF workloads to containers or Kubernetes, CoreWCF provides a migration path that preserves existing service contracts and bindings. OpenTelemetry support in CoreWCF is native as of 2025, making distributed tracing available without third-party instrumentation libraries.
How OpenTelemetry Instruments WCF Services
OpenTelemetry WCF instrumentation works by injecting telemetry collection points into the WCF message pipeline. On .NET Framework, this is done through WCF’s extensibility model using IDispatchMessageInspector for service-side instrumentation and IClientMessageInspector for client-side calls. On CoreWCF, instrumentation hooks into the ASP.NET Core middleware pipeline and uses an activity source named CoreWCF.Primitives to emit trace spans.
What Gets Captured in WCF Traces
Every WCF operation instrumented with OpenTelemetry generates a trace span containing:
- Operation name: The service contract and operation method invoked
- Endpoint address: The URI where the service is hosted
- Binding type: HTTP, TCP, named pipes, or other transport protocol
- Message action: The SOAP action or REST endpoint
- Request and response timings: Start time, duration, and completion status
- Error details: Exception type, message, and stack trace if the operation failed
- Correlation context: Trace and span IDs propagated across service boundaries
When a client calls a WCF service, OpenTelemetry creates a parent span for the client call. The service receives the trace context through SOAP headers or HTTP headers, creates a child span for processing the request, and propagates the context to any downstream calls. This produces a complete distributed trace showing latency contributions from the client, network, WCF service, and backend dependencies.
Supported WCF Configurations
The OpenTelemetry.Instrumentation.Wcf NuGet package supports the following WCF configurations as verified by the project maintainers:
Transport protocols: HTTP, HTTPS, TCP, named pipes
Transfer modes: Streamed and buffered
Message encoding: Text (SOAP), binary, MTOM
Security modes: None, transport, message, and mixed mode
The instrumentation library collects trace data regardless of message encoder or security configuration. A WCF service using BasicHttpBinding with SOAP over HTTP generates the same trace structure as a service using NetTcpBinding with binary encoding over TCP. The protocol details appear in span attributes but do not affect whether tracing works.
Setting Up OpenTelemetry for WCF on .NET Framework
Instrumenting WCF services on .NET Framework requires adding the OpenTelemetry WCF instrumentation library and configuring it through the service’s Web.config or programmatically via behavior attributes.
Installation
Add the OpenTelemetry WCF instrumentation package via NuGet:
dotnet add package OpenTelemetry.Instrumentation.WcfFor .NET Framework projects using packages.config, add the package through the NuGet Package Manager UI or edit packages.config directly.
Server-Side Instrumentation via Configuration
To instrument all WCF services in an application, add the telemetry behavior extension to Web.config:
<system.serviceModel>
  <extensions>
    <behaviorExtensions>
      <add name="telemetryExtension"
           type="OpenTelemetry.Instrumentation.Wcf.TelemetryEndpointBehaviorExtensionElement, OpenTelemetry.Instrumentation.Wcf" />
    </behaviorExtensions>
  </extensions>

  <behaviors>
    <serviceBehaviors>
      <behavior>
        <telemetryExtension />
      </behavior>
    </serviceBehaviors>
  </behaviors>
</system.serviceModel>This configuration applies instrumentation to every service endpoint in the application. When a request arrives, the IDispatchMessageInspector intercepts it, extracts trace context from incoming headers, and creates a span for the operation.
Server-Side Instrumentation via Endpoint Behavior
To instrument specific endpoints rather than all services, configure the behavior per endpoint:
<system.serviceModel>
  <services>
    <service name="MyNamespace.MyService">
      <endpoint address=""
                binding="basicHttpBinding"
                contract="MyNamespace.IMyService">
        <behaviors>
          <endpointBehaviors>
            <behavior>
              <telemetryExtension />
            </behavior>
          </endpointBehaviors>
        </behaviors>
      </endpoint>
    </service>
  </services>
</system.serviceModel>This approach gives control over which endpoints participate in distributed tracing. If a service exposes multiple endpoints with different security or performance characteristics, selective instrumentation avoids trace overhead on internal admin endpoints while capturing production traffic.
Client-Side Instrumentation
WCF clients must propagate trace context to services. Add the telemetry behavior to client endpoints:
<system.serviceModel>
  <client>
    <endpoint address="http://localhost:8080/MyService"
              binding="basicHttpBinding"
              contract="MyNamespace.IMyService">
      <behaviors>
        <endpointBehaviors>
          <behavior>
            <telemetryExtension />
          </behavior>
        </endpointBehaviors>
      </behaviors>
    </endpoint>
  </client>
</system.serviceModel>When the client makes a call, OpenTelemetry injects trace headers into the outgoing SOAP message. The service extracts these headers and links its processing span to the client span, creating a parent-child relationship in the distributed trace.
Programmatic Instrumentation with Attributes
For teams that prefer code over configuration, apply the TelemetryContractBehaviorAttribute directly to service contracts:
[ServiceContract]
[TelemetryContractBehavior]
public interface ICalculator
{
    [OperationContract]
    int Add(int a, int b);
}This attribute works on both .NET Framework services and .NET Core clients. It eliminates XML configuration and keeps telemetry setup close to the service contract definition.
Configuring the OpenTelemetry SDK
WCF instrumentation generates trace spans but does not export them. Configure the OpenTelemetry SDK to send traces to a backend:
using OpenTelemetry;
using OpenTelemetry.Trace;
var tracerProvider = Sdk.CreateTracerProviderBuilder()
    .AddWcfInstrumentation()
    .AddOtlpExporter(options =>
    {
        options.Endpoint = new Uri("http://localhost:4317");
    })
.Build();The AddWcfInstrumentation() method registers the WCF activity source. The OTLP exporter sends traces to any OpenTelemetry-compatible backend, including Jaeger, Tempo, or infrastructure monitoring platforms that support OTLP ingestion.
Common Issues on .NET Framework
Missing trace context in TCP bindings: TCP bindings do not support custom SOAP headers by default. Enable message headers in the binding configuration to allow trace propagation.
High overhead on high throughput services: Tracing every request on a service handling thousands of requests per second can add CPU and memory pressure. Use sampling to reduce trace volume while retaining visibility into slow or failed requests.
IIS-hosted services not generating traces: Ensure the OpenTelemetry SDK is initialized early in the application lifecycle, typically in Global.asax Application_Start(). If the SDK initializes after the first WCF request, that request will not generate a trace.
Setting Up OpenTelemetry for CoreWCF on .NET
CoreWCF has native OpenTelemetry support built in. Instrumenting CoreWCF services requires adding the CoreWCF activity source to the OpenTelemetry tracer provider.
Installation
Add CoreWCF and OpenTelemetry packages:
dotnet add package CoreWCF.Http
dotnet add package OpenTelemetry.Extensions.Hosting
dotnet add package OpenTelemetry.Exporter.OpenTelemetryProtocolConfiguring OpenTelemetry in a CoreWCF Service
In a .NET application using CoreWCF, configure OpenTelemetry in Program.cs:
var builder = WebApplication.CreateBuilder(args);
builder.Services.AddServiceModelServices();
builder.Services.AddServiceModelMetadata();
builder.Services.AddOpenTelemetry()
    .WithTracing(tracing =>
    {
        tracing.AddSource("CoreWCF.Primitives")
               .AddAspNetCoreInstrumentation()
               .AddHttpClientInstrumentation()
               .AddOtlpExporter();
    });
var app = builder.Build();
app.UseServiceModel(serviceBuilder =>
{
    serviceBuilder.AddService<CalculatorService>();
    serviceBuilder.AddServiceEndpoint<CalculatorService, ICalculator>(
        new BasicHttpBinding(BasicHttpSecurityMode.Transport),
        "/CalculatorService.svc");
});
app.Run();The critical line is .AddSource("CoreWCF.Primitives"). This tells OpenTelemetry to listen for traces emitted by CoreWCF’s internal activity source. Without this line, CoreWCF operations will not appear in distributed traces even though the service is running.
What CoreWCF Traces Capture
CoreWCF traces include the same details as .NET Framework WCF instrumentation: operation name, endpoint, binding type, timings, and errors, plus integration with ASP.NET Core diagnostics. This means CoreWCF traces automatically correlate with ASP.NET Core middleware traces, giving visibility into the full request pipeline from Kestrel through routing, authentication, and into the WCF operation handler.
A production team monitoring a CoreWCF service in a Kubernetes cluster documented a 40% reduction in incident resolution time after enabling OpenTelemetry. The traces surfaced that most slow requests were caused by a database connection pool exhaustion issue that only occurred when multiple pods scaled simultaneously during traffic spikes.
CoreWCF Instrumentation Compared to ASP.NET Core Only Traces
Running CoreWCF without the CoreWCF.Primitives activity source produces only ASP.NET Core HTTP traces. These traces show the request entering the service and the response leaving but skip the WCF operation execution entirely. You see that a POST request took 300ms but not which WCF method was called, what parameters were passed, or where inside the operation the time was spent.
Adding CoreWCF instrumentation fills this gap. The trace now includes a child span for the WCF operation with the service contract name, operation method, and any exceptions thrown inside the handler. This makes the difference between knowing a request was slow and knowing exactly why.
Monitoring WCF Services with CubeAPM

CubeAPM provides full stack observability for WCF services through native OpenTelemetry support. It ingests OTLP traces from both .NET Framework WCF services and CoreWCF applications, automatically indexing every span attribute, including operation name, endpoint URI, and binding type for fast search and filtering.
Why CubeAPM for WCF Monitoring
Most APM platforms treat WCF as a generic HTTP or TCP service, missing protocol-specific context. CubeAPM surfaces WCF-specific signals binding type, message action, security mode without requiring custom instrumentation. Traces from WCF services appear alongside real user monitoring data and synthetic monitoring checks, giving a complete picture of how WCF endpoints perform under real user load and scheduled health checks.
CubeAPM runs inside your own cloud or on-premises, which matters for teams with data residency requirements. WCF services often handle financial transactions, patient records, or government data where telemetry export to third-party SaaS platforms creates compliance risk. CubeAPM keeps all trace data local while delivering the same query speed and retention that cloud platforms offer.
Setting Up WCF Monitoring in CubeAPM
Configure the OpenTelemetry SDK in your WCF application to export traces to CubeAPM via OTLP:
using OpenTelemetry;
using OpenTelemetry.Trace;
var tracerProvider = Sdk.CreateTracerProviderBuilder()
    .AddWcfInstrumentation()
    .AddOtlpExporter(options =>
    {
        options.Endpoint = new Uri("http://cubeapm-collector:4317");
        options.Protocol = OtlpExportProtocol.Grpc;
    })
.Build();For CoreWCF services, add the same exporter configuration in Program.cs:
builder.Services.AddOpenTelemetry()
    .WithTracing(tracing =>
    {
        tracing.AddSource("CoreWCF.Primitives")
               .AddOtlpExporter(options =>
               {
                   options.Endpoint = new Uri("http://cubeapm-collector:4317");
               });
});Once traces are flowing, CubeAPM automatically groups them by service name and endpoint. The trace search UI filters by WCF operation name, binding type, and error state. Alerts can trigger on latency thresholds per operation; for example, alert if the ProcessPayment operation exceeds 500ms for more than 5% of requests in a 5-minute window.
Cost Model for WCF Monitoring
CubeAPM charges $0.20 per GB of ingested trace data with no per-host or per-user fees. A WCF service handling 10 million requests per month with an average trace size of 8 KB generates roughly 80 GB of trace data monthly, costing $16. Compare this to platforms that charge per host or per transaction, where a 20-node WCF farm could cost hundreds of dollars monthly regardless of actual trace volume.
Best Practices for WCF Observability
Use Sampling on High Volume Endpoints
WCF services that handle thousands of requests per second generate too much trace data to store every span. Implement tail-based sampling to keep traces for slow or failed requests while dropping traces for fast successful calls. The OpenTelemetry SDK supports probabilistic sampling and parent-based sampling to reduce trace volume without losing visibility into problems.
Correlate WCF Traces with Database and External API Calls
WCF operations often call databases, external SOAP services, or REST APIs. Instrument these dependencies with OpenTelemetry to create complete distributed traces. If a WCF operation calls SQL Server, instrument the database connection with the OpenTelemetry SQL instrumentation library. The resulting trace shows the WCF operation span with child spans for each database query, making it obvious when a slow query is the bottleneck.
Set Alerts on Error Rates, Not Just Latency
A WCF service can fail fast, returning errors in under 50ms while latency alerts stay silent. Monitor error rates per operation and alert when the error percentage crosses a threshold. A sudden spike in 500 errors on the GetCustomerData operation indicates a backend failure even if response times remain low.
Retain Traces Long Enough to Correlate with Incidents
WCF services often support batch workflows or scheduled jobs where issues surface hours or days after the triggering event. Retain traces for at least 30 days to allow correlation between a failed batch job and the WCF operation that initiated it. Platforms that charge extra for extended retention create a trade-off between cost and debuggability. CubeAPM includes unlimited retention at the standard $0.15/GB rate.
Tag Traces with Business Context
WCF spans can carry custom attributes beyond protocol metadata. Tag traces with customer ID, transaction type, or order number to enable business-level analysis. When a specific customer reports slow performance, filter traces by customer ID to see exactly which WCF operations are affecting them and how those operations perform compared to the baseline.
Tools for Visualizing WCF Traces
OpenTelemetry generates trace data but does not visualize it. Several tools consume OTLP traces and provide UIs for searching, filtering, and analyzing WCF service performance.
Jaeger
Jaeger is an open-source distributed tracing platform originally developed at Uber. It ingests OTLP traces via the OpenTelemetry Collector and provides a web UI for viewing trace timelines, dependency graphs, and latency distributions. Jaeger works well for teams that want a free, self-hosted tracing backend without vendor lock-in. The downside is that Jaeger focuses on tracing only; it does not correlate traces with logs, metrics, or infrastructure data.
Grafana Tempo
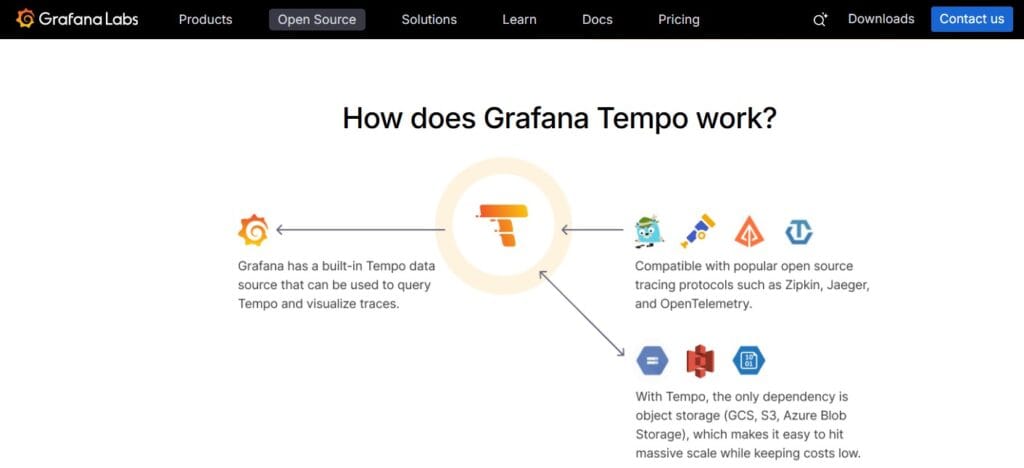
Tempo is Grafana’s distributed tracing backend designed to scale to high trace volumes. It stores traces in object storage like S3 or GCS, making retention costs low compared to databases. Tempo integrates with Grafana dashboards, allowing teams to visualize WCF traces alongside Prometheus metrics and Loki logs. This unified view helps correlate a WCF latency spike with a CPU spike on the host or a database connection pool saturation event.
CubeAPM
CubeAPM combines traces, logs, metrics, and infrastructure monitoring in one platform. WCF traces appear in the same UI as application logs, database query metrics, and host-level CPU graphs. The platform indexes every span attribute automatically, so filtering WCF traces by operation name, endpoint, or error state requires no schema setup. CubeAPM runs on your infrastructure, keeping trace data inside your VPC or data center while delivering query speeds comparable to cloud SaaS platforms.
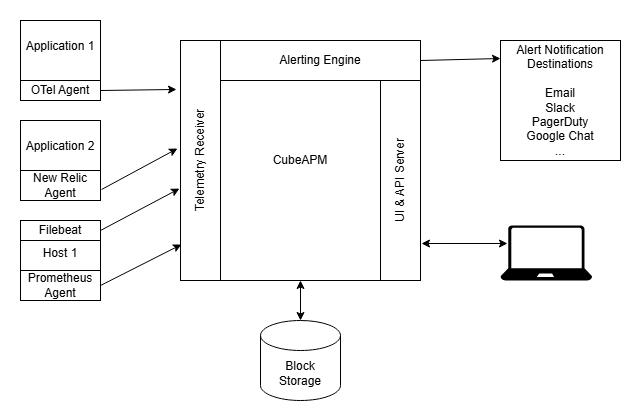
Unlike Jaeger or Tempo, CubeAPM includes alerting, dashboards, and correlation out of the box. Teams do not need to configure Prometheus exporters, Grafana data sources, or alert manager rules separately. The trade-off is that CubeAPM is a managed platform rather than a fully open-source project. For teams that want the observability depth of Grafana without the operational overhead of running Tempo, Loki, Prometheus, and Grafana separately, CubeAPM provides a middle ground.
Common WCF Monitoring Challenges and How OpenTelemetry Solves Them
Challenge: WCF Services Behind Load Balancers Lose Trace Context
When a WCF client calls a service through a load balancer, the load balancer may strip or modify HTTP headers, breaking trace context propagation. Solution: Configure the load balancer to preserve headers or use a custom trace context injector that writes trace IDs into SOAP headers instead of HTTP headers. SOAP headers survive load balancer hops because they are part of the message body, not transport metadata.
Challenge: WCF Faults Do Not Include Enough Context for Debugging
WCF fault exceptions often return generic error messages without stack traces or span IDs. Solution: Enable the RecordException option in WCF instrumentation to attach full exception details to trace spans. When a fault occurs, the span includes the exception type, message, and stack trace, making it easy to link the error to the exact code path that threw it.
Challenge: Mixing WCF and ASP.NET Core Services Creates Trace Gaps
In hybrid architectures where some services use WCF and others use ASP.NET Core, trace context can get lost at the boundary. Solution: Use a shared OpenTelemetry tracer provider that instruments both WCF and ASP.NET Core. When an ASP.NET Core API calls a WCF backend, the OpenTelemetry SDK propagates trace context automatically as long as both ends are instrumented with the same SDK version.
Challenge: WCF Performance Counters Do Not Map to OpenTelemetry Metrics
Legacy WCF monitoring relies on Windows performance counters like Calls Per Second and Calls Failed. These counters are not semantic metrics and do not integrate with OpenTelemetry. Solution: Derive RED metrics (Rate, Errors, Duration) from trace spans using the OpenTelemetry metrics SDK. The AddView API can create histograms and counters from span attributes, giving the same visibility as performance counters with better integration into modern observability stacks.
Disclaimer: The information in this article reflects the latest details available at the time of publication and may change as technologies and products evolve. Features, pricing, and plan limits can change over time. Always verify the latest information directly with the vendor before making purchasing or deployment decisions.
Frequently Asked Questions
Does OpenTelemetry work with all WCF bindings?
Yes. OpenTelemetry WCF instrumentation supports HTTP, HTTPS, TCP, and named pipes bindings with text, binary, and MTOM encoding. The instrumentation captures protocol details as span attributes without requiring binding specific configuration.
Can I instrument WCF clients without changing service code?
Yes. Add the telemetry behavior to the client endpoint configuration in app.config or programmatically via the `TelemetryContractBehaviorAttribute`. The client will inject trace context into outgoing calls even if the service is not instrumented, though the service will not create child spans.
How much overhead does OpenTelemetry add to WCF services?
Instrumentation adds microseconds per request for context extraction and span creation. On high throughput services handling thousands of requests per second, use sampling to reduce overhead. Most teams report less than 2% CPU increase after enabling full instrumentation.
What happens if the OpenTelemetry collector is unreachable?
Traces buffer in memory according to the exporter configuration. If the buffer fills, traces are dropped. Configure batch export with appropriate timeout and retry settings to minimize trace loss during collector outages.
Can I use OpenTelemetry with WCF services hosted in Windows Services?
Yes. WCF services hosted in Windows Services, IIS, or console applications all support OpenTelemetry instrumentation. The configuration is identical regardless of hosting environment.
Does CoreWCF support the same instrumentation as .NET Framework WCF?
CoreWCF has native OpenTelemetry support through the `CoreWCF.Primitives` activity source. The instrumentation is conceptually similar to .NET Framework WCF but integrates with ASP.NET Core middleware, providing richer traces that include routing and authentication spans.
How do I filter WCF traces by operation name in my observability platform?
WCF spans include an attribute for operation name typically `rpc.method` or `http.route` depending on binding. Query your observability platform using these attributes to filter traces by specific WCF operations.