Monitoring Kubernetes API Servers is more critical than ever. In 2025, roughly 80% of enterprises report production outages due to system changes in their Kubernetes environments, and many say detection and resolution take over 40 minutes each. These interruptions often trace back to issues in the API Server, its latency, mis-configured auth, and etcd bottlenecks, that ripple throughout the cluster and impact end users.
Yet most teams still struggle with Monitoring Kubernetes API Servers effectively. Key metrics are scattered across multiple dashboards, logs aren’t correlated with errors, error tracing is weak, and alerting often fires too late or too noisily. These gaps mean problems often become visible only after deployments fail or SLAs break.
CubeAPM is the best solution for Monitoring Kubernetes API Servers. It merges metrics, logs, and traces into one view, provides real-time error tracking (4xx/5xx, leader election, etcd), monitors latency and throughput, and offers intelligent alerts and anomaly detection.
In this article, we’ll cover what Kubernetes API Servers are, why monitoring them matters, the key metrics, and how CubeAPM delivers Kubernetes API Server monitoring.
What Is a Kubernetes API Server?

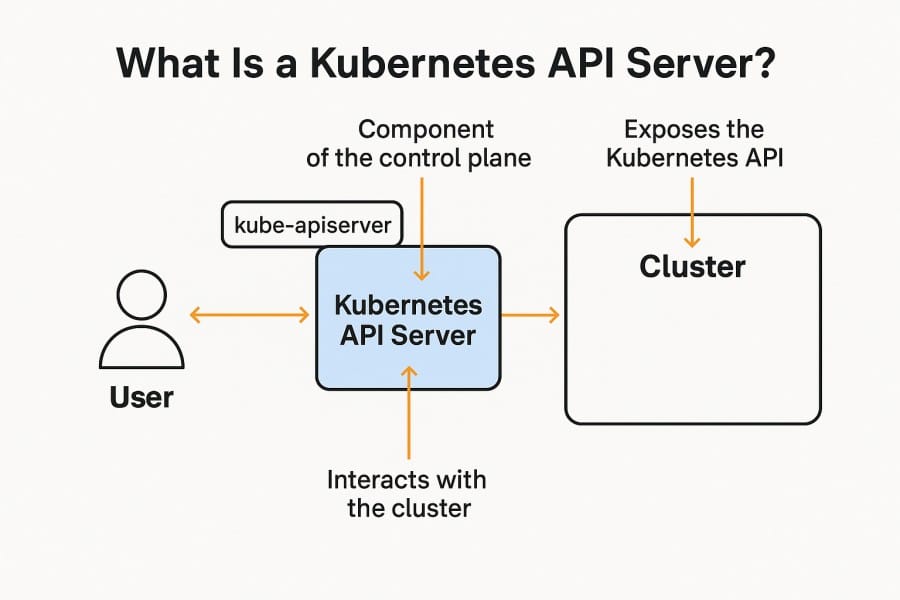
The Kubernetes API Server is the central control plane component that exposes Kubernetes’ core API. It acts as the gateway through which every request—whether from kubectl, controllers, operators, or external integrations—flows. K8 API servers validate requests, enforce security, and update the cluster state in etcd. In short, it’s the “front door” of a Kubernetes cluster and the single source of truth for all cluster operations.
For businesses, monitoring K8 API servers is critical because their performance directly impacts cluster health and application availability:
- Deployment Reliability: If the API server slows down, new workloads can’t be scheduled or scaled.
- Security & Compliance: Audit logs flow through the API server, making it the key point for tracking access and enforcing policies.
- Business Continuity: An unhealthy API server means outages across services, delaying releases, and disrupting end-users.
Example: Monitoring API Server Latency During a Retail Flash Sale
Imagine a global e-commerce company running a Kubernetes cluster during a seasonal flash sale. As order volume spikes, the API server starts showing high request latency. Without monitoring, deployments stall and autoscaling lags, leaving customers with slow checkouts or failed orders. With proactive API server monitoring, engineers can spot these latency spikes, trace them to etcd bottlenecks, and scale the control plane before revenue is lost.
Why Monitoring Kubernetes API Servers is Critical
It’s the control-plane choke point
Every kubectl, controller, operator, or webhook call goes through the API Server. If it slows or fails, scheduling, rollouts, and autoscaling stall across the cluster. As Kubernetes has become near-ubiquitous in production, the blast radius of API Server issues has grown with it, making proactive monitoring non-negotiable.
You need to meet upstream SLOs (or know when you don’t)
Kubernetes upstream SLOs expect the 99th-percentile latency for most API requests to stay at or below 1 second (measured over 5 minutes for each (resource, verb) pair). Exceeding that threshold is an early indicator of control-plane distress and should trigger investigation of hot resources, verbs, or tenants.
Overload shows up as 429s—catch them before users do
When the API Server is saturated, clients start receiving HTTP 429 (Too Many Requests). With default limits, certain catch-all flows can drop requests once ~13 in-flight are hit; Priority & Fairness adds queuing and isolation, but still needs monitoring to observe starvation and bursts. Alerting on 429 rates by verb/resource helps you throttle or reshape traffic before rollouts fail.
etcd is your back end; its health dictates API Server health
The API Server’s persistence path is etcd; storage pressure, compaction issues, or high write latency will surface as elevated API latencies and failed mutations. etcd itself warns that exceeding space quotas or poorly tuned backends leads to degraded performance and even maintenance-mode alarms—conditions your API metrics and logs should surface immediately.
Latency and error profiles are observable
Core API Server metrics (request counts, latency histograms, long-running requests, process CPU/memory) are exported natively and should be scraped and broken down by verb, resource, scope, and code to pinpoint hotspots (e.g., LIST pods, WATCH events). Several vendors and distributions document the exact signals to watch—use them to model your dashboards and alerts.
Audit logs are your compliance and forensics lifeline
Audit logs record who did what, when, and from where. They’re essential for incident timelines, RBAC hygiene, and regulatory evidence—but they also add API Server memory overhead, so you must tune policies and watch for performance side-effects. Pipe these logs into your observability stack and correlate them with request errors/latency to accelerate RCA.
Real business impact: MTTR and outage minutes cost real money
High-impact incidents still take a median 51 minutes to resolve across industries—time that compounds when the control plane is the bottleneck. Monitoring the API Server’s latency, error rates, and overload signals tightens your mean-time-to-detect and speeds resolution.
Bursty clients and long-running requests can starve others
Watches, exec/port-forward, and aggregator backends create long-running request patterns. Noisy tenants or controllers can crowd out critical traffic if you’re not watching those gauges. Track long-running request counts and pair them with Priority & Fairness telemetry to keep bursts from starving core operations.
Key Metrics to Monitor for Kubernetes API Server
Monitoring the Kubernetes API Server requires tracking both request-level performance and control plane stability. Grouping metrics into categories makes it easier to detect issues before they cascade across the cluster.
Request Performance Metrics
These metrics measure how the API Server handles client requests, such as kubectl, controllers, and operators.
- Request Latency: Tracks how long the API Server takes to respond to client calls. High latency indicates bottlenecks in processing or etcd. Threshold: 99th percentile latency should stay under 1s.
- Request Throughput: Measures the volume of requests handled per second. A sudden drop often signals overload or connectivity issues. Threshold: Throughput should remain stable in line with cluster workload patterns.
- Error Rates (4xx/5xx): Captures failed requests from clients or internal components. Frequent 4xx errors suggest RBAC/auth issues, while 5xx signals server-side failures. Threshold: Error rates should remain close to 0%, with alerts for spikes above 1–2%.
Resource Utilization Metrics
These metrics highlight whether the API Server process itself is resource-constrained.
- CPU Usage: Monitors CPU consumption by the API Server process. Sustained high CPU leads to request queuing and slower responses. Threshold: Should stay below 80% of allocated CPU.
- Memory Usage: Tracks memory utilization, including spikes caused by audit logging or heavy client requests. Threshold: Should stay below 75–80% of allocated memory.
- Open Connections: Measures the number of active connections handled. Surges often point to noisy clients or controller loops. Threshold: Alert if connections grow rapidly without a corresponding workload increase.
etcd Interaction Metrics
Since the API Server relies on etcd for persistence, monitoring storage health is vital.
- etcd Request Latency: Shows the time taken for etcd reads/writes. Slow writes cause delayed cluster state updates. Threshold: Writes should complete in <25ms, reads in <10ms under normal load.
- etcd Failures: Counts failed etcd operations (timeouts, errors). Persistent failures lead to API errors and failed deployments. Threshold: Should be 0; any sustained errors require immediate action.
- etcd Compaction & Quota: Tracks compaction events and space usage. Exceeding quotas causes degraded performance or write failures. Threshold: Storage usage should remain <80% of the etcd quota.
Control Plane Stability Metrics
These metrics show if the API Server is healthy as part of the broader control plane.
- Leader Election Status: Ensures that one API Server is the active leader in HA setups. Failures lead to stalled cluster operations. Threshold: Leader election failures should be 0; any flapping is critical.
- Long-Running Requests: Monitors requests like WATCH or exec that persist. Too many long-running sessions can starve other requests. Threshold: Should remain within expected levels for cluster scale (e.g., under 100 concurrent watches per resource).
- Audit Log Volume: Tracks how much data is generated by audit logging. High volume strains memory and disk I/O. Threshold: Tune to balance compliance needs without exceeding resource capacity.
Telemetry Collection, Error Tracking & Alerting with CubeAPM
Monitoring the Kubernetes API Server effectively requires visibility into every signal: metrics, logs, and traces. CubeAPM, being OpenTelemetry-native, makes this unified telemetry effortless by collecting, enriching, and correlating control plane data in real time.
Unified Telemetry with Metrics, Logs & Traces

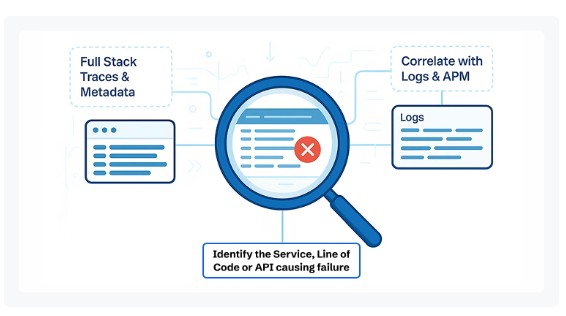
CubeAPM ingests API Server metrics such as apiserver_request_duration_seconds, apiserver_request_total, and etcd latencies, alongside audit logs and request traces. Instead of viewing them in isolation, CubeAPM correlates them to show why latency is rising, which requests are failing, and which client or controller is responsible. Audit logs get enriched with user, verb, and namespace context, enabling compliance and troubleshooting at the same time. Dashboards in CubeAPM Playground come prebuilt for Kubernetes API health, giving you instant cluster visibility.
Real-Time Error Tracking

Failures in the API Server — such as HTTP 429 throttling, 5xx server errors, or authentication failures — are detected and tracked in real time. CubeAPM’s error tracking module groups similar failures, attaches root-cause context (etcd write delays, leader election flaps, noisy controllers), and shows their impact on workloads. This drastically reduces noise while ensuring you never miss high-severity failures.
Intelligent Alerting & Anomaly Detection

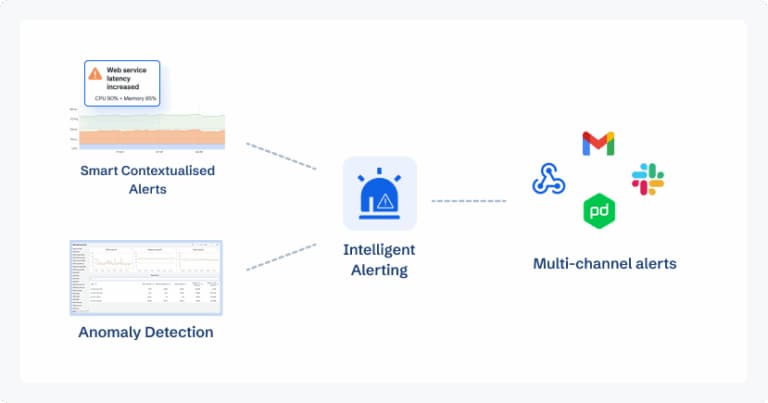
Instead of static thresholds alone, CubeAPM applies adaptive alerting and anomaly detection to catch patterns that traditional rules might miss. For example, if API Server latency exceeds the upstream 1s SLO or 429 errors spike, CubeAPM raises alerts enriched with context like “affected namespaces” or “top failing verbs.” With synthetic monitoring, teams can simulate client calls to the API Server and validate end-to-end responsiveness before users feel the pain.
How to Monitor Kubernetes API Server with CubeAPM
CubeAPM provides a complete, OpenTelemetry-native workflow to monitor the Kubernetes API Server. By combining metrics, logs, and alerts, you can quickly detect and fix control plane issues. Here’s how to monitor:
1. Install CubeAPM in Your Cluster
The first step is to deploy CubeAPM into your Kubernetes environment. Installation can be done via Helm or YAML manifests. This ensures that the CubeAPM collector and backend are ready to receive metrics and logs from your control plane. Follow the installation guide for detailed steps.
2. Configure the Collector for API Server Metrics & Logs
Once CubeAPM is installed, configure the collector to scrape API Server metrics like apiserver_request_duration_seconds, apiserver_request_total, and etcd latency histograms. You can also set up pipelines for audit logs and request logs to gain visibility into who did what in the cluster. Detailed configuration examples are available in the configuration docs.
3. Instrument with OpenTelemetry for Full Tracing
To correlate API Server requests with workloads, use CubeAPM’s OpenTelemetry instrumentation. This step enables distributed tracing, letting you follow a request as it enters the API Server, hits etcd, and propagates across controllers and pods. Instrumentation is lightweight and works across Go, Java, Node.js, Python, and other workloads connected to the API Server.
4. Enable Infrastructure Monitoring for Control Plane Nodes
The API Server runs on Kubernetes control plane nodes. Using infrastructure monitoring, CubeAPM tracks CPU, memory, and disk usage of these nodes. This helps you detect if API Server slowdowns are due to node resource pressure, rather than request load alone.
5. Stream Audit Logs into CubeAPM
Audit logs are critical for compliance and debugging. CubeAPM natively supports ingesting logs via the logs pipeline. By streaming Kubernetes API audit logs, you can identify authentication failures, unauthorized access attempts, and high-volume noisy clients.
6. Configure Alerts for API Server Health
Finally, set up intelligent alerts to get notified before incidents affect users. CubeAPM integrates with email, Slack, and other channels for timely notifications. You can configure alert policies for metrics such as API request latency, 5xx errors, or etcd write failures directly in the alerting configuration guide.
Real-World Example: Monitoring Kubernetes API Server in a Financial Services Platform
The Challenge
A global fintech company running a Kubernetes-based trading platform began facing sporadic deployment failures and degraded customer experience during peak trading hours. Engineers noticed kubectl commands hanging and CI/CD rollouts failing. Initial logs pointed to API Server latency spikes, but the team lacked unified visibility to confirm the root cause. With compliance requirements also demanding full audit trails, the lack of reliable API Server monitoring became a business risk.
The Solution
The company deployed CubeAPM to monitor their Kubernetes API Server. By ingesting request metrics (apiserver_request_duration_seconds and error codes), streaming audit logs, and correlating them with etcd latencies, CubeAPM gave a complete picture of API Server health. Unified dashboards highlighted which requests were failing, which namespaces were affected, and how latency correlated with node resource pressure.
The Fixes
- Scaled control plane nodes after CubeAPM revealed CPU saturation during trading spikes.
- Tuned etcd quotas and compaction settings based on CubeAPM’s latency metrics.
- Configured alerts for API Server 429 throttling and 5xx errors to detect overload early.
- Enabled audit log monitoring to track API calls by service accounts for compliance and noisy-client identification.
The Result
Within two weeks, the fintech team reduced API Server–related incidents by 65% and cut mean-time-to-resolution (MTTR) from nearly 40 minutes to under 15 minutes. Customer-facing outages during peak trading hours dropped to zero, and audit compliance improved with CubeAPM’s searchable log trails. The API Server became not just stable, but proactively monitored with alerts tuned for real-world workloads.
Verification Checklist & Example Alert Rules with CubeAPM
Once CubeAPM is deployed, it’s important to verify that your Kubernetes API Server monitoring is working end-to-end. Below is a detailed checklist followed by example alert rules you can adapt for production.
Verification Checklist
- Metrics ingestion: Confirm that CubeAPM is scraping apiserver_request_duration_seconds, apiserver_request_total, and etcd latency metrics. Dashboards should display latency percentiles and throughput.
- Log pipeline: Ensure that Kubernetes API Server audit logs and request logs are being streamed into CubeAPM’s log pipeline. Validate that you can search by user, namespace, and verb.
- Tracing enabled: Verify that OpenTelemetry traces are flowing into CubeAPM and that API requests can be correlated across controllers and workloads.
- Node resource monitoring: Check that the control plane node CPU, memory, and disk usage are monitored in CubeAPM infra dashboards.
- Alerting integration: Confirm that alert notifications are configured via email or other channels and test that they fire under simulated conditions.
- Compliance visibility: Validate that audit log events are searchable and retained according to the applicable compliance policy.
Example Alert Rules
Below are sample alerting rules for the Kubernetes API Server, using Prometheus-style syntax that CubeAPM supports. Each alert includes a short explanation of why it matters.
High API Server Latency
Latency above the upstream SLO of 1s indicates request bottlenecks.
- alert: APIServerHighLatency
  expr: histogram_quantile(0.99, sum(rate(apiserver_request_duration_seconds_bucket[5m])) by (verb, resource, le)) > 1
  for: 5m
  labels:
    severity: warning
  annotations:
    summary: "High API Server latency detected"
    description: "99th percentile latency for {{ $labels.verb }} {{ $labels.resource }} exceeded 1s for 5m."
Excessive 5xx Errors
5xx responses suggest server-side issues in the API Server or etcd.
- alert: APIServerHighErrorRate
  expr: sum(rate(apiserver_request_total{code=~"5.."}[5m])) by (verb, resource) > 5
  for: 10m
  labels:
    severity: critical
  annotations:
    summary: "High API Server error rate"
    description: "Excessive 5xx errors for {{ $labels.verb }} {{ $labels.resource }} in the past 10m."
API Server Overload (429s)
Too many throttled requests indicate saturation or noisy clients.
- alert: APIServerThrottling
  expr: sum(rate(apiserver_request_total{code="429"}[5m])) > 10
  for: 5m
  labels:
    severity: warning
  annotations:
    summary: "API Server request throttling"
    description: "More than 10 requests per second are being throttled (429s)."
etcd Write Latency
Slow writes in etcd directly delay API Server responses.
- alert: EtcdHighWriteLatency
  expr: histogram_quantile(0.99, sum(rate(etcd_request_duration_seconds_bucket{operation="PUT"}[5m])) by (le)) > 0.025
  for: 10m
  labels:
    severity: critical
  annotations:
    summary: "High etcd write latency"
    description: "99th percentile write latency to etcd exceeded 25ms."
Leader Election Failures
Unstable leader election indicates control plane instability.
- alert: APIServerLeaderElectionFailure
  expr: increase(apiserver_leader_election_master_status[10m]) < 1
  for: 10m
  labels:
    severity: critical
  annotations:
    summary: "API Server leader election failure"
    description: "Leader election has not succeeded in the past 10 minutes."
Conclusion
Monitoring the Kubernetes API Server is vital because it’s the single entry point for all cluster operations. Even minor latency spikes, error surges, or etcd issues can cascade into failed deployments, blocked scaling, and business-impacting outages.
CubeAPM ensures you have full visibility into this critical control-plane component. With unified telemetry across metrics, logs, and traces, plus real-time error tracking and anomaly-driven alerts, CubeAPM makes it easy to detect problems early, reduce MTTR, and stay compliant.
By proactively monitoring your Kubernetes API Server with CubeAPM, you safeguard cluster reliability, accelerate resolution, and keep your workloads running smoothly. Start monitoring smarter with CubeAPM today.
Disclaimer: The information in this article reflects the latest details available at the time of publication and may change as technologies and products evolve.
FAQs
1. How do I check if my Kubernetes API Server is healthy?
You can use kubectl get --raw='/healthz' to check basic health, or kubectl get --raw='/readyz' for readiness. These endpoints return simple status codes that tell you whether the API Server is operational.
2. Can the Kubernetes API Server be monitored without Prometheus?
Yes. While Prometheus is the most common choice, you can use any OpenTelemetry-compatible platform like CubeAPM, which directly ingests API Server metrics and logs without requiring Prometheus as a middle layer.
3. How often should I collect API Server metrics?
A scrape interval of 15–30 seconds is recommended for production clusters. This provides enough resolution to catch latency spikes or request errors quickly without adding excessive load.
4. What are common causes of API Server downtime?
The most frequent causes include etcd storage issues, overloaded control plane nodes, misconfigured authentication/authorization, and excessive audit logging. Monitoring these dependencies is just as important as monitoring the API Server itself.
5. How does API Server monitoring improve developer productivity?
By reducing blind spots in request failures, latency, and throttling, monitoring shortens debugging cycles. Developers spend less time chasing intermittent API errors and more time focusing on application delivery. With CubeAPM, correlated traces and logs make RCA (Root Cause Analysis) much faster.


