Monitoring Docker containers has become essential as container adoption surges worldwide. According to the 2024 Docker survey, 59% of professional developers regularly use Docker, while 91% of organizations now run containers in production.
But this agility comes with challenges. Containers are ephemeral and can be created or destroyed in seconds. In microservice-heavy architectures, a single app may span thousands of containers, making it harder to detect memory leaks, restarts, or latency issues.
Basic commands like docker stats or docker logs are no longer enough. Teams struggle with observability costs, while IDC reports enterprises ingest 10 TB+ telemetry daily, adding complexity. In this article, we’ll explain what Docker containers are, why monitoring them is critical, key metrics to track, and how CubeAPM simplifies it.
What are Docker Containers?
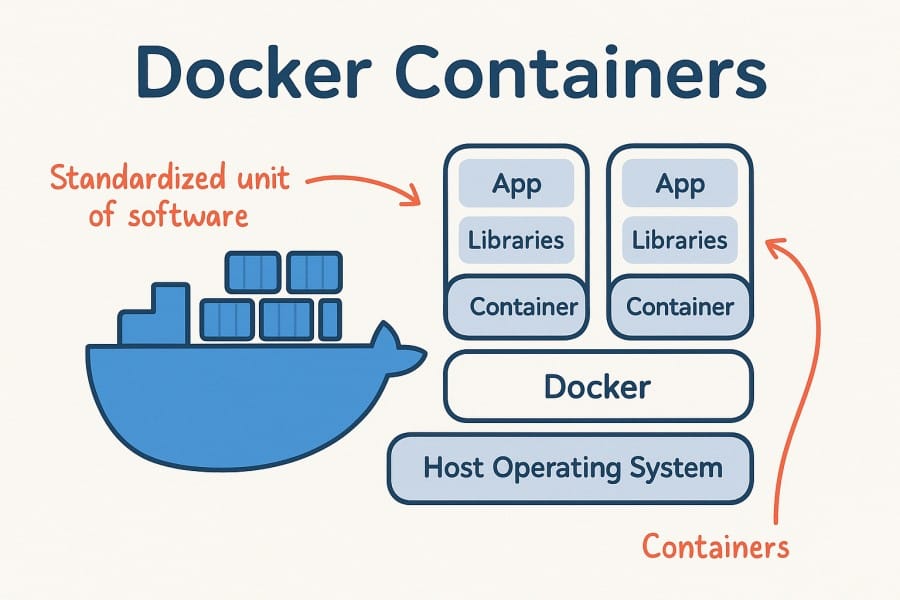
Docker containers are lightweight, portable units that package an application along with everything it needs to run — code, libraries, runtime, and dependencies. Unlike virtual machines, containers share the host operating system’s kernel, which makes them far more efficient: they start in seconds, use fewer resources, and can run at much higher density on the same hardware.
For businesses, this portability and efficiency bring huge advantages:
- Consistency across environments: a containerized app behaves the same in development, testing, and production.
- Scalability on demand: containers can be spun up or down instantly to match traffic.
- Faster releases: DevOps teams can ship features quickly without “it works on my machine” issues.
- Cost savings: higher workload density reduces infrastructure spend compared to VMs.
Example: Using Docker Containers at Netflix
Netflix runs thousands of Docker containers to handle video streaming workloads. Containers allow them to quickly scale microservices — such as recommendation engines or playback services — up or down depending on global demand, ensuring seamless performance for millions of viewers without overprovisioning resources.
Why Monitoring Docker Containers is Critical
Ephemeral, short-lived workloads erase evidence fast
Most containers live only minutes before being terminated or replaced. This short lifecycle makes it nearly impossible to diagnose problems by logging into the host or container directly. If you’re not collecting metrics, logs, and traces in near real time, crucial evidence of crashes, restarts, or performance issues disappears. Continuous monitoring ensures nothing gets lost, even if the container is long gone.
Image and dependency risk is the new uptime killer
Containers bundle OS layers and dependencies that change frequently. Without runtime monitoring, you may not detect vulnerabilities being exploited inside running containers or notice drift from approved images. Attackers often target container runtimes with malware or crypto-miners, so monitoring live workloads helps you catch anomalies that simple CI/CD image scanning would miss.
Security incidents directly slow delivery and hurt revenue
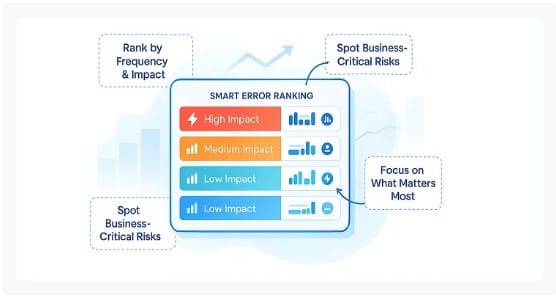
According to Red Hat’s 2024 Kubernetes security survey, 67% of companies slowed or delayed releases due to container security concerns, and 46% reported revenue or customer loss after an incident. Monitoring container environments in real time allows teams to spot policy violations, misconfigurations, unusual behavior, and before they turn into delays or outages.
Autoscaling and resource contention demand visibility
Autoscaling helps match demand, but without proper monitoring, it’s easy to run into CPU throttling, memory pressure, or containers endlessly restarting. Monitoring provides per-container metrics so teams can rightsize workloads, avoid over-provisioning costs, and ensure applications meet their SLOs.
Cost control depends on curbing data sprawl
Every container generates logs, metrics, and traces — and when you run hundreds or thousands of them, data volume explodes. A 2024 Grafana survey found that 61% of practitioners cited unexpected observability costs as a major concern. Smart monitoring strategies like sampling, structured logging, and tiered retention help control these costs without sacrificing insights.
Compliance and audit trails need container context

For industries under strict regulations, knowing exactly which image ran, who deployed it, and how it behaved is essential. Monitoring provides this container-level metadata tied to logs and traces, creating a reliable audit trail for regulators and customers alike.
Deployment health hinges on startup and pull signals
Even well-written code won’t run if images fail to pull, containers exceed memory limits during startup, or services crash-loop during rollout. Monitoring startup signals like exit codes (e.g., 137 for OOMKilled) and image pull errors catches these issues early, preventing cascading failures across the cluster.
Key Metrics and Signals to Track in Docker
Monitoring Docker containers requires focusing on a mix of system-level resource usage, application health, and operational signals. Grouping these into categories makes it easier to prioritize what matters most.
Resource Utilization
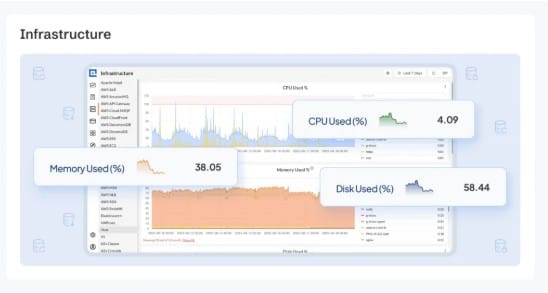
These metrics show how efficiently containers are consuming host resources and help prevent bottlenecks.
- CPU usage (%): Measures how much processing power a container consumes. Sustained high CPU usage may indicate inefficient code or an under-provisioned container. Threshold: watch for >80% sustained utilization.
- Memory usage (MB/GB): Tracks how much memory a container allocates and whether it exceeds its limit. Persistent memory growth can signal a leak. Threshold: >90% of memory limit triggers investigation.
- Disk I/O (read/write MB/s): Indicates whether containers are performing excessive disk operations, which may slow down applications. Threshold: consistent spikes above normal baseline need review.
- Network throughput (Mbps): Monitors data sent and received by containers. Abnormal spikes or drops may reveal noisy neighbors or broken services. Threshold: sudden >30% deviation from baseline.
Container Health
These metrics help determine if containers are running reliably and as expected.
- Uptime (seconds/minutes): Shows how long a container has been running without restarts. Frequent short uptimes point to instability. Threshold: multiple restarts within 5 minutes signal a problem.
- Restart count: Records how many times Docker has restarted a container. High restart counts usually point to crashes, config errors, or unhealthy probes. Threshold: more than 3 restarts in 10 minutes is a red flag.
- Exit codes: Exit codes like 137 (OOMKilled) or 139 (segmentation fault) provide direct clues about failure causes. Threshold: any non-zero exit code should be investigated.
Logs and Events

Logs and Docker events capture detailed runtime behavior and error conditions that metrics alone can’t show.
- Application logs: Capture stdout/stderr output from inside containers. Useful for debugging errors, latency, or unexpected state changes. Threshold: spikes in ERROR or WARN logs beyond baseline.
- Docker/Kubernetes events: Track container lifecycle events like start, stop, and kill signals. They provide visibility into orchestration-driven changes. Threshold: repeated failure events for the same container in short intervals.
Tracing and Dependencies
These metrics connect container performance to the broader system and user experience.
- Request latency (ms): Measures how long requests take to complete inside a containerized service. High latency indicates bottlenecks or dependency failures. Threshold: >95th percentile latency crossing defined SLOs.
- Inter-service communication: Observes how containers interact with other services, such as API calls or database connections. Breakdowns here often ripple across multiple containers. Threshold: error rates >5% on inter-service calls.
Errors and Failures
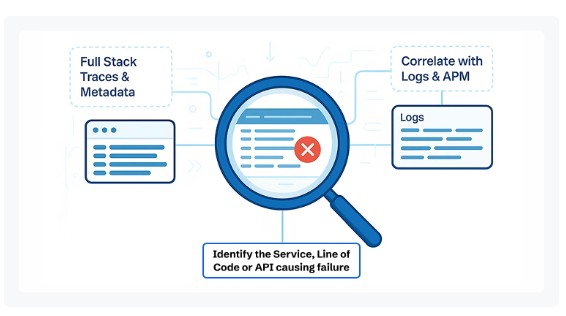
These metrics directly flag broken behavior in containers and deployments.
- Crash loops: Repeated restarts indicate that containers fail to initialize or stay running. Threshold: crash loop backoff events repeating more than 3 times.
- OOMKilled events: Occur when a container exceeds its memory limits and is killed by the kernel. Monitoring this pinpoints memory pressure. Threshold: any OOMKilled event requires root cause analysis.
- ImagePullBackOff: ImagePullBackOff happens when Docker fails to pull the required image. This usually stems from wrong tags, missing credentials, or registry limits. Threshold: multiple pull errors within a deployment rollout.
Traditional Approaches vs. Modern Observability
Legacy Tools: Useful but Limited
Developers traditionally leaned on Docker’s built-in commands like docker stats for CPU and memory usage, or docker logs for stdout/stderr output. These are handy for debugging a single container, but once you scale to hundreds, they quickly become overwhelming. Each command only shows a slice of data, leaving teams blind to the full application context.
Modern Observability with OpenTelemetry
Today’s containerized systems demand more than siloed commands. According to the CNCF 2024 Annual Survey, 82% of organizations now rely on OpenTelemetry as their standard for collecting container metrics, logs, and traces. This shift enables engineers to follow a user request end-to-end across multiple containers, identify bottlenecks, and map resource usage to customer experience.
Bridging the Gap
The difference is clear:
- Legacy tools = piecemeal insights, manual investigation, reactive fixes.
- Modern observability = stitched data, unified dashboards, proactive detection.
The payoff is significant — companies that adopt observability platforms report a 60% faster Mean Time to Resolution (MTTR) on container incidents. For fast-moving businesses, this means less downtime and more time focused on innovation.
How CubeAPM Monitors Docker Containers
Unified Dashboards
CubeAPM brings container metrics, logs, and traces together into a single, unified view. Instead of juggling separate tools for system metrics and application logs, engineers can instantly correlate a container restart with the spike in memory usage or trace that triggered it. This context-rich view reduces guesswork and speeds up root cause analysis across Docker workloads.
Real-Time Alerts
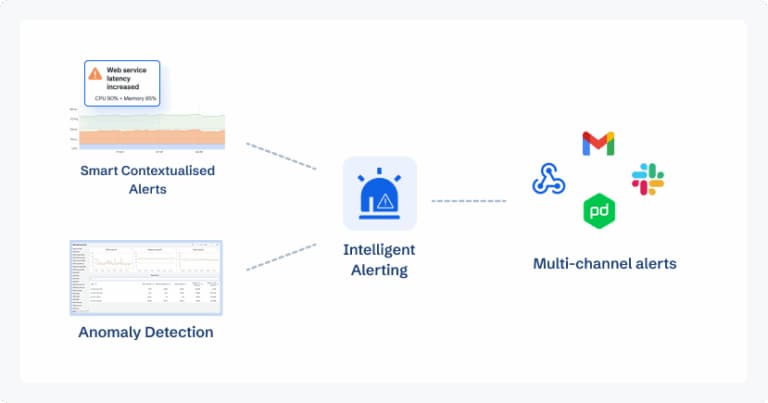
With Docker containers often spinning up and down in seconds, waiting for manual checks is risky. CubeAPM provides real-time alerting on anomalies like CPU throttling, OOMKilled events, or ImagePullBackOff errors. Alerts can be routed directly to Slack, Teams, or PagerDuty, ensuring engineers can respond before small issues escalate into outages.
Predictable Pricing
Unlike many tools that charge per host, per feature, or per error count, CubeAPM uses a $0.15/GB ingestion model. This makes costs predictable — whether you’re monitoring 50 containers or 5,000. For businesses dealing with high-volume logs and traces, this pricing can translate into savings of 60–70% compared to Datadog or New Relic.
Smart Sampling for Cost Efficiency

Container environments generate massive amounts of telemetry. CubeAPM’s Smart Sampling automatically prioritizes high-value data — such as slow traces, error-heavy requests, or unusual latency — while filtering out redundant noise. This means you retain the insights needed for debugging without ballooning your observability bill.
Compliance-Ready by Design
For organizations in regulated industries, CubeAPM offers compliance-ready deployments. Data stays inside your cloud (BYOC or self-hosting) and aligns with data residency requirements. This makes it possible to run sensitive workloads in Docker while meeting strict audit and governance standards.
Step-by-Step: Setting Up Docker Monitoring with CubeAPM
Here’s how you can instrument, configure, and alert on Docker containers using CubeAPM’s documented setup flow.
1. Install CubeAPM Collector
First, you need the CubeAPM server/collector running to receive Docker telemetry. You can install via Docker or Kubernetes (Helm):
- Docker: Use the command from the Install CubeAPM – Docker doc page.
- Kubernetes: Use the CubeAPM Helm chart.
Make sure the collector is reachable via OTLP endpoints (ports 4317, 4318, etc.).
2. Instrument / Configure OpenTelemetry Agents
You must connect your containers (or application code running in containers) to send metrics, logs, and traces to CubeAPM using OpenTelemetry.
- CubeAPM supports full OpenTelemetry integration.
- In your services, add OpenTelemetry SDK / agents and configure them to export OTLP to the collector.
This lets your containers emit telemetry that CubeAPM can consume seamlessly.
3. Configure Infra & Logs Collection
To collect container-level metrics and logs:
- Use CubeAPM’s Infra Monitoring configuration to capture container resource usage, metadata, node/container labels, etc.
- For logs, CubeAPM supports log ingestion via OpenTelemetry, Fluentd, Logstash, Vector, Loki, etc.
- Ensure that logs are in a structured format or JSON to allow better indexing and correlation.
4. Enable Dashboards & Visualizations
Once telemetry flows in, CubeAPM’s default dashboards start showing container CPU, memory, network, restarts, and error views (via infra + logs + trace context). No need to build from scratch.
This gives you out-of-the-box visibility into how your containers behave under load, across failures, or during scaling.
5. Configure Alerting Rules
Set up proactive alerts using CubeAPM’s alerting config:
- Use the Configure → Alerting / Connect with Email page to add notification channels.
- Create rules like: restarts > 5/min, memory usage beyond threshold, or latency crossing SLO.
Alerts can target email, Slack, PagerDuty, etc.
6. Analyze Traces & Bottlenecks
With metrics, logs, and traces all correlated in CubeAPM, you can now trace a failing request across multiple containers. If one container exhibits latency or errors, the trace view shows you the downstream impact and root cause.
Real-World Example: Debugging a Container Crash with CubeAPM
The Challenge
An e-commerce team noticed their order-service container kept restarting during peak traffic. Logs were inconsistent, and docker stats only showed memory usage climbing just before each crash. Engineers suspected a memory leak, but they lacked visibility into which requests or dependencies were triggering it. The instability meant delayed order processing and frustrated customers.
The Solution
The team deployed the CubeAPM OpenTelemetry Collector and began streaming container metrics, logs, and traces into CubeAPM. With CubeAPM’s unified dashboards, they could view memory spikes side by side with restart counts and trace waterfalls. Smart Sampling ensured that even under heavy load, slow and error-heavy traces were preserved for analysis.
The Fixes
By drilling into distributed traces, engineers found that calls to the payment gateway microservice were causing long latencies, which in turn triggered unbounded memory growth inside the order-service container. They fixed the issue by:
- Optimizing the retry logic in the payment service client.
- Increasing the container’s memory request/limit to provide headroom.
- Adding an alert in CubeAPM to flag memory usage exceeding 90% of the limit for >2 minutes.
The Result
With CubeAPM in place, the team reduced OOMKilled events by 80% and restored order throughput to normal levels during peak hours. The proactive alerts now give them early warnings before containers reach critical states. Beyond fixing the memory leak, they also gained full-stack visibility — from container resource usage to user-facing latency — ensuring faster response to future issues.
Verification Checklist & Example Alert Rules for Monitoring Docker Containers with CubeAPM
Verification Checklist
- Metrics ingestion verified: CPU, memory, disk I/O, and network metrics from all containers are visible in CubeAPM dashboards.
- Logs collected: Application logs (stdout/stderr) and Docker events are flowing into CubeAPM’s log explorer.
- Traces stitched: End-to-end request traces across containers and services are captured and viewable in trace waterfalls.
- Health signals tracked: Container restarts, exit codes, and OOMKilled/ImagePullBackOff events are showing up in metrics or events view.
- Dashboards and alerts tested: Pre-built dashboards load correctly, and test alerts trigger when conditions are simulated.
Example Alert Rules
High Memory Usage
alert: HighMemoryUsage
expr: container_memory_usage_bytes / container_spec_memory_limit_bytes > 0.9
for: 2m
labels:
  severity: warning
annotations:
  summary: "High memory usage in Docker container"
  description: "Container {{ $labels.container }} is using >90% of its memory limit for over 2 minutes."
CrashLoopBackOff Detection
alert: ContainerCrashLoopBackOff
expr: kube_pod_container_status_waiting_reason{reason="CrashLoopBackOff"} > 0
for: 5m
labels:
  severity: critical
annotations:
  summary: "Container in CrashLoopBackOff"
  description: "Container {{ $labels.container }} in pod {{ $labels.pod }} is in CrashLoopBackOff for more than 5 minutes."
ImagePullBackOff Detection
alert: ImagePullBackOff
expr: kube_pod_container_status_waiting_reason{reason="ImagePullBackOff"} > 0
for: 3m
labels:
  severity: warning
annotations:
  summary: "Image pull failure"
  description: "Container {{ $labels.container }} in pod {{ $labels.pod }} failed to pull its image (ImagePullBackOff) for 3+ minutes."
These examples use Kubernetes metrics (via kube-state-metrics + OpenTelemetry), which CubeAPM integrates natively. They address the most common Docker container failure modes in production.
For routing these alerts to Slack, Teams, PagerDuty, or email, refer to the CubeAPM alerting docs.
Conclusion: Smarter Docker Monitoring with CubeAPM
Monitoring Docker containers is no longer optional. Their short lifecycles, dynamic scaling, and complex dependencies make visibility essential for keeping applications reliable, secure, and cost-efficient.
CubeAPM brings clarity by unifying container metrics, logs, and traces into one platform. With smart sampling, real-time alerts, and predictable flat-rate pricing, teams gain both technical depth and financial control. Compliance-ready deployments ensure businesses in regulated industries stay audit-proof.
Don’t let container blind spots slow your growth. Book a free demo with CubeAPM today and start monitoring Docker containers the smarter way.
Disclaimer: The information in this article reflects the latest details available at the time of publication and may change as technologies and products evolve.
FAQs
1. Can Docker containers be monitored without Kubernetes?
Yes, Docker containers can be monitored directly using tools like Docker’s own APIs or with an OpenTelemetry collector. While Kubernetes adds orchestration-level signals, standalone Docker workloads still expose CPU, memory, logs, and events that CubeAPM can collect and analyze.
2. How do you monitor Docker container network traffic?
Network monitoring involves tracking bytes sent/received, open connections, and error rates. Tools integrated with CubeAPM can capture these metrics to identify bottlenecks, noisy neighbors, or potential security risks such as unusual outbound spikes.
3. What’s the difference between container monitoring and host monitoring?
Host monitoring focuses on the underlying VM or server (CPU load, disk pressure, node availability), while container monitoring drills into individual workloads (per-container memory, restarts, exit codes). For complete visibility, both layers should be monitored together.
4. How do you troubleshoot a Docker container that keeps stopping?
First, check exit codes (docker inspect), then review logs for application errors. Monitoring tools like CubeAPM can correlate restarts with memory or CPU spikes, making it easier to pinpoint whether the issue is resource pressure, misconfigurations, or bad images.
5. Can monitoring help optimize Docker resource allocation?
Absolutely. By tracking real usage vs. allocated limits, monitoring reveals over-provisioned containers that waste resources or under-provisioned ones at risk of OOMKilled events. CubeAPM dashboards highlight these inefficiencies so you can fine-tune limits and cut cloud costs.


