Monitoring containerd runtimes is essential as containers now power nearly every cloud-native stack. The 2025 CNCF survey shows organizations running an average of 2,341 containers, double from 2023, underscoring the scale and need for runtime observability.
For most teams, containerd runtime errors are hard to see due to OOM kills, image pull failures, and start delays rarely surfacing in standard Kubernetes metrics. Without visibility into these runtime signals, troubleshooting takes longer, SLAs suffer, and costs escalate.
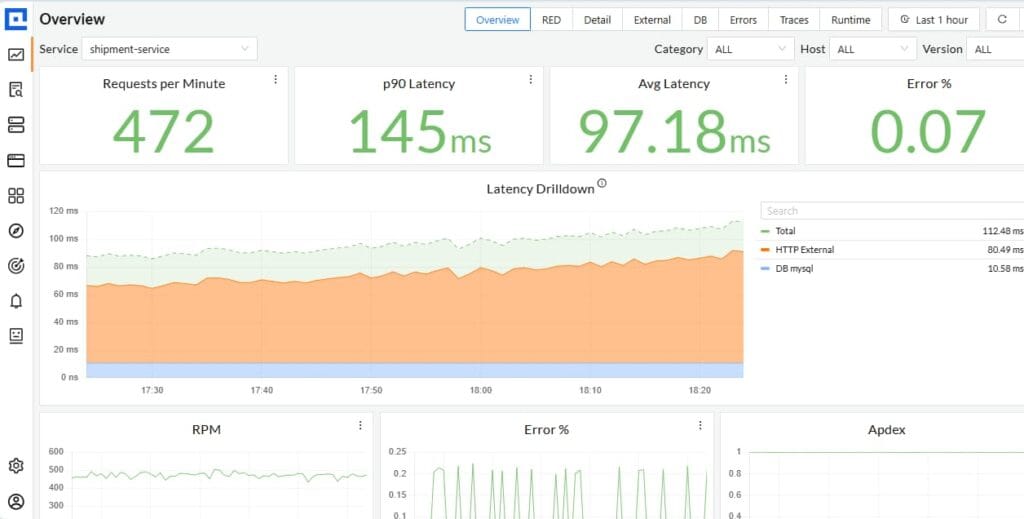
CubeAPM is the best solution for monitoring containerd runtimes, combining metrics, logs, and error tracing in one platform. With native OpenTelemetry ingestion, CubeAPM correlates runtime events with traces and dashboards, helping teams resolve issues faster and at lower cost.
In this article, we’ll cover what containerd runtimes are, why monitoring containerd runtimes is important, the key metrics, and how CubeAPM enables runtime monitoring at scale.
What are Containerd Runtimes?

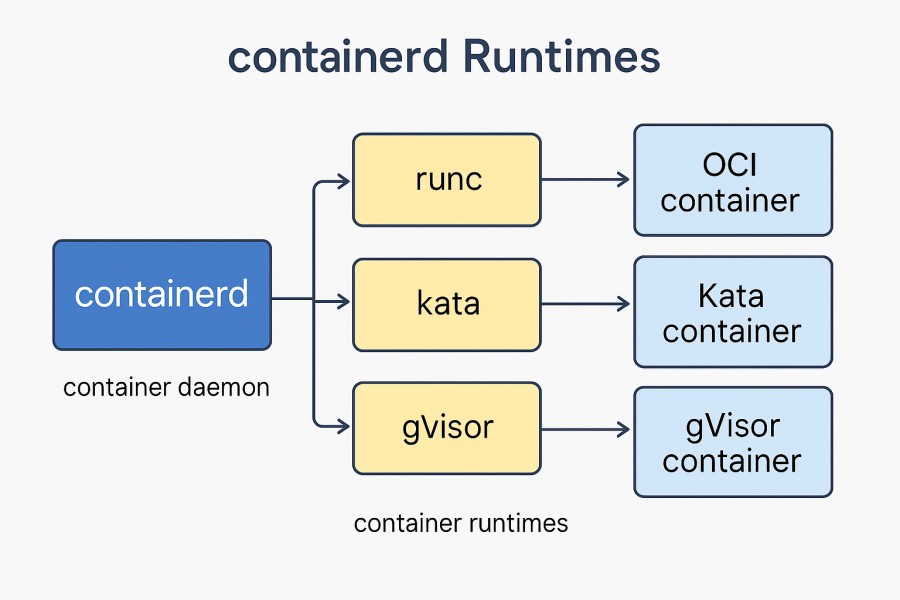
Containerd is a CNCF-graduated container runtime that handles the low-level operations needed to run containers efficiently. It manages the container lifecycle, including pulling and unpacking images, starting and supervising containers, and cleaning up resources. Unlike Docker’s runtime, Containerd is slim, standards-driven, and plugs directly into Kubernetes through the Container Runtime Interface (CRI).
For businesses, Containerd provides clear advantages:
- Performance at scale: Minimal overhead enables faster container startup times and better resource efficiency.
- Ecosystem support: Widely adopted across Kubernetes distributions and cloud providers.
- Interoperability: Works with any OCI-compliant image, avoiding vendor lock-in.
- Reliability: Streamlined integration with Kubernetes ensures fewer moving parts and stronger cluster stability.
Example: Monitoring Containerd in a FinTech Trading Platform
A FinTech company running high-frequency trading services on Kubernetes noticed sporadic latency spikes during market open hours. By monitoring Containerd runtime metrics, the team identified container start delays tied to image pulls. With runtime visibility, they pre-fetched critical images and adjusted resource allocation—reducing startup latency by 60% and ensuring uninterrupted trading performance.
Why Monitoring Containerd Runtimes Is Important
Image pull failures & latency are stealth attackers

In real environments, teams frequently encounter container startup delays or failures due to image registry throttling, network timeouts, or auth issues. If you don’t monitor Containerd’s image pull duration, retry counts, and error codes, these manifest as mysterious slow pods or CrashLoopBackOffs. In articles about monitoring Containerd, it’s common to see metrics like container_runtime_image_pull_duration_seconds and pull failures as early indicators.
Visibility into the true runtime layer
Kubernetes and node metrics only show you the “shell” of what’s happening—Containerd is where image pulls, container start/stop, lifecycle events, and shim processes actually run. Without runtime-level observability, hidden failures (e.g., pull stalls, shim crashes, exit codes) become “mystery incidents” that evade diagnosis.
The cost of not seeing is real
When runtime issues propagate silently, they cause downtime, SLA breaches, customer impact, and lost revenue. The ITIC 2024 report shows that over 90% of organizations estimate downtime costs above $300,000 per hour, and 41% place it between $1M–$5M per hour. Monitoring Containerd-level faults early is a strong hedge against these massive losses.
OOM kills, resource pressure, and misallocation surface at runtime
Memory limits and cgroup enforcement are handled at the runtime boundary. Containerd emits events related to OOM kills, container restarts, CPU throttling, and memory pressure. Monitoring these event streams lets you distinguish application bugs from misallocation at the runtime layer—a critical distinction in production.
Containers are ephemeral—losing data is easy
Because containers live and die quickly, it’s easy to miss events or logs if your monitoring isn’t real-time and runtime-aware. Traditional tools often lose context once a container is torn down. Observability tools must auto-discover newly started containers, persist event context, and capture short-lived runtime signals.
Scaling demands and complexity multiply risks
In large Kubernetes clusters, churn is constant: containers spin up, scale out, and get replaced. The 2024 CNCF Annual Survey found that containers continue to grow in production use, with 91% of organizations using containers in production, and the average number of containers per organization rising to 2,341 in 2024, up from ~1,140 in 2023. As scale rises, hiding runtime faults becomes riskier—small failures accumulate into outages.
Community demand and gaps in existing tooling
Dev teams migrating to Containerd often discover that many exporters lack deep task/event coverage. Community forums and Prometheus discussions indicate frustration over missing containerd-specific metrics and exit codes. This demand shows practitioners know they need deeper signals than just node/container summaries.
Key Metrics and Signals to Monitor in Containerd
Monitoring Containerd is not just about keeping an eye on containers—it’s about capturing the runtime-level signals that directly affect startup, performance, and stability. Below are the core categories and metrics to track for Containerd runtimes.
Container Lifecycle Events
Lifecycle events tell you how containers are created, started, stopped, and deleted. They are the first place to look when debugging pod churn or failures.
- Container Start Events: Track how often containers successfully start. A rise in failed starts may indicate misconfigurations or runtime limits. Threshold: Investigate if more than 5% of container starts fail in a given namespace.
- Container Stop Events: Monitor frequent stops, which could signal OOM kills or crashing processes. Threshold: Alert if >3 container stops per minute for the same service.
- Container Delete Events: Capture deletions to confirm scaling or clean-up behavior is working as expected. Threshold: Alert if deletions exceed scaling expectations by 20%.
Image Management
Image pulls and unpacking are frequent bottlenecks. Monitoring these signals helps pinpoint startup latency and registry issues.
- Image Pull Duration: Measures the time to fetch and unpack images. Long durations usually point to registry throttling or network bottlenecks. Threshold: Alert if p95 pull time >10 seconds.
- Image Pull Failures: Track authentication failures, rate limits, or missing images. These failures often delay deployments. Threshold: Alert if >5 failures within 10 minutes.
- Image Size and Cache Hits: Large images or low cache hit rates cause slow starts. Monitoring these reveals optimization opportunities. Threshold: Alert if cache hit ratio drops below 80%.
Resource Utilization
Containerd enforces cgroups, so watching runtime resource metrics shows when workloads are constrained or misconfigured.
- CPU Throttling: Indicates processes hitting CPU quotas. Sustained throttling leads to latency spikes. Threshold: Alert if throttling >20% over 5 minutes.
- Memory Usage and OOM Kills: Track usage vs. limits; OOM events are runtime-level failures that restart containers. Threshold: Alert if any service records >3 OOM kills in 15 minutes.
- Disk I/O Latency: High I/O delays slow down container startup and operations. Threshold: Alert if disk latency exceeds 50 ms for container tasks.
Task Runtime Logs
Logs from Containerd tasks provide low-level insights that complement Kubernetes logs. They highlight runtime execution issues.
- Stdout/Stderr Logs: Collect output directly from running containers to debug application or runtime crashes. Threshold: Alert if error log rate exceeds 50 entries per minute.
- Shim Errors: Containerd uses shims to manage containers; shim crashes can halt workloads. Threshold: Alert if shim errors exceed 2 in 10 minutes.
- Exit Codes: Exit codes reveal why a container terminated—crash, signal, or manual stop. Threshold: Alert if non-zero exit codes occur >10% of container stops.
Network Performance
Since Containerd handles networking setup for containers, failures here impact service connectivity.
- DNS Resolution Failures: Monitor task-level DNS errors that delay startup. Threshold: Alert if >5% of lookups fail in 10 minutes.
- Ingress/Egress Traffic: Track bytes transferred per container to identify noisy neighbors or bottlenecks. Threshold: Alert if traffic deviates >30% from baseline unexpectedly.
- Connection Errors: Monitor dropped or refused connections at runtime. Threshold: Alert if errors exceed 100 per minute for critical services.
Security and Compliance Signals
Runtime security events often surface at the Containerd layer, making them critical for regulated industries.
- Unexpected Syscalls: Detect suspicious or disallowed syscalls, often an indicator of intrusion. Threshold: Alert if any unauthorized syscall is detected.
- Sandbox Violations: Identify workloads escaping expected runtime constraints. Threshold: Trigger alerts immediately on violation.
- Privileged Container Launches: Track when containers run with elevated privileges. Threshold: Alert on every privileged container event unless explicitly whitelisted.
How to Monitor Containerd Runtime with CubeAPM
To get runtime observability into Containerd with CubeAPM, here are the steps you should follow—from installation to alerting.
1. Install CubeAPM into your environment
Install the CubeAPM backend (if not already) using one of the supported deployment modes. CubeAPM supports bare metal / VMs, Docker, and Kubernetes. If you’re using Kubernetes, deploy via Helm:
- Add the CubeAPM Helm repo:
helm repo add cubeapm https://charts.cubeapm.com
helm repo update cubeapm
- Pull default values and customize:
helm show values cubeapm/cubeapm > values.yaml - Edit values.yaml as needed (storage, ingress, etc.), then install or upgrade:
helm install cubeapm cubeapm/cubeapm -f values.yaml
# or upgrade if exists
helm upgrade cubeapm cubeapm/cubeapm -f values.yaml
2. Configure CubeAPM core settings
Before you begin telemetry ingestion, configure CubeAPM via CLI args, config file, or environment variables. Use the CUBE_ prefix for env-vars (replace dots and dashes with underscores).
Essential parameters include:
- token (your CubeAPM authentication token)
- auth.key.session (session encryption key)
You may also override defaults like base-url, time-zone, and cluster.peers if needed.
3. Instrument your applications (and runtime) with OpenTelemetry
CubeAPM supports OpenTelemetry natively, so your application and infrastructure agents can send traces, metrics, and logs via OTLP.
For Containerd runtime signals, set up the OpenTelemetry Collector (or agents) to scrape CRI/runtime metrics and forward them to CubeAPM’s metrics endpoint.
4. Enable infra monitoring for Kubernetes + runtime
CubeAPM’s Infra Monitoring module supports Kubernetes and container runtimes. The recommended deployment is via the OpenTelemetry Collector in both daemonset and deployment modes to collect node and runtime metrics.
In your OTel Collector config, you’ll enable metrics export to CubeAPM’s metrics ingestion endpoint (for example, via OTLP/HTTP).
5. Ingest logs from Containerd and shim processes
CubeAPM supports aggregating logs from many sources—using agents like Fluentd, Logstash, OpenTelemetry, or Vector.
Ensure logs contain structured fields (flatten nested JSON) so fields like trace_id, service, host.name are indexed and searchable.
6. Build dashboards, correlate data, and refine thresholds
Once metrics, logs, and traces flow in, create dashboards for your key Containerd metrics (pull latency, OOM kills, start failure rates). Use the correlation between traces and runtime events to pinpoint issues. Refine alert thresholds based on historical baseline, then iterate.
7. Alerts & Automated Response (Optional)
CubeAPM lets you set up automated alerts on Containerd runtime health. Here are three useful examples:
Alert for OOM Kills (Out of Memory Events)
Use this rule to detect when too many containers are being killed due to memory exhaustion.
alert: ContainerdOOMKills
expr: increase(container_oom_events_total[5m]) > 3
for: 5m
labels:
  severity: critical
annotations:
  description: "High number of OOM kills detected in Containerd runtime over the last 5 minutes."
Alert for Image Pull Latency
This rule notifies you when pulling container images takes unusually long, which could delay pod startup.
alert: ContainerdImagePullLatency
expr: histogram_quantile(0.95, rate(container_runtime_image_pull_duration_seconds_bucket[5m])) > 10
for: 10m
labels:
  severity: warning
annotations:
  description: "95th percentile of Containerd image pull duration exceeded 10 seconds."
Alert for Container Start Failures
Use this rule to track repeated container start failures, often a symptom of misconfigurations or resource limits.
alert: ContainerdStartFailures
expr: increase(container_start_failures_total[10m]) > 5
for: 10m
labels:
  severity: warning
annotations:
  description: "Excessive container start failures detected in Containerd runtime over the last 10 minutes."
Why CubeAPM is the Best Choice for Containerd Monitoring
CubeAPM is designed to make runtime observability simple, scalable, and affordable—without the trade-offs enterprises usually face with older APM platforms.

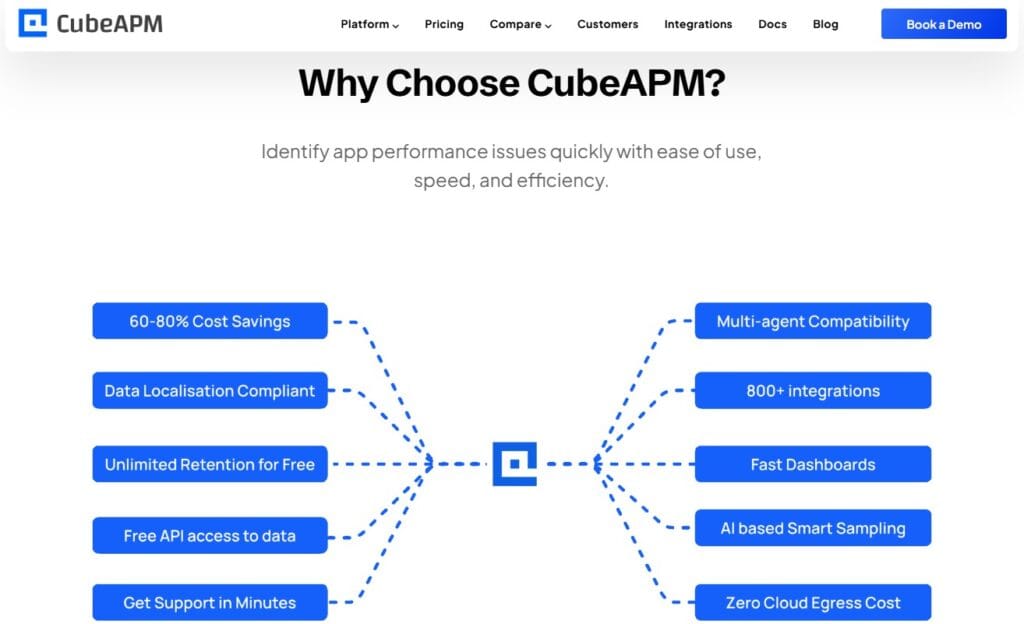
- Predictable $0.15/GB pricing: Instead of complex host-based or feature-based billing, CubeAPM charges a single transparent rate for all data ingested. This model ensures teams can expand monitoring—logs, metrics, or traces—without worrying about sudden cost spikes.
- 800+ integrations across CRI, Kubernetes, Docker, and cloud services: CubeAPM fits easily into modern cloud-native stacks. From container runtimes and orchestrators to databases and public cloud providers, these integrations shorten setup time and deliver instant visibility across environments.
- Flexible deployment: self-hosting & BYOC options: Unlike tools that force you onto their SaaS, CubeAPM lets you host it yourself or run it in your own cloud account. This keeps sensitive runtime telemetry in your control while avoiding vendor lock-in.
- Built-in compliance with HIPAA, GDPR, and India DPDP: Data security and localization are critical for regulated industries. CubeAPM helps organizations meet global compliance mandates by keeping telemetry within approved regions and clouds.
- Native OpenTelemetry with smart sampling: CubeAPM ingests runtime traces, metrics, and logs natively via OpenTelemetry. Its smart sampling engine retains high-value events (errors, latency spikes, anomalies) while filtering noise, giving teams deep visibility without overwhelming storage or budgets.
Real-World Example: Monitoring a Logistics Platform with CubeAPM
Challenge: Pod restarts from OOM kills
A logistics platform running thousands of microservices on Kubernetes began experiencing frequent pod restarts during peak traffic. The root cause was elusive—application logs didn’t explain why containers were terminating, and Kubernetes events only showed generic crash loops. Engineers suspected resource pressure, but without Containerd runtime visibility, they lacked clear evidence.
Solution: Ingested Containerd events and node metrics into CubeAPM
The team deployed CubeAPM with OpenTelemetry collectors to capture Containerd’s runtime events (container_start, container_exit, and oom_kill) alongside node-level metrics. By correlating these with application traces, CubeAPM provided a full view of when and why containers were being killed. This bridged the gap between Kubernetes health and runtime behavior, pinpointing OOM events at the Containerd layer.
Fixes: Adjusted memory allocation and caching
Armed with concrete metrics, engineers optimized memory requests and limits for critical workloads and fine-tuned caching strategies to reduce memory spikes. CubeAPM’s dashboards highlighted services with the most OOM events, allowing the team to target fixes instead of blindly over-provisioning.
Result: 30% fewer restarts, improved SLA compliance
Within weeks, the platform recorded a 30% reduction in pod restarts, significantly stabilizing delivery APIs during high-demand windows. SLA compliance improved, and incident response times dropped because engineers could now see runtime-level causes immediately. By continuously monitoring Containerd with CubeAPM, the logistics company built a more resilient, cost-efficient Kubernetes operation.
Best Practices for Monitoring Containerd Runtime
Following proven practices ensures that Containerd monitoring not only detects runtime issues quickly but also keeps your Kubernetes workloads stable, secure, and cost-efficient.
- Collect structured JSON logs: Capture Containerd logs in JSON format so fields like container_id, image, and exit_code are indexed and searchable, making troubleshooting faster.
- Tier data retention: Keep around 30 days of hot data for immediate investigations and 180+ days in cold storage for compliance, balancing speed and storage cost.
- Define SLIs and SLOs: Set clear indicators such as image pull latency, OOM kill frequency, and container start success ratio with objectives tied to uptime and reliability.
- Tag and label workloads: Apply consistent Kubernetes labels to separate runtime metrics by team, project, or environment, reducing noise and improving accountability.
- Integrate runtime with security scans: Pair monitoring with image vulnerability scanning and syscall anomaly detection to protect against exploits and misconfigurations.
- Automate alerts wisely: Tune thresholds for OOM kills, image pull failures, and container start errors. Ensure alerts are actionable and mapped to business impact to avoid fatigue.
Conclusion
Monitoring Containerd runtimes is no longer optional—it’s essential. As the backbone of Kubernetes, Containerd controls container lifecycle, image pulls, and runtime execution. Without visibility into these layers, teams risk downtime, costly delays, and blind spots in performance.
CubeAPM closes this gap by unifying metrics, logs, and traces from Containerd runtimes with application and infrastructure signals. From OOM kills to image pull latency, CubeAPM surfaces the events that matter, correlates them with business impact, and helps teams act faster.
By adopting CubeAPM, organizations gain reliable runtime observability, cost efficiency, and compliance readiness. Start monitoring Containerd runtimes with CubeAPM today—book a demo or try it in your environment.
Disclaimer: The information in this article reflects the latest details available at the time of publication and may change as technologies and products evolve.
FAQs
1. Does monitoring Containerd runtimes add extra overhead to my Kubernetes cluster?
When done with lightweight collectors like OpenTelemetry, the overhead is minimal. Metrics and logs are streamed efficiently, and with smart sampling (as in CubeAPM), you can control data volume while keeping key events.
2. Can I monitor Containerd runtimes without Kubernetes?
Yes. Containerd is also used directly on VMs and edge devices. You can still collect lifecycle events, logs, and metrics from the runtime, though most integrations (like CRI) are tuned for Kubernetes.
3. How is monitoring Containerd different from Docker runtime monitoring?
Docker uses Containerd internally, but Kubernetes integrates directly with Containerd via CRI. Monitoring Containerd gives you lower-level visibility into container lifecycle and performance, which Docker’s higher-level runtime may abstract away.
4. What tools integrate natively with Containerd monitoring?
OpenTelemetry, Prometheus, and Fluentd have exporters and plugins for Containerd. Platforms like CubeAPM extend this by correlating runtime signals with application traces and infrastructure metrics.
5. Is it possible to detect security threats by monitoring Containerd runtimes?
Yes. By tracking syscalls, sandbox violations, and privileged container launches, you can flag suspicious runtime activity early. Combining these with vulnerability scans strengthens the runtime security posture.


