










Monitoring legacy .NET applications built on WCF and ASP.NET Web Forms presents a distinct challenge. These frameworks predate modern observability standards like OpenTelemetry, yet they still power mission-critical systems across finance, healthcare, and enterprise software. According to the CNCF Annual Survey 2024, 34% of organizations still run production workloads on frameworks older than five years, with .NET Framework 4.x and earlier representing a significant portion of that legacy footprint.
This guide covers how APM works for WCF services and ASP.NET Web Forms applications, what metrics matter, the instrumentation options available, and how to choose the right monitoring approach whether you are stuck on .NET Framework 4.8 or planning a gradual migration to .NET Core.
What Is Legacy .NET APM and Why It Matters?
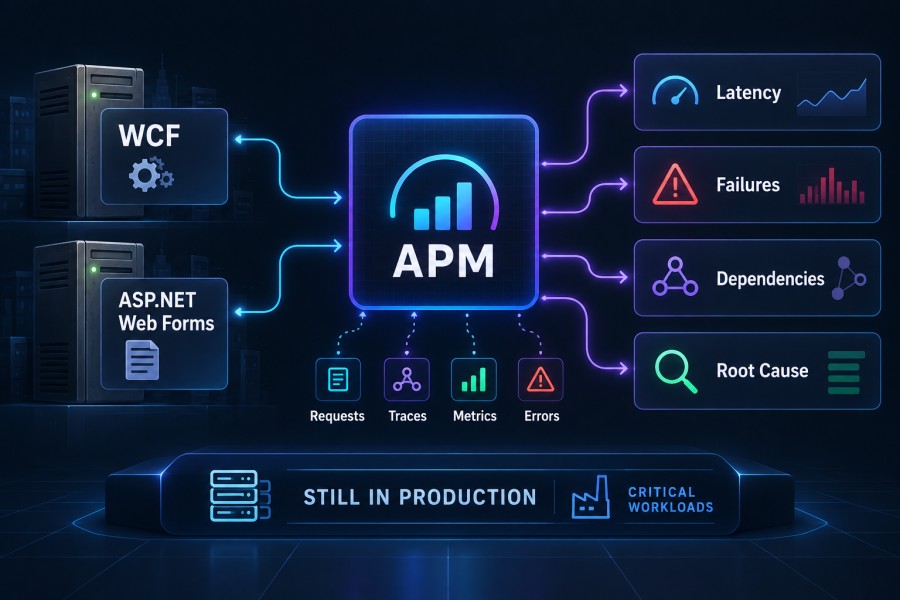
Application Performance Monitoring for legacy .NET means tracking the runtime behavior of applications built on .NET Framework 2.0 through 4.8 that rely on older web service architectures like Windows Communication Foundation and presentation frameworks like ASP.NET Web Forms.
These applications were built before distributed tracing, structured logging, and containerized infrastructure became standard. They run on IIS, communicate via SOAP and XML-based endpoints, and often depend on tightly coupled database layers with heavy use of stored procedures and inline SQL.
The monitoring challenge is threefold. First, these frameworks lack native OpenTelemetry instrumentation, so you must rely on CLR profiling, IIS module injection, or manual instrumentation. Second, WCF services often implement complex binding configurations (basicHttpBinding, wsHttpBinding, netTcpBinding) with varying transport and encoding settings that each introduce latency in different ways. Third, Web Forms page lifecycle events are opaque to most modern APM tools unless you instrument specific lifecycle hooks like PreRender, Load, and Init.
Without proper APM, a slow WCF service call to a remote dependency can degrade an entire request pipeline for minutes before anyone notices. With APM, the same issue triggers an alert, surfaces the binding configuration causing the bottleneck, and traces the call across IIS, the WCF stack, and the database layer in one unified view.
Legacy .NET applications are not going away soon. Many organizations run decade-old codebases that generate revenue and cannot be rewritten overnight. Monitoring them effectively is not optional.
How APM Works for WCF and ASP.NET Web Forms
APM tools monitor legacy .NET applications by injecting instrumentation into the CLR (Common Language Runtime) at process startup or by attaching to IIS as an HTTP module. The instrumentation intercepts method calls, measures execution time, captures exceptions, and correlates database queries with the originating web request or WCF service invocation.
For WCF services, APM agents hook into the channel stack where messages are serialized, deserialized, and dispatched to service implementations. This allows the agent to measure time spent in serialization (XML to object conversion), transport (HTTP or TCP), and service method execution separately.
For ASP.NET Web Forms, the agent instruments the page lifecycle pipeline. It tracks time spent in Init, Load, PreRender, and Render events, measures ViewState size and serialization overhead, and correlates postback events with their originating controls.
Most enterprise APM platforms (Datadog, New Relic, Dynatrace) use CLR profiling APIs to inject instrumentation without requiring code changes. The profiler attaches to the w3wp.exe worker process at startup, rewrites method IL (Intermediate Language) on the fly, and begins capturing telemetry automatically.
Self-hosted or open-source tools like Elastic APM and CubeAPM offer similar profiling-based instrumentation but give you the option to run the APM backend inside your own infrastructure rather than sending telemetry to an external SaaS platform.
The result is distributed traces that show request flow from IIS through WCF bindings, across service boundaries, into database queries, and back to the client with latency broken down by layer.
Key Metrics to Monitor in Legacy .NET Applications
Monitoring legacy .NET requires tracking metrics at three layers: IIS and the hosting environment, the application runtime (CLR and garbage collection), and the framework-specific behavior of WCF and Web Forms.
IIS and Hosting Metrics
Application pool recycling events indicate memory pressure or configuration issues. Frequent restarts suggest a memory leak or misconfigured idle timeout. Request queue length shows how many HTTP requests are waiting for an available worker thread. High queue depth means thread starvation and slow response times. Worker process CPU and memory track resource consumption per application pool. Sustained high CPU often points to inefficient code or unoptimized database queries.
CLR and Garbage Collection Metrics
Gen 2 garbage collection frequency indicates memory churn. Frequent Gen 2 collections suggest large object allocations or failure to dispose IDisposable resources like database connections and WCF client proxies. Time spent in GC as a percentage of total CPU shows how much runtime overhead comes from memory management rather than useful work. Thread pool utilization tracks available worker threads versus queued work items. Exhausted thread pools cause request timeouts and degraded throughput.
WCF Specific Metrics
Service call duration broken down by binding type reveals which WCF endpoints are slow. A wsHttpBinding endpoint with message-level security will always be slower than a basicHttpBinding endpoint without encryption. Fault rate per operation tracks how often WCF service methods throw FaultExceptions versus succeeding. Message size and serialization time show overhead from large XML payloads or deeply nested object graphs being serialized to SOAP messages.
ASP.NET Web Forms Specific Metrics
Page load time end to end measures the full request lifecycle from Init through Render. ViewState size tracks how much state is being serialized and sent to the client. Large ViewState (over 100 KB) slows page rendering and increases bandwidth. Postback frequency and duration show how often users trigger server round trips and how long each postback takes to process.
All of these metrics should be tracked in real time and retained long enough to identify trends over weeks and months. A gradual increase in Gen 2 GC frequency over three months is a signal that a memory leak exists even if no single request appears slow.
Instrumentation Options for Legacy .NET APM
You have four primary ways to instrument legacy .NET applications for APM: CLR profiling agents, manual instrumentation via APIs, IIS HTTP modules, and log-based correlation.
CLR Profiling Agents
This is the most common approach. The APM vendor provides an agent (typically a native DLL) that uses the .NET Profiling API to attach to the CLR at process startup. The agent rewrites method IL to inject timing and tracing logic without modifying your source code. Datadog, New Relic, Dynatrace, Elastic APM, and CubeAPM all support CLR profiling for .NET Framework 4.x and earlier. The advantage is zero code changes required. The disadvantage is that you depend on the vendor to support the specific framework version, binding type, and third-party library your application uses.
Manual Instrumentation via APM SDKs
If the profiling agent misses specific WCF bindings or custom handlers, you can instrument manually using the APM vendor’s SDK. This involves adding tracing code at service entry points, around database calls, and within custom business logic. Manual instrumentation gives you full control over what gets traced but requires code changes and increases maintenance burden.
IIS HTTP Modules
Some APM tools inject themselves as HTTP modules in the IIS request pipeline. The module captures request start and end times, HTTP headers, status codes, and exceptions. This approach works well for ASP.NET Web Forms but provides limited visibility into WCF services that use non-HTTP bindings like netTcpBinding or netNamedPipeBinding.
Log-Based Correlation
If deploying an agent is not feasible due to compliance or infrastructure constraints, you can use structured logging with correlation IDs to manually trace requests across services. This requires logging at every layer (IIS, WCF service methods, database calls) and correlating logs using a shared request ID. Tools like infrastructure monitoring platforms can aggregate these logs and surface request flows, though without the automatic trace correlation that a profiling agent provides.
Most teams running legacy .NET in production use a CLR profiling agent as the foundation and add manual instrumentation only where needed to capture custom business metrics.
Best Practices for Monitoring WCF Services
WCF services present unique monitoring challenges because of their binding diversity, contract complexity, and tight coupling with IIS or Windows Services as hosting environments.
- Start by instrumenting every service operation at the operation contract level. This means capturing entry and exit points for every method decorated with [OperationContract]. Measure duration, capture input parameters when safe (avoid logging sensitive data), and track fault exceptions separately from unhandled exceptions.
- Monitor binding-specific behavior separately. A basicHttpBinding endpoint should respond in milliseconds. If it takes seconds, the problem is likely in service implementation or database calls, not transport overhead. A wsHttpBinding endpoint with message security enabled will add 50 to 200 milliseconds of encryption overhead per call. If your wsHttpBinding response times suddenly jump by 500 milliseconds, the issue is not encryption but something downstream.
- Track client proxy creation and disposal. Many WCF performance problems stem from developers creating a new ChannelFactory or client proxy for every call instead of reusing a pooled instance. Monitor the rate of proxy creation. If it matches or exceeds your request rate, client proxy reuse is broken.
- Set up alerts on fault rate per operation. A 5% fault rate might be acceptable for a non-critical batch operation but is catastrophic for a payment processing endpoint. Define SLOs (Service Level Objectives) per operation and alert when fault rate or latency violates those thresholds.
- Correlate WCF telemetry with IIS and database metrics. A slow WCF call might be caused by thread pool exhaustion in IIS, a slow SQL query, or network latency to a remote dependency. Use distributed tracing to see the full request path and isolate the bottleneck.
- Use synthetic monitoring tools to continuously test critical WCF endpoints from multiple locations. Synthetic tests catch availability issues and SLA violations before real users are impacted.
Best Practices for Monitoring ASP.NET Web Forms
Web Forms applications have a synchronous server-side rendering model that makes certain performance problems invisible to request-level metrics alone.
- Instrument the page lifecycle explicitly. Most APM agents capture overall page render time but do not break it down by lifecycle event. Add custom instrumentation to measure time spent in Page_Load, PreRender, and data binding operations separately. This tells you whether slowness comes from database queries during Load or from complex rendering logic in PreRender.
- Monitor ViewState size per page. Large ViewState increases page weight, slows initial render, and consumes bandwidth. Set an alert if ViewState exceeds 50 KB on any page. Investigate pages that consistently generate ViewState over 100 KB as candidates for optimization or migration to AJAX patterns.
- Track postback frequency and duration per page. Pages with frequent postbacks and slow server processing create a poor user experience. If a page averages 8 postbacks per user session and each postback takes 2 seconds, users spend 16 seconds waiting. That is a migration candidate or a place to introduce client-side validation and caching.
- Capture unhandled exceptions in Global.asax Application_Error. Log the exception, the originating page, the user session ID, and the request URL. Correlate exceptions with APM traces to see what the application was doing when the error occurred.
- Monitor session state size and storage mode. If session state is stored in SQL Server or a state server, track the latency of session retrieval. Slow session access degrades every request. If session state is stored in process, monitor w3wp.exe memory usage. Large in-process session state contributes to memory pressure and frequent application pool restarts.
- Use Real User Monitoring (RUM) to track client-side page load time, time to first byte, and DOM rendering time. Server-side APM shows how fast the server responds. RUM shows how fast the page actually renders in the user’s browser.
Tools and Implementation: APM Platforms for Legacy .NET
Several APM platforms provide strong support for .NET Framework, WCF, and ASP.NET Web Forms. The right choice depends on whether you need SaaS hosted monitoring, self-hosted control, or full OpenTelemetry compatibility for future migrations.
CubeAPM
CubeAPM is a self-hosted, OpenTelemetry native observability platform that runs inside your own cloud or data center. It supports .NET Framework 4.x instrumentation via CLR profiling and OpenTelemetry-compatible agents. CubeAPM tracks distributed traces across WCF services, ASP.NET Web Forms pages, and downstream dependencies like SQL Server and external HTTP calls.
Pricing is $0.20/GB of ingested telemetry with unlimited retention and no per-user seat fees. For teams with data residency requirements or running regulated workloads, CubeAPM keeps all telemetry data inside your infrastructure while providing managed APM capabilities without the operational overhead of self-hosting Elastic or building a custom Grafana stack.
Datadog
Datadog offers a fully managed APM platform with strong .NET Framework support. Its CLR profiler instruments WCF services and Web Forms applications automatically. Datadog APM pricing starts at $31 per host per month for 15 months of retention. A 50-host deployment with WCF services and databases runs approximately $1,550/month before adding logs, custom metrics, or Real User Monitoring. Datadog integrates with over 700 services, including IIS, SQL Server, and Azure infrastructure. The main cost driver is per-host pricing that scales linearly with infrastructure size.
New Relic

New Relic provides a .NET agent with native WCF and Web Forms instrumentation. Pricing is consumption-based using a Compute Capacity Unit (CCU) model. For legacy .NET workloads with moderate telemetry volume, expect costs around $0.30 to $0.50 per GB of ingested data plus $99 per full platform user per month. New Relic excels at correlating application telemetry with infrastructure and logs in a single platform but locks you into its proprietary NRQL query language.
Elastic APM
Elastic APM is part of the Elastic Stack. It provides a .NET agent that instruments WCF and ASP.NET via CLR profiling. Elastic APM is free to use with the open-source Elastic Stack. Managed Elastic Cloud starts at $99/month for basic tiers. Elastic gives you full control over data retention and query performance but requires you to manage Elasticsearch clusters, scale storage, and tune indexing. For teams already running the ELK stack, adding APM is straightforward. For teams without Elastic experience, the operational overhead is significant.
Dynatrace
Dynatrace offers automated instrumentation for .NET Framework with AI-powered root cause analysis. Pricing starts at approximately $0.08 per host hour (roughly $58/host/month) with additional charges for synthetic monitoring and session replay. Dynatrace is strong at auto-discovering service dependencies and anomaly detection, but pricing scales aggressively with the number of monitored hosts and features enabled.
All platforms above support WCF and Web Forms. The decision comes down to deployment model (SaaS vs. self-hosted), cost structure (per host vs. per GB vs. per user), and whether you need data residency or OpenTelemetry portability.
Monitoring Legacy .NET in Hybrid and Migration Scenarios
Many teams are not running pure legacy .NET environments. Instead, they operate hybrid stacks where WCF services talk to .NET Core APIs, or where Web Forms pages call serverless functions in Azure.
In these scenarios, distributed tracing becomes critical. A single user request might start in a Web Forms page, make a WCF service call, which in turn calls a .NET Core API hosted in Kubernetes, which queries a PostgreSQL database in AWS RDS.
To trace this flow, you need an APM platform that supports both legacy .NET Framework and modern .NET runtimes. CubeAPM, Datadog, and Elastic APM all provide agents that work across .NET Framework 4.x and .NET 6+ with trace context propagation using W3C Trace Context headers.
During migration from .NET Framework to .NET Core, instrument both environments from the start. This lets you compare performance before and after migration, validate that the new code performs as expected, and catch regressions early.
If you are running WCF services as Windows Services instead of IIS, ensure your APM agent supports profiling Windows Services. Most agents do, but configuration differs from IIS-hosted applications. You will need to set environment variables on the Windows Service itself and restart the service to attach the profiler.
For teams planning to migrate WCF to gRPC or REST APIs, monitor both protocols side by side during the transition. Track latency, error rate, and throughput for WCF endpoints and their new equivalents. This gives you objective data on whether the migration improved performance or introduced new bottlenecks.
Disclaimer: Pricing based on publicly available information as of April 2026. Enterprise discounts, custom contracts, and negotiated rates are not reflected here.
Frequently Asked Questions
Can I monitor WCF services that use netTcpBinding or netNamedPipeBinding?
Yes. Most APM agents that support WCF can instrument services using netTcpBinding and netNamedPipeBinding in addition to HTTP based bindings like basicHttpBinding and wsHttpBinding. However, trace propagation across netTcp boundaries may require manual instrumentation if the APM vendor does not natively support it. Verify with your APM vendor that they explicitly support the WCF binding type your services use before deploying the agent.
Do I need to modify my WCF or Web Forms code to enable APM?
In most cases, no. APM agents that use CLR profiling attach to the .NET runtime at process startup and automatically instrument WCF service operations, Web Forms page lifecycle events, database calls, and HTTP requests without requiring source code changes. Manual instrumentation is only needed if you want to capture custom business metrics or if the agent misses specific framework features your application uses.
How much performance overhead does APM add to legacy .NET applications?
CLR profiling agents typically add 2% to 5% CPU overhead and a small amount of memory overhead for buffering telemetry before sending it to the APM backend. The overhead is usually negligible compared to the performance problems APM helps you find. If your application is already running near CPU capacity, test the agent in a staging environment first to measure actual impact before deploying to production.
Can I use OpenTelemetry to monitor .NET Framework WCF services?
OpenTelemetry has limited support for .NET Framework compared to .NET Core. The OpenTelemetry .NET SDK supports .NET Framework 4.6.2 and later but does not automatically instrument WCF out of the box. You will need to manually instrument WCF service operations using the OpenTelemetry API or use an APM vendor that provides OpenTelemetry compatible instrumentation for legacy .NET. CubeAPM and Elastic APM both offer OpenTelemetry compatible agents that work with .NET Framework.
What is the best way to monitor a mixed environment with both WCF and .NET Core APIs?
Use an APM platform that supports both .NET Framework and .NET Core with unified distributed tracing. This ensures that a trace started in a Web Forms page calling a WCF service that calls a .NET Core API appears as a single end to end trace rather than disconnected spans. CubeAPM, Datadog, New Relic, and Elastic APM all support cross runtime tracing with W3C Trace Context propagation.
How do I monitor WCF services hosted in Windows Services instead of IIS?
Configure the APM agent to profile Windows Services by setting the required environment variables on the service executable. The exact steps depend on the APM vendor. For Datadog and Elastic APM, you typically set COR_ENABLE_PROFILING, COR_PROFILER, and COR_PROFILER_PATH environment variables and restart the Windows Service. Verify that the service runs under an account with sufficient permissions to load the profiler DLL.
Should I migrate from .NET Framework to .NET Core before implementing APM?
No. Implement APM on your current .NET Framework applications first. This establishes a performance baseline, helps you identify existing bottlenecks, and gives you the observability needed to validate performance improvements during migration. Migrating first and then adding APM means you have no before and after comparison and no way to catch regressions introduced by the migration itself.