Kubernetes has become the default choice for orchestrating containers, with Gartner estimating that by 2027, over 90% of global enterprises will run containerized applications in production. Its strength lies in abstracting compute, networking, and storage while enabling autoscaling and resilience at scale.
But with this flexibility comes risk: resource mismanagement leads to CPU throttling, memory leaks, and Pod evictions that directly disrupt applications. A single misconfigured Pod can trigger cascading failures—from OOMKilled restarts to blocked Deployments—impacting both uptime and customer experience.
Native tools like kubectl top or Metrics Server give a snapshot view but fall short on correlation, cost visibility, and long-term retention. A large number of clusters face recurring issues tied to misconfigured resource requests and limits.
This article explains what Kubernetes resource usage monitoring is, why native approaches aren’t enough, the benefits of doing it right, and how CubeAPM provides a cost-efficient, OpenTelemetry-native way to monitor Kubernetes at scale.
What Do You Mean by Kubernetes Resource Usage Monitoring?

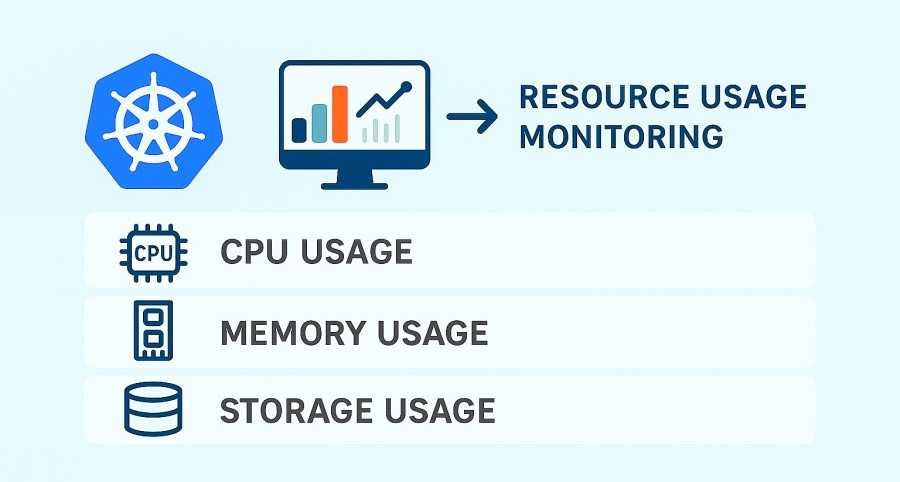
Kubernetes resource usage monitoring is the process of tracking how Pods, Nodes, and Namespaces consume compute (CPU), memory, storage, and network resources in real time. It ensures workloads stay within their defined requests and limits, while giving teams visibility into patterns that affect scheduling, autoscaling, and overall cluster health.
For businesses, this isn’t just about keeping dashboards pretty; it’s about staying reliable, efficient, and cost-conscious in production. Effective monitoring helps you:
- Detect issues early: Spot CPU throttling, memory leaks, or disk pressure before they crash services.
- Optimize costs: Rightsize workloads and prevent wasted cloud spend.
- Improve reliability: Reduce Pod evictions, restarts, and degraded SLAs.
- Enable smarter scaling: Drive HPA/VPA decisions using real usage trends instead of guesswork.
- Strengthen security & compliance: Identify abnormal spikes that may indicate misuse or breaches.
Example: Monitoring Payment Services in FinTech
A FinTech provider running Kubernetes for payment APIs saw intermittent Pod crashes during peak transaction hours. By monitoring resource usage, they discovered a memory leak in one microservice that exceeded its request but never hit its limit—causing repeated OOMKilled restarts. With better visibility, the team tuned memory requests and applied auto-healing, cutting failed transactions by 35% and stabilizing peak-hour performance.
Why Native Kubernetes Monitoring Isn’t Enough
Kubernetes ships with basic monitoring via tools like kubectl top, Metrics Server, and sometimes add-ons like cAdvisor. These provide quick, point-in-time stats for CPU and memory usage, but they come with hard limits. Data is ephemeral, there’s little to no historical retention, and you can’t easily correlate spikes with application logs, traces, or deployment events.
For fast-moving production systems, this creates blind spots:
- Short-lived data: Metrics disappear after minutes or hours, making root cause analysis difficult.
- No correlation: Resource usage isn’t tied to logs, traces, or errors, so debugging requires context switching.
- Limited cost visibility: You can’t map workload usage to cloud bills, leading to hidden overspend.
- Scaling blind spots: Autoscalers work, but without deep usage insights, they risk over- or under-provisioning.
A Sysdig 2024 report found that 41% of Kubernetes environments faced recurring production issues tied to misconfigured requests and limits. Without a full-stack observability layer, these issues linger and escalate, costing teams both uptime and money.
What are the Benefits of Kubernetes Resource Usage Monitoring
Kubernetes resource usage monitoring ensures that Pods, Nodes, and Namespaces stay within their CPU, memory, storage, and network budgets. Beyond dashboards, it drives reliability, cost efficiency, and smarter scaling decisions in production. Here’s why it matters:
Prevent avoidable failures: throttling, OOMKills, and evictions
When Pods exceed their limits or nodes hit memoryPressure/diskPressure, the kubelet may throttle or evict workloads. Monitoring usage helps teams spot memory leaks, rising CPU throttling seconds, or ephemeral storage spikes before they trigger OOMKilled crashes or CrashLoopBackOff loops.
Rightsize requests and limits to reduce waste
Many workloads are over-provisioned “just in case,” inflating cloud bills. 27% of public cloud spend is estimated to be wasted due to idle or oversized resources. By monitoring real usage, teams can rightsize Pods and optimize bin-packing, cutting this waste while keeping workloads stable.
Improve autoscaling accuracy (HPA and VPA)
Kubernetes autoscalers depend on accurate usage metrics. Resource monitoring ensures the Horizontal Pod Autoscaler (HPA) can add replicas before saturation and the Vertical Pod Autoscaler can adjust requests/limits to match demand. Tracking p95/p99 usage prevents oscillation and ensures workloads scale smoothly.
Reduce MTTR by correlating change with resource signals
Most production incidents follow deployments or config changes. By tying resource usage to rollout events and error spikes, monitoring reduces the time spent guessing root causes. Teams can quickly confirm: “Did CPU saturation start after the latest deployment?” — cutting mean time to resolution significantly.
Strengthen multi-tenant isolation and chargeback
In shared clusters, noisy neighbors can consume disproportionate CPU or memory. Per-namespace monitoring makes it possible to enforce quotas, attribute costs fairly, and give teams visibility into their own consumption — a practice widely recommended in FinOps for containerized environments.
Capture ephemeral workloads and bursty traffic
Containers are increasingly short-lived — around 70% now live less than five minutes. Without continuous monitoring, these Pods vanish before teams can analyze failures. Resource usage tracking explains why transient Pods failed to stabilize under peak load.
Enable smarter capacity planning
Resource usage trends at the Node, Namespace, and Cluster levels inform proactive scaling decisions. Monitoring helps teams predict when node pools will saturate and align provisioning with SLOs, ensuring enough headroom for seasonal peaks without overspending.
Key Metrics to Monitor in Kubernetes Resource Usage
Monitoring Kubernetes effectively means tracking the right metrics at the right granularity — Pod, Node, and Namespace. These signals reveal how workloads consume resources and whether they’re nearing thresholds that risk throttling or eviction.
CPU Metrics
CPU monitoring helps identify workloads that are throttled or over-provisioned, ensuring stable scheduling and autoscaling.
- CPU usage vs. requests/limits: Tracks how many CPU cores a container consumes relative to its configured requests and limits. High sustained usage above requests signals throttling risks. Threshold: Consistently >80% of CPU limit indicates tuning required.
- CPU throttling seconds: Measures how often the kubelet throttles a container due to cgroup limits. Frequent throttling means the container is starved of compute. Threshold: >5% throttled CPU time over a 5-minute window is a red flag.
Memory Metrics
Memory is a non-compressible resource in Kubernetes, making it a leading cause of OOMKilled restarts.
- Memory usage (RSS vs. limit): Monitors resident set size (RSS) against Pod limits to detect leaks or runaway processes. Sustained growth points to memory leaks. Threshold: >90% of memory limit over sustained periods risks OOMKills.
- Working set vs. cache: Differentiates active memory from file-system cache, helping detect real leaks vs. temporary caching spikes. Threshold: Steady working set growth without release indicates a problem.
Storage Metrics
Disk usage and IO performance affect application latency and node health, especially under ephemeral workloads.
- Ephemeral storage usage: Tracks temporary storage consumption (logs, caches, temp files) at the Pod level. Overuse triggers node pressure evictions. Threshold: >80% of ephemeral storage request consistently are unsafe.
- Disk I/O latency and throughput: Measures read/write times at the Node and Pod levels. Spikes reveal bottlenecks in underlying volumes. Threshold: >20ms average I/O latency during workload peaks signals storage issues.
Network Metrics
Networking metrics ensure Pods communicate efficiently and highlight congestion or packet loss in services.
- Network bandwidth (TX/RX): Tracks data transferred per Pod or Node. High sustained usage may require scaling CNI bandwidth. Threshold: >80% of node NIC capacity signals risk of packet drops.
- Packet errors and drops: Measures failed or dropped packets, critical for latency-sensitive apps like payments or streaming. Threshold: Any consistent >1% packet drop rate requires immediate action.
Node Health Metrics
Node resource conditions directly influence Pod scheduling and stability.
- Node pressure signals: Metrics like memoryPressure, diskPressure, and PIDPressure indicate nodes nearing exhaustion. Threshold: A node under pressure for >5 minutes risks cascading evictions.
- Node allocatable vs. capacity: Shows how much CPU/memory is allocatable after kubelet/system reservations. Tracking this prevents overcommit scenarios. Threshold: Allocatable <10% headroom is a warning sign for cluster scaling.
How to Monitor Kubernetes Resource Usage with CubeAPM
Step 1: Install CubeAPM in Your Kubernetes Cluster
Start by deploying CubeAPM directly into your cluster with Helm. The installation sets up the backend and prepares collectors to pull CPU, memory, storage, and network data from nodes and pods. Install CubeAPM on Kubernetes
Step 2: Configure the OpenTelemetry Collector for Kubernetes Metrics
The OpenTelemetry Collector acts as the bridge between Kubernetes metrics and CubeAPM. Running it as a DaemonSet ensures every node reports CPU, memory, disk, and network stats. Enabling the kubeletstats and kubernetes_cluster receivers provides:
- Pod and container CPU usage
- Pod memory usage and working set
- Node disk I/O and ephemeral storage consumption
- Network traffic (bytes, packets, errors) Infra Monitoring for Kubernetes
Step 3: Instrument Applications with OpenTelemetry
To go beyond infra, instrument your workloads with OpenTelemetry so CubeAPM can correlate application latency or error spikes with pod resource usage. For example, you’ll see when a CPU spike in a payment microservice aligns with rising latency. Instrumentation with OpenTelemetry
Step 4: Collect and Correlate Kubernetes Logs
Resource bottlenecks often leave traces in pod logs (e.g., “Killed process” from OOMKiller). Configure the OTel Collector’s logs pipeline so CubeAPM ingests logs alongside metrics. This gives full context: CPU spike + memory pressure + eviction log = root cause in minutes. Logs Monitoring
Step 5: Build Resource Dashboards in CubeAPM
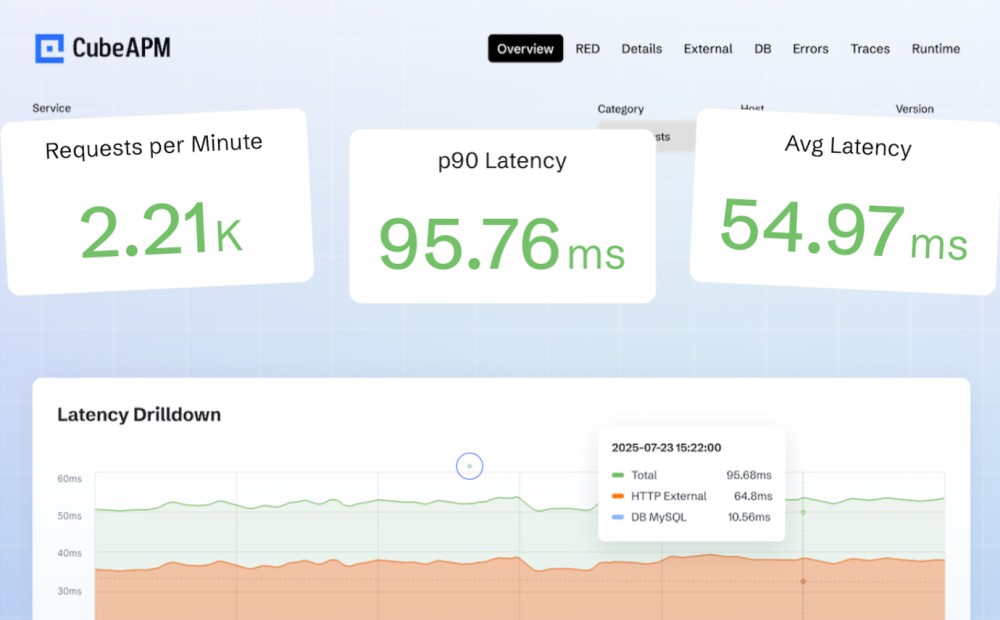
Use CubeAPM’s dashboards to visualize resource usage at multiple levels:
- Pod/Container: CPU throttling %, memory vs. limit, ephemeral storage growth
- Node: Allocatable vs. capacity, disk I/O latency, network throughput
- Namespace/Cluster: Top consumers by CPU and memory, saturation trends CubeAPM Infra Monitoring Docs
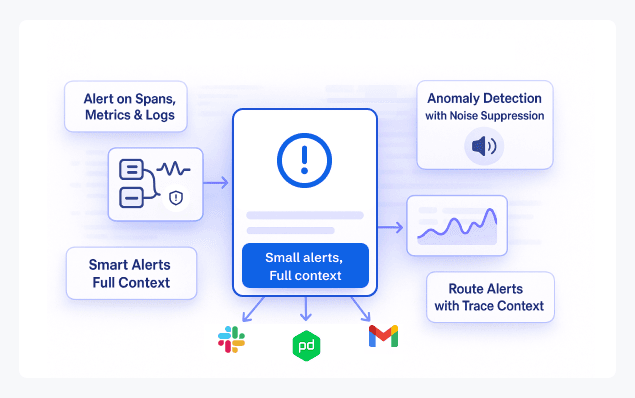
Step 6: Configure Alerts for Resource Thresholds
Set alerts that catch resource issues before they trigger evictions:
- CPU usage > 90% for >5 minutes
- Memory usage > 80% of limit
- Ephemeral storage > 75% of requests
- Node under memoryPressure or diskPressure
Alerts can be sent to email, Slack, or webhooks. Connect Alerting with Email
Real-World Example: Monitoring a Healthcare SaaS Platform with CubeAPM
Challenge: Unstable EMR Workloads During Peak Hours
A healthcare SaaS provider running electronic medical records (EMR) on Kubernetes faced reliability issues during daily peak usage (9–11 AM). Doctors reported frequent slowdowns and occasional downtime. The ops team found Pods repeatedly evicted due to node memory pressure, but couldn’t pinpoint whether it was inefficient workloads, poor requests/limits, or underlying node resource imbalance.
Solution: End-to-End Resource Monitoring with CubeAPM

The team deployed CubeAPM with the OpenTelemetry collector as a DaemonSet across nodes, enabling the kubeletstats receiver for CPU, memory, and ephemeral storage metrics. They instrumented EMR services with OpenTelemetry SDKs, correlating resource usage with API latency. CubeAPM dashboards provided a single pane of glass showing node pressure events side-by-side with Pod memory usage and EMR query timings.
Fixes: Rightsizing and Intelligent Alerting

Analysis showed that one analytics service was consuming nearly 2x its memory requests, starving critical EMR Pods. The team:
- Increased memory requests/limits for EMR Pods to reflect actual usage
- Shifted heavy analytics jobs to a separate node pool with autoscaling
- Configured CubeAPM alerts for Pod memory >80% and node memoryPressure events delivered via Slack
Result: Reliable Performance and Compliance Confidence
After the fixes, EMR workloads stabilized — Pod evictions dropped by 70% and query response times during peak hours improved by 45%. With CubeAPM’s dashboards, the team could demonstrate compliance with healthcare uptime SLAs and data retention policies while also saving costs by preventing overprovisioning.
Best Practices for Kubernetes Resource Usage Monitoring
- Define resource requests and limits: Always set CPU and memory requests/limits for every Pod. This ensures predictable scheduling and prevents runaway workloads from starving neighbors.
- Use HPA and VPA together: Horizontal Pod Autoscaler (HPA) scales replicas, while Vertical Pod Autoscaler (VPA) tunes requests and limits. Together, they balance cost efficiency and reliability under changing workloads.
- Watch node pressure conditions: Monitor signals like memoryPressure, diskPressure, and PIDPressure. They warn when nodes are near exhaustion and help you act before the kubelet evicts Pods.
- Track ephemeral storage usage: Many Pods consume temporary disk space for logs or cache. Monitoring prevents sudden spikes from triggering node evictions due to storage pressure.
- Correlate metrics with logs and traces: Metrics show pressure, but logs and traces reveal the “why.” Combining them speeds up root cause analysis during incidents.
- Retain metrics with tiered storage: Keep hot data for 30 days to support troubleshooting and archive data longer (e.g., 180+ days) for capacity planning and compliance needs.
- Use namespace- and label-based dashboards: In multi-tenant clusters, grouping metrics by namespace or team label ensures fair usage visibility and simplifies chargeback/showback reporting.
- Set actionable alerts: Focus alerts on risks tied to workload health, e.g., CPU >90% for >5 min, memory >80%, or node under pressure. Avoid alert fatigue by tuning thresholds to real-world usage.
Conclusion
Kubernetes resource usage monitoring is no longer optional; it’s the foundation for keeping clusters reliable, cost-efficient, and compliant. Without clear visibility into CPU, memory, storage, and network signals, even well-architected workloads risk throttling, evictions, and rising cloud bills.
CubeAPM makes this process simple by unifying metrics, logs, and traces into real-time dashboards and intelligent alerts. Its OpenTelemetry-native design ensures you capture the right data, while smart sampling and transparent pricing deliver cost savings at scale.
If your team is ready to move beyond basic tools, explore CubeAPM. Book a free demo today and see how CubeAPM helps you monitor Kubernetes with clarity, precision, and efficiency.
Disclaimer: The information in this article reflects the latest details available at the time of publication and may change as technologies and products evolve.
FAQs
1. How do I check Kubernetes resource usage without third-party tools?
You can use built-in commands like kubectl top pod or kubectl top node to see CPU and memory usage. However, these only provide a snapshot and lack historical trends or advanced correlation.
2. What is the difference between Kubernetes Metrics Server and Prometheus for resource monitoring?
Metrics Server aggregates resource usage data from Kubelets and supports autoscaling decisions, but it stores data only briefly. Prometheus scrapes, stores, and queries metrics long-term, making it better for historical analysis and alerting.
3. How can Kubernetes resource monitoring help with compliance requirements?
Continuous monitoring provides audit trails of how workloads use compute, memory, and storage over time. This helps organizations demonstrate SLA adherence and meet compliance standards, where performance and uptime are critical.
4. Which Kubernetes objects provide the best granularity for resource monitoring?
You can monitor at multiple levels: Pods and containers for fine-grained usage, Nodes for hardware capacity, Namespaces for team-level insights, and the entire Cluster for capacity planning. Each granularity serves different operational goals.
5. Can Kubernetes resource usage monitoring detect security issues?
Yes, unusual spikes in CPU, memory, or network traffic can indicate cryptomining, denial-of-service, or other malicious activity. While not a complete security solution, resource monitoring provides early signals for further investigation.


