










DNS performance monitoring tracks how fast and reliably your DNS infrastructure translates domain names into IP addresses. A slow or failing DNS resolver adds latency to every user request, and most teams only discover DNS problems after users report “site is down” even when application servers are running fine.
This guide covers what DNS performance monitoring is, which metrics actually matter, how to set alerts that catch problems early, and how to choose monitoring tools that fit your stack whether you run CoreDNS in Kubernetes, authoritative DNS at scale, or rely on external DNS providers.
What Is DNS Performance Monitoring?
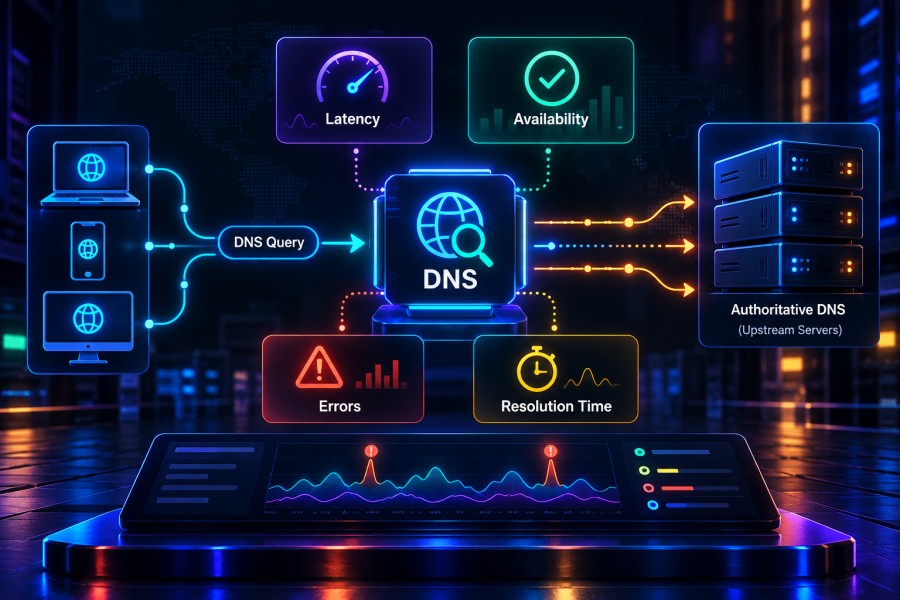
DNS performance monitoring is the continuous measurement of DNS query success rates, resolution times, and infrastructure health across authoritative nameservers, recursive resolvers, and client-facing endpoints. It answers three questions in real time: Is DNS resolving correctly? Is it resolving fast enough? Are there security or propagation issues?
DNS sits at the entry point of nearly every network request. When DNS fails or slows down, applications become unreachable even if backend services are healthy. A typical web page load involves multiple DNS lookups for the main domain, CDN assets, third-party scripts, and API endpoints. If the first DNS query takes 500 milliseconds instead of 50, the entire page load feels slow.
DNS performance monitoring works by running active checks, synthetic queries from multiple locations, and analyzing passive telemetry from real user requests. Active checks simulate what a user would see: querying specific DNS records like A, AAAA, CNAME, MX, or TXT and measuring how long each takes and whether the response is correct. Passive monitoring aggregates metrics from DNS servers themselves, capturing query rates, cache hit ratios, SERVFAIL rates, and error codes.
The goal is not just uptime. DNS can be “up” but still perform poorly if resolution times spike, caching breaks, or authoritative servers respond inconsistently across regions. Effective DNS performance monitoring surfaces these issues before they cascade into user-facing problems.
How DNS Performance Monitoring Works
DNS performance monitoring combines active synthetic testing with real-time telemetry collection from DNS infrastructure. Synthetic tests send scripted DNS queries from distributed probe locations to measure resolution time, validate returned IP addresses, and detect availability problems. Telemetry collection pulls operational metrics from DNS servers themselves using exporters, logs, and built-in stats endpoints.
For authoritative DNS, monitoring tracks whether nameservers respond to queries, return correct records, and handle zone updates without propagation delays. For recursive resolvers, including public DNS services like Google DNS or Cloudflare DNS and internal resolvers like CoreDNS, monitoring measures cache performance, upstream query latency, and DNSSEC validation status.
In Kubernetes environments, DNS monitoring typically focuses on CoreDNS pods. Metrics are scraped via Prometheus endpoints exposed by CoreDNS, capturing queries per second, cache hit rates, query types, response codes, and latency histograms. When a pod cannot resolve service names, DNS monitoring helps determine whether the issue is CoreDNS overload, upstream resolver failure, or network connectivity between the pod and the DNS service.
Cloud environments add another layer. If you use Route 53, Azure DNS, or Google Cloud DNS, monitoring includes both the cloud provider’s control plane health and the resolver behavior seen by your applications. Many teams also monitor DNS resolution time from end-user locations using Real User Monitoring (RUM) to capture the DNS lookup component of page load time.
DNS propagation monitoring verifies that changes to DNS records appear globally within expected TTL windows. When you update an A record, synthetic checks from multiple regions confirm that both authoritative nameservers and public resolvers reflect the new value. Propagation delays or inconsistent answers between regions often signal misconfigured TTLs, caching problems, or issues with DNS provider replication.
Key DNS Performance Metrics to Monitor
DNS performance monitoring relies on specific metrics that reveal whether DNS is working correctly, responding fast, and behaving consistently. These metrics split into five categories: availability and correctness, resolution speed, query volume and patterns, infrastructure health, and security signals.
Availability and Correctness
Query success rate measures the percentage of DNS queries that return a valid response without timing out or producing server errors. A success rate below 99.9% typically indicates resolver overload, network issues, or authoritative server failures. Track this metric separately for each critical domain and record type.
Correct record validation confirms that DNS queries return expected IP addresses or canonical names. Monitor A, AAAA, CNAME, MX, and TXT records for business-critical domains to detect accidental changes or DNS hijacking. If an A record suddenly returns a different IP than expected, it could signal a compromised DNS account or registrar issue.
NXDOMAIN rate tracks queries that return “domain does not exist” errors. A sudden spike can indicate mistyped subdomains in application code, broken links, or external services querying nonexistent records. Persistent NXDOMAIN errors for domains you expect to resolve point to missing records or propagation failures.
SERVFAIL and REFUSED rates measure server-side DNS errors. SERVFAIL often results from DNSSEC validation failures, backend resolver issues, or zone file corruption. REFUSED errors suggest access control misconfigurations or rate limiting. Both should remain near zero in healthy DNS infrastructure.
Resolution Speed and Latency
DNS lookup time measures how long it takes to resolve a domain name into an IP address. This metric matters more at the tail than the average. A p50 lookup time of 30 milliseconds looks fine, but if p95 reaches 300 milliseconds, 5% of users experience slow page loads. Track p50, p95, and p99 latency separately. For user-facing domains, p95 DNS resolution time above 100 milliseconds degrades perceived performance.
Query latency breaks down into recursive resolver response time and authoritative nameserver response time. If your recursive resolver is fast but authoritative lookups are slow, the problem lies with your DNS provider or upstream network path. If the resolver itself is slow, check cache hit rates and CPU load.
Time to first byte for DNS responses isolates the network and processing delay before the DNS server begins responding. This metric helps distinguish between network congestion and server overload. When TTFB spikes but resolution time stays flat, the problem is likely network latency or firewall traversal.
Query Volume and Patterns
Queries per second (QPS) tracks DNS request volume over time. Sudden QPS spikes can signal DDoS attacks, application misconfigurations that disable caching, or traffic surges from legitimate sources. Monitor QPS by record type as well, since unusual MX or TXT query volumes might indicate reconnaissance activity.
Cache hit rate measures what percentage of DNS queries are answered from cache versus requiring upstream lookups. Recursive resolvers should maintain cache hit rates above 80% for frequently accessed domains. Low cache hit rates increase latency and upstream load, often caused by TTLs set too low or application code bypassing DNS caching.
Query type distribution shows the ratio of A, AAAA, CNAME, MX, TXT, and other query types. Unexpected shifts such as a surge in TXT queries can indicate automated scanning or configuration changes in third-party integrations like email authentication or CDN setups.
Infrastructure Health Metrics
For self-hosted or managed DNS servers, infrastructure health metrics reveal capacity constraints and potential failure points before they impact users. CoreDNS in Kubernetes, BIND servers, or cloud DNS services all expose operational metrics that indicate load, errors, and resource saturation.
CoreDNS metrics include coredns_dns_request_duration_seconds for query latency, coredns_dns_requests_total for QPS, coredns_dns_responses_total broken down by response code (NOERROR, NXDOMAIN, SERVFAIL), and coredns_cache_hits_total versus coredns_cache_misses_total for cache performance. When CoreDNS pods restart frequently or show high memory usage, DNS resolution becomes unreliable.
Recursive resolver upstream latency measures how long it takes for your resolver to query authoritative nameservers or upstream public DNS services. If this metric rises, check whether upstream servers are overloaded, network paths are congested, or rate limiting is applied.
Nameserver reachability confirms that all authoritative nameservers listed in your domain’s NS records respond to queries. If one NS endpoint fails, most resolvers will retry with another, but repeated failures increase latency. Monitor reachability from multiple probe locations to detect regional outages or routing issues.
Security and Compliance Metrics
DNSSEC validation status tracks whether DNSSEC-enabled domains pass cryptographic validation. Validation failures prevent resolution for clients with DNSSEC enforcement enabled, causing hard outages. Monitor DNSSEC validation errors separately and alert immediately when failures appear.
Unexpected record changes detect when DNS records are modified outside scheduled maintenance windows. Automated monitoring that compares current DNS responses against a known-good baseline helps catch DNS hijacking, compromised registrar accounts, or accidental changes by team members.
Query source patterns identify unusual query origins. A spike in DNS queries from unfamiliar geographic regions or IP blocks can signal reconnaissance ahead of DDoS attacks or attempts to enumerate subdomains. Some DNS monitoring tools integrate threat intelligence feeds to flag queries from known malicious sources.
DNS Performance Monitoring for Kubernetes and CoreDNS
Kubernetes clusters rely on CoreDNS for service discovery, meaning every service-to-service call involves a DNS lookup. Poor CoreDNS performance directly impacts application latency and reliability. Monitoring CoreDNS requires tracking pod-level metrics, query behavior, and upstream resolver health.
CoreDNS exposes Prometheus metrics on port 9153 by default. Scraping these metrics gives visibility into query rates, latency, cache efficiency, and error rates. Key metrics include coredns_dns_request_duration_seconds_sum and coredns_dns_request_duration_seconds_count for calculating average latency, coredns_dns_requests_total by query type and zone, and coredns_dns_responses_total by response code to detect SERVFAIL or NXDOMAIN spikes.
Cache performance in CoreDNS determines whether service name resolution stays fast under load. The coredns_cache_hits_total and coredns_cache_misses_total metrics show cache effectiveness. Low cache hit rates often result from TTLs set too short or applications that bypass DNS caching by making repeated lookups. Tune TTLs and review application DNS client behavior to improve cache efficiency.
CoreDNS forwards external queries to upstream resolvers configured in the Corefile. If upstream resolvers become slow or unreachable, all external DNS lookups fail. Monitor coredns_forward_requests_total and coredns_forward_response_duration_seconds to detect upstream issues. When upstream latency rises, check whether the configured resolver IPs are responding, whether there are network path issues, or whether rate limiting is applied.
Resource saturation in CoreDNS pods causes DNS timeouts and increases pod restarts. Track CPU and memory usage for CoreDNS pods, and monitor pod restart counts. If CoreDNS pods are CPU-throttled or OOMKilled, scale the deployment horizontally or increase resource limits. Persistent high memory usage often indicates cache bloat or memory leaks in specific CoreDNS plugins.
Setting Effective DNS Performance Alerts
DNS alerts must balance sensitivity with noise reduction. Too sensitive, and you get paged for transient blips. Too permissive, and real outages go undetected until users complain. Effective DNS alerting uses multiple signal types, considers geographic variance, and includes context to speed triage.
Alert on query success rate dropping below 99.5% over a five-minute window. This catches both hard outages and partial failures where some queries succeed but a meaningful percentage fail. Avoid alerting on single failed queries, since transient network errors happen. A sustained drop over multiple minutes indicates a real problem.
Alert on p95 DNS resolution time exceeding 150 milliseconds for user-facing domains. This threshold accounts for normal variance while catching slowdowns that degrade user experience. For internal services, a lower threshold like 75 milliseconds makes sense since internal DNS should be faster. Include the affected domain and location in the alert payload so the on-call engineer knows where to start.
Alert on SERVFAIL or REFUSED error rates exceeding 1% of queries. These errors indicate server-side misconfigurations or resource exhaustion. Route these alerts to both SRE and DNS infrastructure teams, since the root cause could be DNS server issues, DNSSEC problems, or upstream resolver failures.
Alert on unexpected DNS record changes for critical domains. Use a baseline of known-good DNS responses and trigger an alert when A, AAAA, CNAME, or MX records return different values than expected. This catches accidental edits, DNS hijacking, and propagation issues. Include the old and new record values in the alert to speed validation.
Alert on CoreDNS cache hit rate dropping below 80% sustained over 10 minutes. Low cache hit rates signal TTL misconfigurations or application behavior that bypasses caching. This alert gives teams time to investigate before latency becomes user-facing.
Alert on CoreDNS pod restarts exceeding three within an hour. Frequent restarts indicate resource limits that are too low, memory leaks, or plugin crashes. Pair this alert with resource usage metrics to determine whether the issue is capacity or a software bug.
For multi-region deployments, alert when DNS resolution time variance across regions exceeds 200 milliseconds. This catches cases where DNS performs well in some locations but poorly in others, often due to regional resolver issues or network path congestion.
DNS Monitoring Tools and Platforms
Choosing a DNS monitoring tool depends on whether you need active synthetic checks, passive telemetry from DNS servers, or both. Some teams run DNS-specific monitoring tools, while others integrate DNS checks into broader infrastructure monitoring platforms.

CubeAPM provides DNS performance monitoring as part of its infrastructure monitoring platform. It tracks DNS resolution time, query success rates, and error codes across your applications and services. CubeAPM integrates with Prometheus exporters, including CoreDNS metrics, to surface DNS health alongside APM, logs, and infrastructure data. It runs on-premises or in your VPC, keeping DNS telemetry inside your infrastructure. Pricing is $0.20/GB with unlimited retention and no per-host fees.
Datadog DNS Monitoring offers synthetic DNS checks from global probe locations and integrates with Datadog APM to correlate DNS latency with application performance. It monitors authoritative nameservers, recursive resolvers, and DNS resolution time from end-user devices via RUM. Pricing starts at $5 per million Synthetic API tests, with additional charges for RUM and infrastructure monitoring.
Prometheus with CoreDNS Exporter is the standard open-source approach for Kubernetes DNS monitoring. CoreDNS exposes Prometheus metrics natively, and Grafana dashboards visualize query rates, latency, cache performance, and error rates. This setup requires managing Prometheus and Grafana yourself, but it provides full control and zero licensing cost.

ThousandEyes DNS Monitoring is purpose-built for DNS observability across authoritative servers, recursive resolvers, and global DNS resolution paths. It measures DNS query time, validates record correctness, and tests DNSSEC validation from distributed vantage points. ThousandEyes is priced per test and per agent, starting around $500 per month for basic DNS monitoring.
Pingdom and UptimeRobot provide lightweight DNS checks as part of website monitoring. They test whether domains resolve and measure resolution time, but lack deep DNS metrics like query type breakdown or cache hit rates. These tools work for simple uptime checks but do not replace full DNS monitoring for complex infrastructure.
DNS Performance Monitoring Best Practices
Effective DNS monitoring requires more than enabling a few checks. These practices help teams catch DNS issues early and maintain fast, reliable resolution.
Monitor DNS from multiple geographic locations to detect regional failures and latency differences. A DNS query that resolves in 20 milliseconds from your office might take 300 milliseconds from another continent. Use synthetic probes in North America, Europe, and Asia Pacific at minimum.
Test both IPv4 and IPv6 resolution separately. Some resolvers and networks handle IPv6 poorly, causing fallback delays or outright failures. If your applications support IPv6, monitor A and AAAA records independently.
Track DNS resolution time as part of end user experience, not just infrastructure health. Use Real User Monitoring (RUM) to capture DNS lookup time from actual browsers and mobile apps. This reveals how DNS performs in real network conditions, including ISP resolvers and mobile networks.
Validate DNS propagation after every record change. Automated checks from multiple resolvers confirm that updates appear within expected TTL windows. Propagation issues often go unnoticed until users in specific regions report problems hours later.
Monitor DNSSEC validation status for domains where DNSSEC is enabled. DNSSEC failures cause hard outages for clients that enforce validation. Test DNSSEC from multiple resolvers, since some validate correctly while others fail due to misconfigured signatures or expired keys.
Alert on DNS error rate increases, not just single failures. A single SERVFAIL is noise. A 5% SERVFAIL rate sustained over five minutes is a production incident. Use rate-based thresholds to filter transient issues.
Correlate DNS metrics with application performance data. When page load times spike, check whether DNS resolution time increased at the same time. Unified observability platforms make this correlation easier by linking DNS, infrastructure monitoring, and APM traces in one interface.
Review DNS query patterns monthly to identify misconfigurations. Repeated NXDOMAIN errors for the same subdomain indicate broken application code or stale DNS references. Unusually high TXT query rates might signal third-party integrations polling too frequently.
Conclusion
DNS performance monitoring protects application availability and user experience by tracking resolution speed, query success rates, and infrastructure health in real time. Without it, DNS failures go unnoticed until users report outages, and slow DNS resolution adds hidden latency to every request.
Effective DNS monitoring measures availability, correctness, latency, infrastructure health, and security signals. It uses active synthetic checks and passive telemetry to detect problems early, and it sets alerts that balance sensitivity with noise reduction. Tools range from open-source Prometheus setups to full observability platforms that integrate DNS monitoring with APM, logs, and infrastructure metrics.
For teams running Kubernetes, CoreDNS monitoring is essential. For teams managing authoritative DNS or using external providers, multi-region synthetic checks and propagation validation prevent regional failures and slow updates from impacting users.
Disclaimer: The information in this article reflects the latest details available at the time of publication and may change as technologies and products evolve. Features, pricing, and plan limits can change over time. Always verify the latest information directly with the vendor before making purchasing or deployment decisions. This review is based on CubeAPM’s independent research and analysis and does not constitute an official audit or endorsement. This article is intended for informational purposes only and is not meant to disparage any individual, company, or product. We encourage readers to verify current details directly with the relevant providers before making any decisions.
Frequently Asked Questions
What is the difference between DNS monitoring and DNS security monitoring?
DNS monitoring tracks performance, availability, and correctness of DNS resolution. DNS security monitoring focuses on detecting threats like DNS hijacking, cache poisoning, DDoS attacks, and reconnaissance activity. Both are important, but they measure different aspects of DNS health.
What metrics should I monitor for CoreDNS in Kubernetes?
Monitor query rate, query latency (p50, p95, p99), cache hit rate, SERVFAIL and NXDOMAIN rates, upstream resolver latency, and CoreDNS pod resource usage (CPU, memory, restarts). These metrics reveal whether CoreDNS is performing well or experiencing overload.
How do I measure DNS resolution time from end users?
Use Real User Monitoring (RUM) to capture DNS lookup time from browsers and mobile apps. RUM measures the actual DNS resolution delay users experience, including their ISP resolver behavior and network conditions.
What causes high DNS latency?
High DNS latency results from slow recursive resolvers, overloaded authoritative nameservers, low cache hit rates, network congestion, or upstream resolver failures. Debugging requires checking resolver performance, cache metrics, and network paths separately.
How often should I run synthetic DNS checks?
Run synthetic DNS checks every 1 to 5 minutes for critical domains. Frequent checks detect issues faster, but balance check frequency with cost if using a paid monitoring service. For less critical domains, every 10 to 15 minutes is sufficient.
What is a good DNS resolution time threshold for alerts?
Alert when p95 DNS resolution time exceeds 150 milliseconds for user-facing domains or 75 milliseconds for internal services. These thresholds catch slowdowns that impact user experience while avoiding alerts on normal variance.
How do I monitor DNS propagation after making changes?
Use synthetic checks from multiple global locations and public resolvers to query updated records. Verify that all authoritative nameservers return the new value and that common public resolvers (Google DNS, Cloudflare DNS) reflect the change within the expected TTL window.