The main difference between Datadog, LogicMonitor, and CubeAPM lies in how much visibility, control, and cost predictability they offer as systems scale.
Datadog is a SaaS-first observability platform with broad capabilities but complex, usage-based pricing. LogicMonitor focuses more on infrastructure and network monitoring with enterprise licensing. CubeAPM delivers full-stack, OpenTelemetry-native observability with predictable pricing, self-hosted deployment, and unlimited data retention.
In this guide, we compare Datadog vs LogicMonitor vs CubeAPM across features, pricing models, deployment options, sampling strategies, and more.
Datadog vs LogicMonitor vs CubeAPM Comparison
| Feature | CubeAPM | Datadog | LogicMonitor |
| Known for | Unified MELT + self-hosting+ OpenTelemetry-native + cost predictability | Large enterprise SaaS ecosystem with 900+ integrations. | Enterprise hybrid IT and infrastructure observability |
| Multi-Agent Support | Yes (OTel, New Relic, Datadog, Elastic, etc.) | Yes ( Datadog Agent, OTEL, & third-party agents) | Yes (LogicMonitor collectors; OTEL support limited) |
| MELT Support (Metrics, Events, Logs, Traces) | Full MELT coverage | Full MELT coverage | MELT support |
| Deployment (Self-Host/ Setup) | Self-hosted with vendor-managed | SaaS-only | SaaS-hosted; supports installing collectors on-prem or in the cloud |
| Pricing | Ingestion-based pricing of $0.15/GB | APM: $31/host/ month; Infra: $15 /host/month; Logs: $0.10/GB | Essentials: $16/unit/ month; Advanced: $27/unit/month, Full-stack: $53/unit/ month; |
| Sampling Strategy | Smart sampling – fully automated, context-aware | Head-based, tail-based, and adaptive sampling | Probabilistic (head-based) and tail-based trace sampling |
| Data Retention | Unlimited Retention (no extra cost) | 15-30 days based on plan | Metrics: 3+ months to 2+ years; traces: 45 days; logs: (7d, 1mo, 90d, 1yr, custom) |
| Support Channel & TAT | Slack, WhatsApp; response in minutes | Community-based; email & chat (paid); TAT: <2 hrs. to 48 hrs | Portal, chat, phone support; TAT: < 4 hours to 48 hours |
Datadog vs LogicMonitor vs CubeAPM: Feature Breakdown
Known for
CubeAPM is known for being an OpenTelemetry-native full-stack observability platform that unifies metrics, events, logs, and traces (MELT) in one system and supports deployment inside your own cloud or on-premises for compliance and data control. It enables real-time distributed tracing, infrastructure monitoring, log analytics, and synthetics/RUM monitoring in one place.
Datadog is known for being a cloud-based, SaaS observability and monitoring platform that provides real-time insights into applications, infrastructure, logs, and cloud services, helping teams monitor distributed systems and troubleshoot performance issues at scale. Its broad product suite includes application performance monitoring (APM), infrastructure monitoring, database monitoring, real-user monitoring, and more.
LogicMonitor is known for delivering hybrid observability and infrastructure monitoring across on-premises, cloud, and multi-cloud environments with AI-powered insights, unified dashboards, and deep visibility into networks, servers, devices, and cloud resources. Its platform emphasizes reducing alert noise and speeding resolution across complex IT systems.
Multi-Agent Support
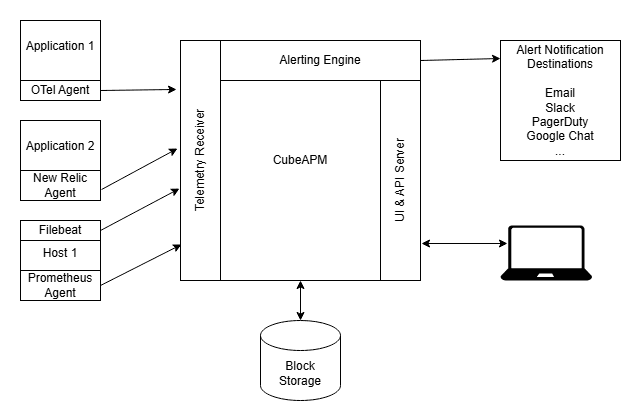
CubeAPM supports multiple instrumentation and agent formats, letting customers ingest telemetry from a wide variety of sources. The platform can receive data from applications instrumented with different agents, including OpenTelemetry, Datadog, Elastic, New Relic, and others, making it easier to reuse existing instrumentation or migrate from other vendors.
Datadog supports its own Datadog Agent as the primary collection mechanism and also integrates with OpenTelemetry sources. The official Datadog docs explain that you can send telemetry via the Datadog Agent’s DDOT Collector, use a standard OpenTelemetry Collector pipeline, or ingest telemetry through OTLP, enabling flexibility in how data is collected and forwarded to the Datadog platform.
LogicMonitor uses LogicMonitor Collectors as its core data collection mechanism. These are lightweight, environment-installed collectors that pull telemetry from infrastructure, applications, and services. For trace data, LogicMonitor supports embedded or external OpenTelemetry Collectors that forward telemetry into the platform.
MELT Support (Metrics, Events, Logs, Traces)
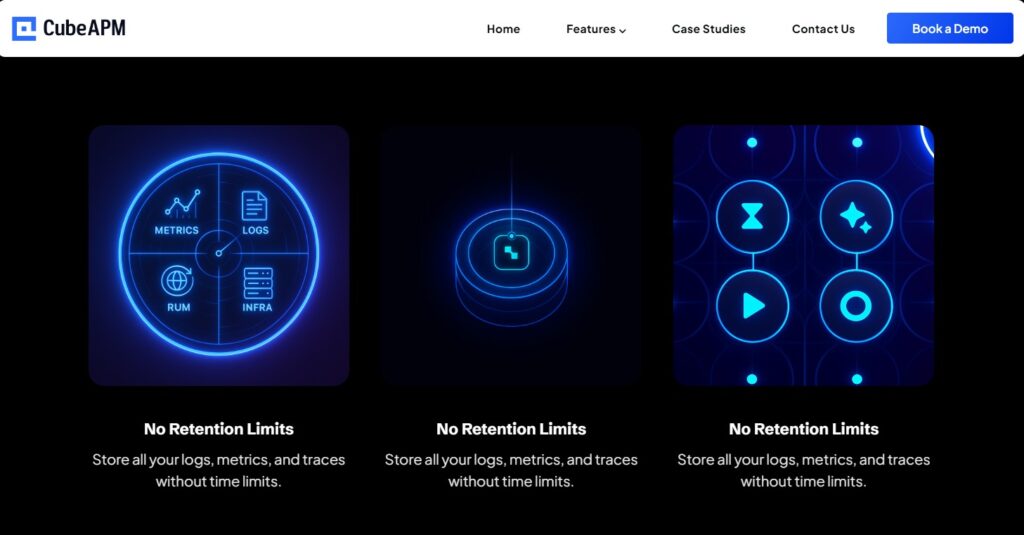
CubeAPM is built as a full-stack observability platform that natively unifies metrics, events, logs, and traces (MELT) in a single system. The platform provides application performance monitoring, distributed tracing, infrastructure monitoring, log monitoring, error tracking, synthetics, and real user monitoring, all correlated through an OpenTelemetry-native backend. This allows teams to analyze issues across signals without switching tools or managing separate data pipelines.
Datadog supports full MELT observability through its SaaS platform, covering metrics, events, logs, and traces across infrastructure and applications. Datadog delivers these capabilities through multiple products, including Infrastructure Monitoring, APM, Log Management, Real User Monitoring, and Synthetics, which are documented as separate but integrated components of the Datadog platform. Correlation across signals is supported, though features and limits vary by product and pricing tier.
LogicMonitor supports the MELT pillars through a combination of native monitoring capabilities and OpenTelemetry-based integrations. According to LogicMonitor’s documentation, the platform provides metrics and event monitoring as core capabilities, log ingestion through LM Logs, and distributed tracing via OpenTelemetry collectors.
Deployment (Self-Host/Setup)

CubeAPM supports self-hosted deployment via via Bring Your Own Cloud (BYOC) and on-premises. The entire observability stack runs inside the customer’s own cloud or on-prem environment to maintain data residency and compliance, while CubeAPM manages setup, upgrades, and scaling as part of the service. This model is designed for teams that need control over where telemetry data is stored without taking on full operational overhead.
Datadog is offered exclusively as a SaaS-only platform. As described in Datadog’s official documentation, customers install the Datadog Agent within their environments to collect telemetry, but all data processing, storage, analytics, and visualization occur in Datadog-managed cloud infrastructure. Datadog does not offer a fully self-hosted or customer-managed control plane deployment option.
LogicMonitor operates as a cloud-hosted SaaS platform with customer-installed collectors. According to LogicMonitor’s documentation, customers deploy lightweight LogicMonitor Collectors on-premises, in cloud environments, or across hybrid setups to gather telemetry from monitored resources. These collectors securely send data to the LogicMonitor cloud, where monitoring, analytics, alerting, and dashboards are handled. The central LogicMonitor platform itself is not self-hosted by customers.
Pricing for Small, Mid, and Large Teams
To summarize the pricing:
*All pricing comparisons are calculated using standardized Small/Medium/Large team profiles defined in our internal benchmarking sheet, based on fixed log, metrics, trace, and retention assumptions. Actual pricing may vary by usage, region, and plan structure. Please confirm current pricing with each vendor.
| Approx. cost for teams (size) | Small (~30) | Medium (~125) | Large (~250) |
| CubeAPM | $2,080 | $7,200 | $15,200 |
| Datadog | $8,185 | $27,475 | $59,050 |
| LogicMonitor | $2,890 | $11,125 | $22,750 |
CubeAPM Costs in Detail
CubeAPM: CubeAPM follows a pure ingestion-based pricing model, where customers pay based on the volume of telemetry ingested rather than host count or feature tiers. The pricing starts at $0.15 per GB and applies uniformly across logs, metrics, and traces. There are no separate charges for APM hosts, infrastructure hosts, or data retention, which simplifies cost planning as observability data scales.
- Small teams (~ 30): $2,080
- Mid-sized teams (~ 125): $7,200
- Large teams (~250): $15,200
Datadog Cost in Detail
Datadog: Datadog uses a product- and usage-based pricing model, with costs varying by telemetry type and feature. According to Datadog’s official pricing pages, APM is priced at $31 per host per month, infrastructure monitoring at $15 per host per month, and logs at $0.10 per GB ingested (indexed logs).
- Small teams: $8,185
- Mid-size teams: $27,475
- Large teams: $59,050
LogicMonitor Cost in Detail
LogicMonitor: LogicMonitor uses a platform package pricing model based on hybrid units, as published on its official pricing page. LogicMonitor lists three core packages:
- Essentials at $16 per unit per month,
- Advanced at $27 per unit per month, and
- Signature with Edwin AI at $53 per unit per month
These packages cover infrastructure and observability capabilities, while add-ons such as log monitoring and advanced services are priced separately. Final costs depend on the number and type of hybrid units monitored.
- Small teams: $2,890
- Mid-size teams: $11,125
- Large teams: $22,750
Sampling Strategy
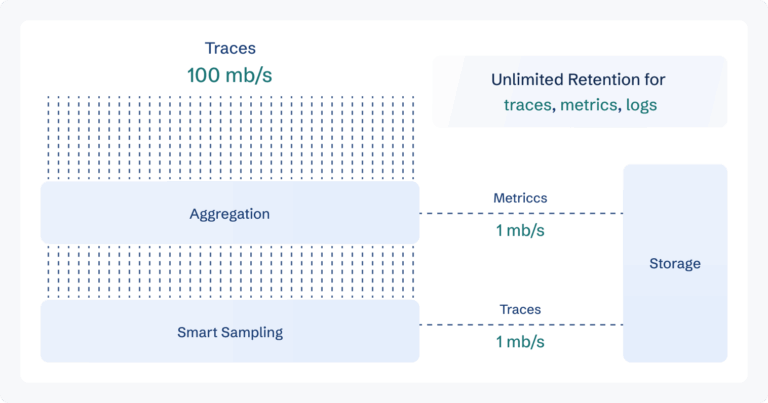
CubeAPM uses smart, automated, context-aware sampling to reduce telemetry volume while preserving high-value data. According to CubeAPM’s documentation, sampling decisions take into account factors such as latency, errors, and request context, allowing the platform to retain important traces while operating at higher sampling efficiency. This approach minimizes manual rule configuration and helps control costs without losing critical observability signals.
Datadog supports multiple sampling mechanisms depending on the data source and pipeline. As documented by Datadog, the platform offers head-based sampling at the agent level, adaptive ingestion controls to manage data volume, and tail-based sampling when using OpenTelemetry pipelines. These options allow teams to tune sampling based on throughput and performance needs.
LogicMonitor supports probabilistic (head-based) and tail-based trace sampling through its OpenTelemetry Collector integration. According to LogicMonitor’s documentation, customers configure sampling policies directly in the OpenTelemetry Collector that forwards trace data to LogicMonitor. Sampling rules are fully customer-defined and applied before traces are ingested into the platform, allowing control over trace volume while prioritizing selected conditions such as latency or attribute values.
Data Retention

CubeAPM provides unlimited data retention for metrics, logs, and traces at no additional cost. As documented on CubeAPM’s website and product documentation, all retained telemetry remains fully searchable and queryable over time, without requiring customers to upgrade plans or pay for extended storage. This approach is designed to support long-term trend analysis, historical debugging, and audits without cost-driven retention trade-offs.
Datadog applies data-type-specific retention policies that vary by product and configuration. According to Datadog’s official documentation, indexed APM traces are retained for 15 days by default, with some traces retained up to 30 days through intelligent retention filters. Metrics are retained for 15 months, while RUM data such as sessions, views, and actions are retained for 30 days. Log retention is configurable per index and plan, and longer retention requires additional configuration and cost.
LogicMonitor defines retention based on data type and subscription configuration, as outlined in its official documentation. Metrics and general telemetry data are retained from approximately 3 months to over 2 years, depending on the plan. Trace data is retained for up to 45 days, while log retention is configurable using log partitions, with supported durations including 7 days, 1 month, 90 days, 1 year, or custom periods, depending on purchased capacity.
Support Channel & TAT
CubeAPM offers real-time support via Slack and WhatsApp with core engineers, with response times commonly in the minutes range based on CubeAPM’s support model and sales documentation. This setup aims to accelerate resolution during production incidents by enabling fast, direct communication outside of traditional ticket queues.
According to Datadog’s published support documentation, the Premier Support Plan includes 24×7 email and chat support, with response time targets such as under 30 minutes for business-critical issues, under 4 hours for degraded services, and under 12 hours for general issues. Other tiers (Standard or Free) have fewer guarantees and vary in channels (e.g., email, portal, community) and TAT commitments.
LogicMonitor delivers support through its support portal, with additional chat access depending on support tier and phone support offered for higher tiers (such as Premier or specialized compliance packages). According to LogicMonitor’s official support documentation, urgent issues target initial engagement in under 4 hours, while other high-severity tickets may see initial engagement within up to 48 hours, with exact response times depending on the purchased support level.
Which tool is best for you? Why brands choose CubeAPM
Datadog is best for organizations that prefer a fully managed SaaS experience with broad ecosystem integrations and extensive built-in dashboards. LogicMonitor is best for enterprises focused on hybrid IT and infrastructure monitoring across on-prem and cloud systems.
CubeAPM is best for teams that need full-stack observability with predictable cost, deep data control, and modern architecture.
Benefits of CubeAPM
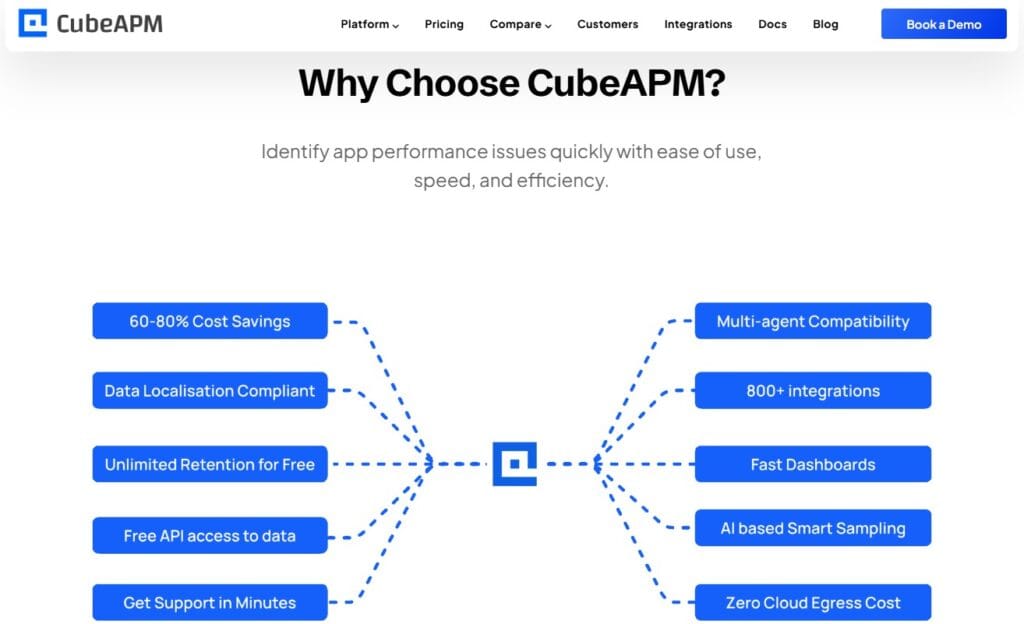
- Unified Observability: one platform for metrics, logs, traces, and events, eliminating tool sprawl and simplifying troubleshooting workflows.
- Self-hosted/BYOC: Customers can deploy inside their own environment for compliance, performance isolation, and cost control.
- Predictable Cost: ingestion-based pricing avoids complex host-count, module, or retention add-ons, making budgeting more reliable as telemetry grows.
- Unlimited Retention: historical logs and tracing remain queryable without paying extra for extended storage.
- OpenTelemetry-native: built around modern standards, reducing vendor lock-in and easing instrumentation for microservices.
Datadog vs LogicMonitor vs CubeAPM: Use Cases
Each of these tools is optimized for a different set of teams and operational priorities. Below are clear, real-world use cases to help you decide which platform fits your environment best.
Choose CubeAPM if:
CubeAPM is built for teams that want modern, full-stack observability without cost surprises or SaaS lock-in. Based on our demo data, sales data, and customer conversations, it is commonly chosen in the following scenarios:
- You are a startup or fast-growing SaaS company that needs full-stack observability (metrics, events, logs, traces) from day one, without managing multiple tools.
- You want a lightweight, easy-to-deploy APM that works out of the box with OpenTelemetry and does not require complex agent sprawl or backend management.
- You operate in regulated environments and need strict data residency, compliance, or customer-managed cloud deployment, where telemetry must stay inside your VPC or on-prem.
- You are replacing Datadog or similar SaaS tools due to unpredictable pricing and want an ingestion-based model with predictable costs and unlimited data retention (based on CubeAPM’s pricing and docs).
- You run distributed microservices or Kubernetes workloads and need end-to-end tracing across services, correlated with logs and metrics, to reduce mean time to resolution (MTTR).
- You want direct access to core engineers during incidents to speed up debugging and avoid long ticket queues (based on CubeAPM’s support model).
Choose Datadog if:
Datadog is best suited for teams that prioritize a fully managed SaaS experience and broad ecosystem coverage. Based on Datadog’s website and documentation, it fits these use cases:
- You want an all-in-one SaaS observability platform with minimal infrastructure management and quick onboarding.
- You rely heavily on cloud provider integrations, managed services, and third-party tools, and benefit from Datadog’s large integration ecosystem.
- You have teams that value prebuilt dashboards, alerts, and managed workflows over deployment control.
- You are comfortable with host-based, usage-based, and feature-tier pricing, and your organization can absorb cost increases as telemetry volume grows.
- You prefer vendor-managed scaling and do not require self-hosting or customer-managed data planes.
Choose LogicMonitor if:
LogicMonitor is primarily designed for infrastructure-centric environments and hybrid IT operations. Based on LogicMonitor’s official website and docs, it is commonly used when:
- Your main requirement is infrastructure, network, and device monitoring across on-prem, cloud, and hybrid environments.
- You manage large fleets of servers, network devices, or cloud resources and need centralized visibility with hybrid unit licensing.
- You want collector-based monitoring deployed close to your infrastructure, while using a SaaS platform for analytics and dashboards.
- Application-level APM and deep distributed tracing are secondary requirements, rather than the core focus.
- You operate in traditional enterprise IT environments where infrastructure health and availability are the primary concerns.
Conclusion
Datadog and LogicMonitor are excellent observability platforms, but teams often run into limitations as they scale. Datadog can be costly for smaller teams at scale and is SaaS-only, while LogicMonitor lacks some features and can be complex for new users.
CubeAPM addresses these gaps by unifying metrics, events, logs, and traces in a single OpenTelemetry-native platform. With self-hosted (BYOC/on-prem) deployment, cost-efficient ingestion-based pricing, unlimited retention, and fast engineer-led support, CubeAPM gives teams control without operational overhead.
Schedule a free demo to see CubeAPM in action.
Disclaimer: The information in this article reflects the latest details available at the time of publication and may change as technologies and products evolve.
FAQs
1. How difficult is it to migrate from Datadog or LogicMonitor to CubeAPM?
Migration is typically straightforward because CubeAPM is OpenTelemetry-native and compatible with existing agents. Teams can reuse current instrumentation and gradually switch data pipelines, avoiding a risky “big-bang” migration. Based on demo and sales data, most teams complete initial migrations in hours, not weeks.
2. Which tool offers the best data ownership and control?
CubeAPM provides the highest level of data ownership by allowing self-hosted or BYOC deployments where telemetry stays inside your infrastructure. Datadog and LogicMonitor operate SaaS platforms where data is processed and stored in vendor-managed environments, which may not meet strict data residency requirements for some organizations.
3. How do these tools compare in terms of learning curve for engineers?
CubeAPM is designed to be lightweight and developer-friendly, especially for teams already using OpenTelemetry. Datadog offers rich features but can require more time to understand pricing, retention, and product boundaries. LogicMonitor is easier for infrastructure teams but less intuitive for deep application-level troubleshooting.
4. Which platform scales better for high-cardinality and microservices workloads?
CubeAPM is well suited for high-cardinality telemetry and microservices because it combines smart sampling with predictable ingestion-based pricing and unlimited retention. Datadog can handle scale technically, but costs often increase sharply as telemetry volume grows. LogicMonitor scales well for infrastructure metrics but introduces complexity.
5. Which option minimizes long-term vendor lock-in?
CubeAPM minimizes lock-in by building entirely around open standards like OpenTelemetry and allowing customers to control deployment and data storage. Datadog and LogicMonitor rely more heavily on proprietary platforms and workflows, which can make switching providers more complex over time.


