










The OpenTelemetry Collector processes over 60% of enterprise observability pipelines today, according to the CNCF Annual Survey 2024. Teams use it to receive, transform, and route traces, metrics, and logs from hundreds of sources to multiple backends without rewriting instrumentation. But the Collector itself is not a complete observability solution. It is a telemetry pipeline that sits between your application and your storage or analysis platform.
Choosing the right OpenTelemetry Collector setup means deciding on three things: which distribution to run, where to send the data, and whether you need managed infrastructure or self-hosted control. This guide compares 10 platforms across open source projects, SaaS tools, and on-premises options. Each is evaluated on cost model, native OpenTelemetry support, deployment flexibility, and what happens after the Collector finishes routing your data.
Quick comparison: 10 OpenTelemetry Collector tools at a glance
| Tool | Best For | Pricing Model | Managed Collector? | Native OTLP Backend? |
|---|---|---|---|---|
| CubeAPM | On-prem teams, full-stack observability | $0.20/GB, unlimited retention | ✓ Yes | ✓ Native |
| Grafana Cloud | Teams on Prometheus, Loki, Tempo | Free tier, usage-based beyond | ✓ Yes | ✓ Native |
| SigNoz | Open source first, OTel native teams | Free OSS, Cloud $0.30/GB | ✓ Cloud option | ✓ Native |
| Datadog | Broad integrations, enterprise scale | Host-based $15–$31/host/mo | ✓ Agent mode | Partial (OTLP via agent) |
| New Relic | Managed observability platform | $0.40/GB beyond 100 GB free | ✓ Yes | ✓ Native |
| Honeycomb | High cardinality debug, distributed systems | Free tier, Pro $130/mo+ | ✓ Yes | ✓ Native |
| Dynatrace | Enterprise AI-assisted analysis | Host based | ✓ Yes | Partial |
| Elastic APM | ELK stack users | Free OSS, Hosted $99/mo+ | Self-hosted primary | ✓ Native |
| Uptrace | Developers, cost-sensitive teams | $0.11/GB traces | ✓ Cloud option | ✓ Native |
| Lightstep | Service mesh, distributed tracing | Custom pricing | ✓ Yes | ✓ Native |
Understanding OpenTelemetry Collector distributions
The OpenTelemetry Collector is not a single product. It is a framework that comes in multiple distributions, each bundled with different receivers, processors, exporters, and extensions. The two main distributions are Core and Contrib.
Core distribution: Minimal set of stable components. Best for simple pipelines with well-understood needs. Maintained by the OpenTelemetry project directly.
Contrib distribution: Includes 200+ community-contributed components. Covers niche receivers like SQL Server, Kafka, and CloudWatch. Most production teams start here because it supports more sources and destinations out of the box.
Beyond these, vendors offer their own distributions with proprietary extensions. Datadog, New Relic, and Dynatrace all ship customized Collectors that include their own exporters and optimization logic. These work fine but reduce portability. If you switch vendors later, you may need to reconfigure your entire pipeline.
A Reddit thread from r/devops documents one team spending three weeks migrating Collector configs after switching from a vendor-specific distribution back to Contrib. The lesson: start with Contrib unless you have a specific reason to use a vendor build.
What the Collector does and what it does not do
The OpenTelemetry Collector is a telemetry pipeline. It receives data from your applications, applies transformations like sampling or enrichment, and exports it to one or more backends. It does not store data, visualize dashboards, or generate alerts. Those functions happen in the backend platform you export to.
This distinction matters because many teams evaluate “OpenTelemetry tools” expecting a complete monitoring solution. The Collector alone gives you routing and transformation. You still need a backend like CubeAPM, Grafana, or Datadog to store, query, and alert on the data.
What the Collector handles well
Protocol translation: Receive OTLP, Jaeger, Zipkin, Prometheus, and 50+ other formats in one pipeline. Export to any backend without changing application code.
Sampling and filtering: Apply tail-based sampling to retain only high-value traces. Drop noisy metrics. Redact PII before data leaves your network.
Batching and retry logic: Buffers telemetry during backend downtime. Reduces network overhead by batching small payloads into larger exports.
Multi-backend export: Send the same telemetry stream to multiple destinations. Route traces to one vendor, metrics to another, logs to long-term archive storage.
What the Collector does not handle
Long-term storage: The Collector buffers data temporarily. It does not replace a database or object storage backend.
Querying and dashboards: The Collector exports data. It does not render charts or answer queries. That requires a visualization layer like Grafana or a full platform like CubeAPM.
Alerting: The Collector can detect patterns during processing, but it does not fire alerts or integrate with PagerDuty. Alert logic lives in your backend platform.
A GitHub issue from the OpenTelemetry Collector repository shows users confused about storage expectations. The maintainers clarified: the Collector is a pipeline component, not a full observability stack.
1. CubeAPM
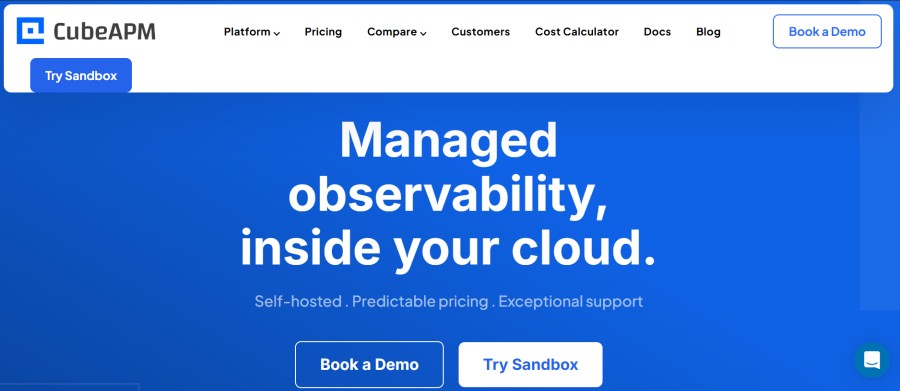
Best for: On-prem teams that want unified APM, logs, and infrastructure monitoring with a managed Collector and full OTLP backend inside their own cloud.
CubeAPM runs inside your VPC or data center and includes a managed OpenTelemetry Collector as part of the deployment. Telemetry stays local. No data leaves your infrastructure. The Collector routes traces, metrics, and logs to CubeAPM’s ClickHouse-backed storage layer, which indexes everything for fast search without separate indexing fees.
Key Features:
- Native OTLP ingestion with managed Collector deployment
- Unified storage for traces, metrics, logs, and Kubernetes data
- Unlimited retention with no cold storage charges
- Self-hosted but vendor-managed – upgrades and patches handled by CubeAPM
- Compatible with existing Datadog, New Relic, and Prometheus agents during migration
Pricing: $0.20/GB ingested. No per-host fees, no user seat charges, no separate indexing costs. A 50-node cluster ingesting 10 TB monthly costs approximately $1,500 per month before infrastructure.
Pros:
- Full data sovereignty – telemetry never leaves your cloud
- Predictable pricing with one billing dimension
- Fast migration – existing OTel agents work without reconfiguration
- Direct engineering support via Slack or WhatsApp
Cons:
- Requires infrastructure provisioning (though CubeAPM manages the software layer)
- Smaller third-party integration library compared to Datadog or New Relic
- No autonomous anomaly detection (manual alert configuration required)
Best for: Engineering teams with data residency requirements, regulated industries, or SaaS cost fatigue who want full stack observability without vendor lock-in.
2. Grafana Cloud
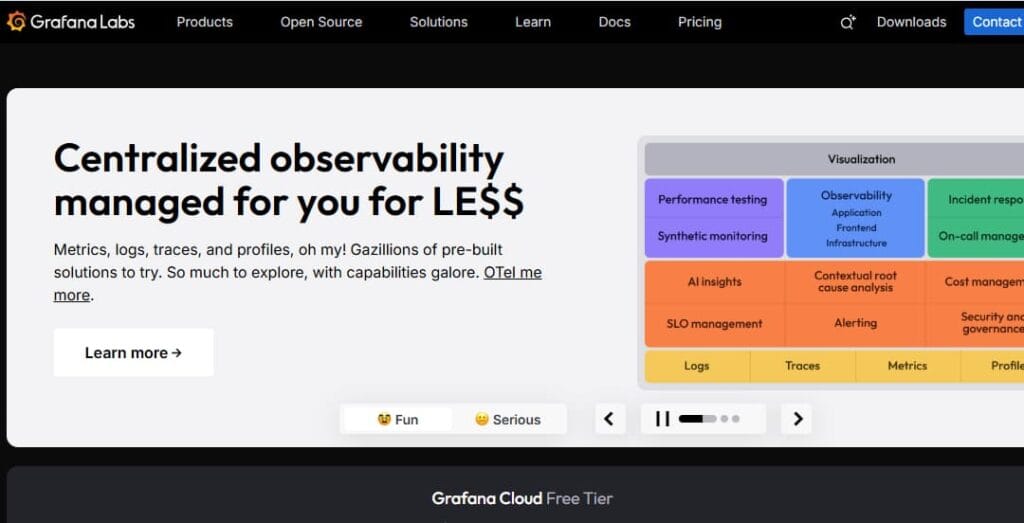
Best for: Teams already running Prometheus, Loki, or Tempo who want a managed backend with native OpenTelemetry support.
Grafana Cloud provides managed instances of Prometheus (metrics), Loki (logs), Tempo (traces), and Grafana (dashboards). The OpenTelemetry Collector exports directly to these backends via OTLP. Grafana’s strength is flexibility — you control the pipeline, choose which signals to send where, and visualize everything in Grafana dashboards you already know.
Key Features:
- Native OTLP receivers for Tempo, Prometheus, and Loki
- Full Grafana dashboard ecosystem with 1,000+ community templates
- Adaptive sampling in Tempo to reduce trace storage costs
- On-call alerting via Grafana OnCall (included in higher tiers)
Pricing: Free tier includes 50 GB traces, 10,000 metric series, 50 GB logs. Paid plans start at $8 per active series per month for metrics, $0.50/GB for logs, $0.50/GB for traces. A 50-node cluster ingesting 10 TB monthly costs approximately $5,000 to $7,000 depending on signal mix.
Pros:
- Best-in-class visualization with Grafana dashboards
- Open-source core – you can self-host the entire stack if needed
- Strong Kubernetes integration via Grafana Agent
Cons:
- Pricing complexity increases with metric cardinality and log indexing
- Requires understanding of Prometheus query language (PromQL) and LogQL
- No unified query layer – traces, metrics, logs queried separately
Best for: Platform teams that want observability flexibility and already invest time in Grafana ecosystem tooling.
3. SigNoz
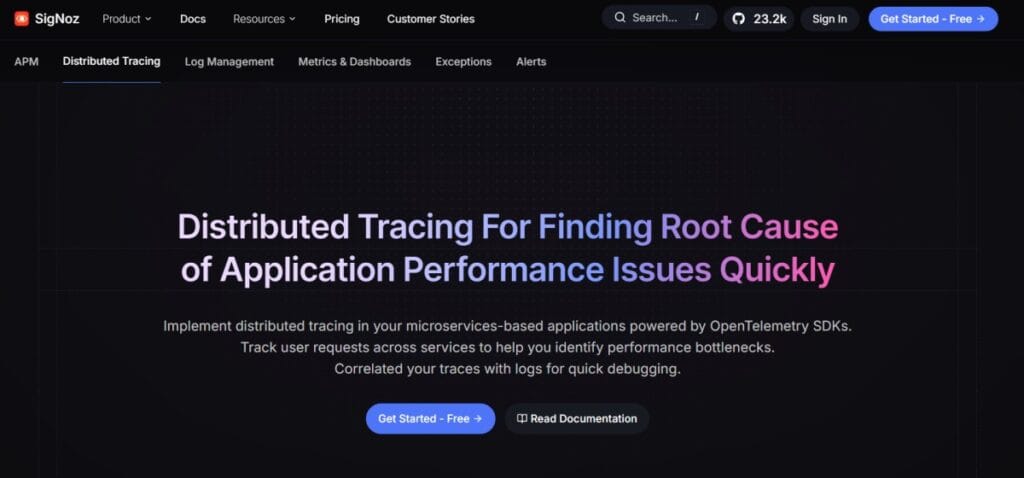
Best for: Open source teams, cost-sensitive startups, and engineers who want an OpenTelemetry native backend with full query and visualization in one platform.
SigNoz is built entirely on OpenTelemetry standards. It includes an embedded Collector, a ClickHouse storage backend, and a React-based UI for querying traces, metrics, and logs. You can self-host the open-source version or use SigNoz Cloud, which is a managed SaaS priced by ingestion volume.
Key Features:
- Native OTLP ingestion for traces, metrics, and logs
- ClickHouse storage with columnar compression for cost efficiency
- Trace query builder with filters by service, endpoint, tags, and latency
- Distributed tracing tools compatible – works alongside Jaeger and Zipkin exports
Pricing: Free open source. SigNoz Cloud starts at $0.30/GB for traces, $0.10 per million samples for metrics, $0.30/GB for logs. A 50-node cluster ingesting 10 TB monthly costs approximately $3,000 to $4,000 depending on signal distribution.
Pros:
- Full stack observability in one open source platform
- No vendor lock-in – export configs and data are portable
- Active community with fast GitHub issue responses
Cons:
- Self-hosted version requires Kubernetes and ClickHouse expertise
- Smaller feature set than enterprise platforms (no RUM, limited synthetics)
- Cloud tier still maturing – some enterprise features missing
Best for: Engineering teams that want full observability without SaaS lock-in and are comfortable managing infrastructure or adopting early-stage SaaS.
4. Datadog
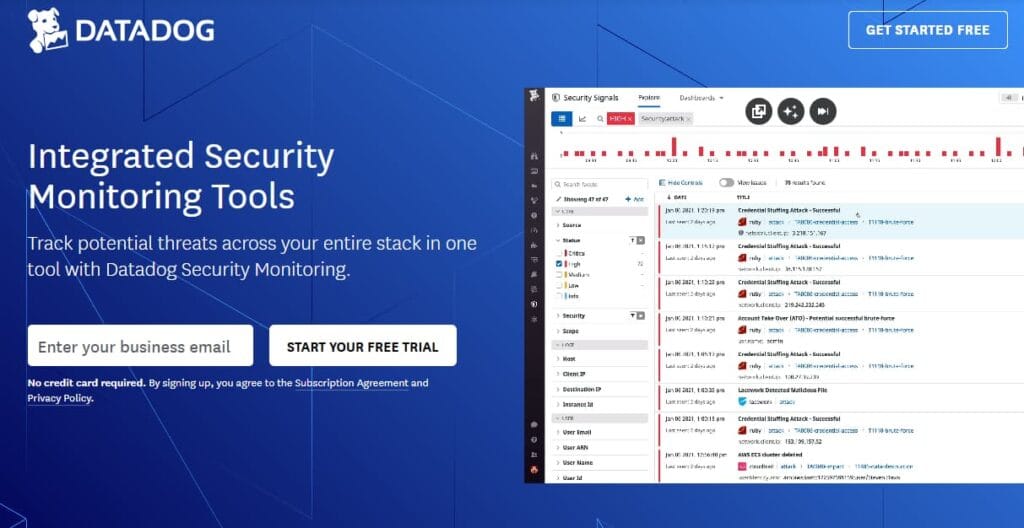
Best for: Large enterprises that need broad integrations, AI-assisted anomaly detection, and a fully managed platform.
Datadog supports OpenTelemetry via its Agent, which includes an embedded Collector. You configure the Agent to receive OTLP data and export it to Datadog’s backend. Datadog does not use OTLP for all internal processing; it translates OTLP spans into Datadog’s proprietary format – but ingestion works without friction.
Key Features:
- OTLP ingestion via Datadog Agent with embedded Collector
- 700+ integrations covering cloud platforms, databases, and SaaS tools
- Watchdog AI for anomaly detection and root cause analysis
- Unified dashboards for logs, traces, metrics, RUM, and synthetics
Pricing: Host-based. Infrastructure monitoring starts at $15 per host per month. APM adds $31 per host per month. Logs are $0.10/GB ingested plus $1.70 per million events indexed. A 50-node cluster with APM, logs, and RUM costs approximately $4,000 to $6,000 per month before trace ingestion volume.
A Reddit thread from r/devops documents one team’s Datadog bill increasing from $4,200 to $12,800 after adding log indexing and custom metrics. The issue was not Datadog’s fault – the team did not understand the difference between ingestion and indexing costs. But the pricing model compounds fast.
Pros:
- Best-in-class integration library
- Strong anomaly detection with Watchdog AI
- Full feature depth across APM, logs, RUM, synthetics, and security monitoring
Cons:
- Expensive at scale due to per-host and per-feature pricing
- Vendor lock-in via proprietary query language and dashboard format
- Cloud-only – no on-prem deployment option
Best for: Enterprises with budget for a managed platform and teams that value breadth over cost predictability.
5. New Relic

Best for: Teams that want a managed observability platform with native OTLP support and unified query across all telemetry signals.
New Relic has fully adopted OpenTelemetry. Its backend natively ingests OTLP without translation. The New Relic Collector distribution includes preconfigured exporters that route data to New Relic’s Telemetry Data Platform, which stores traces, metrics, logs, and events in a unified schema queryable via NRQL.
Key Features:
- Native OTLP ingestion with no protocol translation
- Unified query language (NRQL) across all telemetry types
- Full platform includes APM, logs, infrastructure, RUM, synthetics, and AI monitoring
- Distributed tracing with full trace fidelity (no head-based sampling)
Pricing: Consumption-based. 100 GB ingested per month free. Beyond that, $0.40/GB for most telemetry types. User seats are $99 per full platform user per month or $49 per core user per month. A 50-node cluster ingesting 10 TB monthly costs approximately $4,000 for ingestion plus $1,000 to $2,000 for user seats.
New Relic’s pricing calculator models this, but the final bill depends on whether you hit retention limits or enable high security mode, which increases storage costs.
Pros:
- Strong OpenTelemetry adoption with native OTLP support
- Unified query model across all signals
- Generous free tier for small teams
Cons:
- User seat costs compound as teams grow
- NRQL creates vendor lock-in; dashboards and alerts are not portable
- Cloud-only; no self-hosted option
Best for: Teams that want a managed platform and can absorb per-user costs as they scale.
6. Honeycomb

Best for: Engineers debugging distributed systems who need high cardinality event analysis and fast query response on complex traces.
Honeycomb is built for high cardinality observability. It treats every trace span as a rich event with dozens of attributes. You can query by any attribute combination without predefining indexes. The OpenTelemetry Collector exports OTLP data to Honeycomb’s backend, which stores it in a columnar format optimized for arbitrary query patterns.
Key Features:
- Native OTLP ingestion with full attribute retention
- BubbleUp feature surfaces correlations between high-cardinality fields and latency or errors
- Trace waterfall view with span-level attribute inspection
- Query builder designed for exploratory analysis (no fixed dashboards required)
Pricing: Free tier includes 20 million events per month. Pro plan starts at $130 per month and scales by event volume. Enterprise pricing is custom. A 50-node cluster generating 10 million trace spans daily costs approximately $1,500 to $3,000 per month depending on span attribute density.
Pros:
- Best-in-class high-cardinality query performance
- Designed for debugging, not just monitoring
- No pre-indexing required; query any field instantly
Cons:
- Steeper learning curve for teams used to metrics-first tools
- Pricing scales with event volume, which can surprise teams during traffic spikes
- Limited infrastructure monitoring compared to full stack platforms
Best for: SRE teams and engineers who spend more time debugging than dashboarding and need fast answers on complex distributed traces.
7. Dynatrace
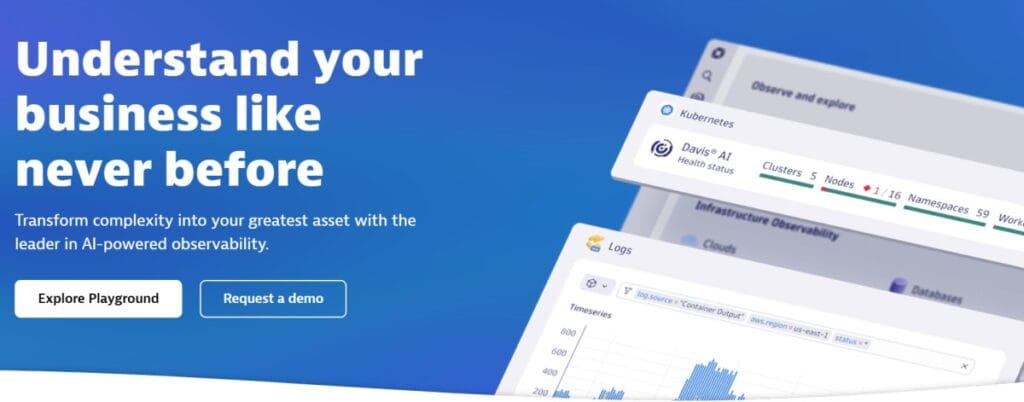
Best for: Large enterprises that want AI-assisted root cause analysis and automatic dependency mapping across hybrid cloud environments.
Dynatrace uses its own OneAgent to collect telemetry, but it also supports OpenTelemetry via OTLP ingestion. The platform’s Davis AI engine analyzes traces, metrics, logs, and user sessions to surface probable root causes without manual correlation. Dynatrace excels in environments with thousands of services where manual dependency mapping is impractical.
Key Features:
- OTLP ingestion alongside OneAgent proprietary telemetry
- Davis AI for anomaly detection and root cause inference
- Automatic service dependency mapping (Smartscape)
- Full stack monitoring including mainframe, Kubernetes, serverless, and user sessions
Pricing: Host-based. Starts at approximately $69 per host per month for full stack monitoring. A 50-node cluster costs approximately $3,450 per month before log ingestion volume or extended retention.
Pros:
- Industry-leading AI for root cause analysis
- Automatic topology discovery with minimal configuration
- Strong support for hybrid environments (cloud, on-prem, mainframe)
Cons:
- Expensive at scale due to per-host pricing
- Heavy agent footprint compared to lightweight OTel Collectors
- Complex feature set with steep learning curve
Best for: Enterprises with complex hybrid infrastructure and budget for AI assisted observability.
8. Elastic APM
Best for: Teams already running the ELK stack (Elasticsearch, Logstash, Kibana) who want to add APM without introducing a new platform.
Elastic APM ingests OpenTelemetry data via the Elastic APM Server, which translates OTLP spans into Elasticsearch documents. You query traces using the same Kibana interface you already use for logs. Elastic APM is best when your team has deep Elasticsearch expertise and wants unified storage for logs and traces.
Key Features:
- OTLP ingestion via Elastic APM Server
- Unified storage in Elasticsearch for traces, metrics, and logs
- Kibana dashboards and alerts shared across all telemetry types
- Self-hosted or managed via Elastic Cloud
Pricing: Free open source. Elastic Cloud starts at $99 per month for the standard tier. Enterprise tier pricing depends on data volume and retention. A 50-node cluster with 10 TB monthly ingestion costs approximately $2,000 to $4,000 depending on retention and replica configuration.
Pros:
- Unified platform if you already use Elasticsearch
- Full control over data retention and indexing strategy
- Strong log correlation with traces
Cons:
- Elasticsearch expertise required for tuning and scaling
- APM query performance degrades with high cardinality fields
- Self-hosted setup is operationally heavy
Best for: Engineering teams with Elasticsearch operational expertise who want to consolidate logs and traces in one storage backend.
9. Uptrace
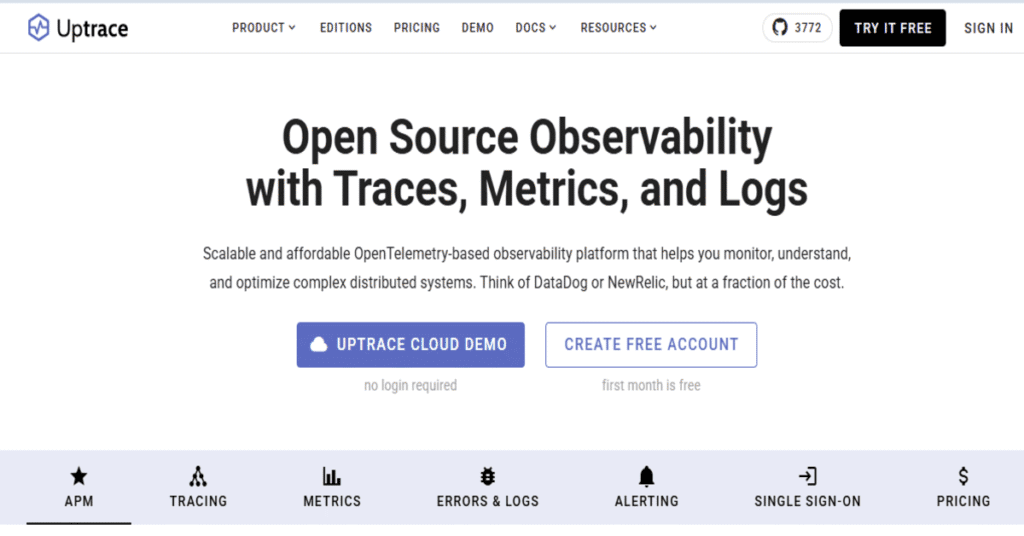
Best for: Developers and small teams that want a simple, cost-effective OpenTelemetry backend with PostgreSQL or ClickHouse storage.
Uptrace is an open-source APM platform built on OpenTelemetry. It uses PostgreSQL or ClickHouse as the storage backend and provides a web UI for trace and metric queries. Uptrace Cloud offers managed hosting with ingestion-based pricing, making it one of the cheapest full-stack OpenTelemetry backends available.
Key Features:
- Native OTLP ingestion with PostgreSQL or ClickHouse storage
- Trace queries with filters by service, operation, duration, and tags
- Metrics dashboards using PromQL-compatible queries
- Open source core with managed cloud option
Pricing: Free open source. Uptrace Cloud starts at $0.11/GB for traces, $0.03 per 1,000 metric samples. A 50-node cluster ingesting 10 TB monthly costs approximately $1,100 to $1,500 depending on signal mix.
Pros:
- Lowest-cost full-stack OpenTelemetry backend
- Simple deployment with Docker Compose or Kubernetes Helm chart
- No vendor lock-in – data stored in standard PostgreSQL or ClickHouse
Cons:
- Smaller feature set than enterprise platforms
- Limited community size compared to Grafana or SigNoz
- Cloud tier still early – fewer integrations than mature SaaS platforms
Best for: Cost-sensitive teams, startups, and developers who want a lightweight OpenTelemetry backend without SaaS pricing.
10. Lightstep
Best for: Service mesh users, distributed tracing at scale, and teams debugging microservices with complex dependency graphs.
Lightstep (now part of ServiceNow) was one of the first commercial platforms built entirely on OpenTelemetry. It specializes in distributed tracing with features like trace sampling intelligence, service diagram exploration, and latency heatmaps. Lightstep is best for teams with hundreds of services where manual trace correlation is impractical.
Key Features:
- Native OTLP ingestion with intelligent trace sampling
- Service diagram with live latency and error rate overlays
- Change Intelligence feature correlates deployments with performance regressions
- Trace query with automatic anomaly highlighting
Pricing: Custom enterprise pricing. Public rate cards are not available. Contact sales for a quote.
Pros:
- Deep distributed tracing expertise
- Strong service mesh integration (Istio, Linkerd)
- Intelligent sampling reduces trace volume without losing critical spans
Cons:
- Expensive; pricing is opaque and typically enterprise-only
- Limited infrastructure monitoring compared to full stack platforms
- Smaller community and integration library than Datadog or New Relic
Best for: Enterprises with service mesh deployments and budget for specialized distributed tracing tooling.
How to choose the right OpenTelemetry Collector tool
Choosing an OpenTelemetry Collector tool means answering three questions: where do you want your data stored, how much control do you need over the pipeline, and what is your budget?
Question 1: Do you need data sovereignty or cloud compliance?
If your data must stay inside your own cloud or data center, your options narrow to self-hosted or BYOC platforms: CubeAPM, SigNoz (self-hosted), Elastic APM (self-hosted), Grafana Cloud (on-prem option), or Dynatrace (on-prem option).
SaaS only platforms like Datadog, New Relic, and Honeycomb route all telemetry to their cloud. This simplifies operations but rules them out for regulated industries with data residency requirements.
Question 2: Do you want a full stack platform or best-of-breed components?
Full stack platforms like CubeAPM, Datadog, and New Relic provide APM, logs, infrastructure, RUM, and synthetics in one UI. You get unified query, correlated alerts, and faster onboarding.
Best-of-breed tools like Grafana, SigNoz, and Honeycomb excel in specific domains (visualization, open source flexibility, high cardinality debug) but require you to assemble the full stack yourself.
Question 3: What is your budget model – predictable or usage spikes tolerated?
Ingestion-based pricing (CubeAPM, SigNoz, New Relic) scales linearly with data volume. You pay per GB ingested. This is predictable if your traffic patterns are stable.
Host-based pricing (Datadog, Dynatrace) scales with infrastructure size. If you auto-scale from 50 to 150 nodes during peak traffic, your bill triples in the same window.
Event-based pricing (Honeycomb) scales with span or event volume. High cardinality instrumentation can inflate event counts faster than raw data volume.
A GitHub discussion from the OpenTelemetry community repository documents one team’s cost analysis comparing five backends. Their finding: SaaS platforms were 3x to 5x more expensive than self-hosted at 10 TB monthly ingestion.
Monitoring OpenTelemetry Collector pipelines with CubeAPM
CubeAPM includes built-in monitoring for the OpenTelemetry Collector itself. You can track Collector CPU and memory usage, receiver queue depth, exporter retry rates, and dropped span counts from CubeAPM’s infrastructure monitoring dashboards.
When you deploy CubeAPM, the managed Collector automatically reports its own telemetry back to the CubeAPM backend. This eliminates the need for a second monitoring tool to watch the Collector. You see Collector health metrics alongside application traces and infrastructure data in the same UI.
How to monitor the Collector with CubeAPM:
- Deploy CubeAPM in your VPC or on-premises environment. The Collector is included in the deployment.
- The Collector scrapes its own metrics using the Prometheus receiver and exports them to CubeAPM’s storage layer.
- View Collector metrics in CubeAPM’s infrastructure monitoring section. Filter by Collector instance, pipeline, receiver, or exporter.
- Set alerts on Collector queue depth, exporter retry rate, or dropped span count to catch pipeline bottlenecks before they impact data completeness.
This self-monitoring approach ensures that AWS Lambda monitoring workloads, Kubernetes traces, and infrastructure metrics all flow reliably through the Collector without silent data loss.
Frequently Asked Questions
What is the OpenTelemetry Collector used for?
The OpenTelemetry Collector receives telemetry data (traces, metrics, logs) from applications, processes it (sampling, filtering, enrichment), and exports it to one or more backends for storage and analysis. It acts as a vendor neutral telemetry pipeline.
Do I need the OpenTelemetry Collector to use OpenTelemetry?
No. OpenTelemetry SDKs can export OTLP data directly to backends that support OTLP ingestion. The Collector is optional but recommended for production because it adds retry logic, batching, and multi backend export without changing application code.
What is the difference between OpenTelemetry Core and Contrib distributions?
Core includes a minimal set of stable components. Contrib includes 200+ community contributed receivers, processors, and exporters. Most production teams use Contrib because it supports more data sources and destinations.
Can I use the OpenTelemetry Collector with Datadog or New Relic?
Yes. Both platforms support OTLP ingestion. Datadog and New Relic also offer their own Collector distributions with proprietary exporters, but the standard Contrib distribution works fine if you configure the OTLP exporter to send to their endpoints.
How much does it cost to run the OpenTelemetry Collector?
The Collector itself is free open source software. Cost comes from the infrastructure it runs on (CPU, memory, network) and the backend you export data to. A Collector processing 10 TB monthly typically requires 4 to 8 vCPUs and 16 to 32 GB RAM depending on pipeline complexity.
What is the best OpenTelemetry backend for cost sensitive teams?
CubeAPM and Uptrace offer the lowest cost full stack backends at $0.15/GB and $0.11/GB respectively. SigNoz open source is free if you self host. Grafana Cloud is cost effective for teams already using Prometheus and Loki.
How do I migrate from Jaeger or Zipkin to OpenTelemetry?
The OpenTelemetry Collector includes Jaeger and Zipkin receivers. Configure the Collector to receive Jaeger or Zipkin spans, process them, and export to your chosen backend. Your application instrumentation does not need to change immediately — the Collector handles protocol translation.
—
Disclaimer: The information in this article reflects the latest details available at the time of publication and may change as technologies and products evolve. Features, pricing, and plan limits can change over time. Always verify the latest information directly with the vendor before making purchasing or deployment decisions.