Observe is a Snowflake-powered observability platform that correlates logs, metrics, and traces as relational data for unified analytics. Its SQL-based querying and deep data correlation appeal to data-driven teams. However, some users on G2 have expressed a learning curve, and the platform also lacks self-hosting.
CubeAPM is the best Observe alternative, offering cost-efficient observability at just $0.15/GB, native OpenTelemetry (OTEL), smart sampling, and real-time analytics. It also supports self-hosted deployments on customers’ cloud or on-premise infrastructure to help them comply with data residency requirements. In this article, we’ll explore the top Observe alternatives based on features, pricing, and more.
8 Best Observe Alternatives
- CubeAPM
- Dynatrace
- New Relic
- Datadog
- Splunk AppDynamics
- Elastic Observability
- Grafana Cloud
- Sumo Logic
Why are people looking for Observe alternatives?
Pricing at scale
According to Observe’s pricing page, charges are different for different capabilities. Logs charges start at $0.49/GiB, metrics start at $0.008/DPM, and traces start at $0.59/GiB. If you want unlimited retention, it costs $0.01/GiB per month. All these separate charges, once combined, can be costly for larger observability needs.
Learning curve
Many users have faced a learning curve with Observe. Observe’s proprietary query language, OPAL, enables advanced correlations but diverges from SQL or PromQL. Teams without analytics experience may find dashboard creation slower during setup. Though the platform offers Explorers and tutorials, engineers still report higher effort to build dashboards and alerts compared to visual or PromQL-based tools.
SaaS-only Hosting
Observe runs exclusively as a SaaS-hosting platform on Snowflake infrastructure. However, there’s no BYOC or self-hosted option available at the time of writing this article. But a lack of self-hosting may not be ideal for organizations with strict data residency requirements.
Criteria for selecting Observe alternatives
Look for the following aspects when choosing an observability tool for your team:
OpenTelemetry-native with smart sampling
Modern observability platforms must offer native OpenTelemetry (OTEL) ingestion for metrics, traces, and logs—ensuring vendor neutrality and easy migration. Built-in smart sampling helps capture critical latency and error data without overspending on storage or ingest.
Full MELT coverage and real-time visibility
An ideal Observe alternative should unify Metrics, Events, Logs, and Traces (MELT) in one place. Real-time dashboards and low-latency alerts enable faster troubleshooting, preventing the warehouse-style delays some users experience with Observe.
Transparent and predictable pricing
Alternatives should provide flat, ingestion-based pricing with no hidden compute or query costs. Predictable billing helps teams manage observability budgets even during workload spikes, offering clarity that’s often missing in Observe’s multi-component pricing model.
Flexible deployment options
Look for platforms supporting SaaS, BYOC, or on-premises deployments. This flexibility ensures data sovereignty, compliance with frameworks like GDPR or HIPAA, and the ability to host telemetry in your preferred region or cloud.
Responsive, engineering-led support
Top alternatives offer real-time support via Slack or chat channels, not slow ticket queues. Direct access to core engineers shortens turnaround times during incidents—essential for SRE and DevOps teams maintaining production reliability.
Observe Overview

Known for
Observe is known for its data-warehouse-powered observability platform built on Snowflake, which models logs, metrics, and traces as relational objects. It enables teams to analyze telemetry data with SQL-like queries and correlate incidents across distributed systems. Observe primarily caters to data-driven organizations that prefer centralized analytics and context-rich investigations over conventional time-series monitoring.
Standout Features
- O11y Knowledge Graph™: Connects telemetry data—logs, metrics, traces, and events—into a contextual graph for faster root-cause analysis.
- OPAL Query Language: Observe’s custom data language designed for exploring, transforming, and correlating observability data.
- Live Mode: Offers near real-time visualization of streaming data for operational insights.
- AI-powered “O11y Copilot”: Assists users in navigating the platform, querying data, and building dashboards with automation.
- Explorers Suite: Includes specialized modules like Log Explorer, Metric Explorer, Service Explorer, Kubernetes Explorer, and LLM Explorer for deep-dive investigations.
Key Features
- Unified Data Model: Treats all telemetry data as structured datasets, making cross-signal correlation seamless.
- Snowflake Integration: Leverages Snowflake’s scalability for long-term data storage and large-volume queries.
- OpenTelemetry Support: Compatible with the OpenTelemetry Collector for ingesting standardized traces, logs, and metrics.
- Sampling Controls: Offers probabilistic and tail-based trace sampling to manage ingest volume and cost.
- Powerful Dashboards: Combines live metrics, traces, and logs with a relational data model for flexible visualization.
- Unlimited Users and Alerts: Supports organization-wide collaboration without additional licensing fees.
Pros
- Unified query model for logs, metrics, and traces
- Deep correlation and context through the O11y Knowledge Graph
- Strong integration with Snowflake for scalability
- Native OpenTelemetry support
- Transparent ingestion pricing with no per-user fees
Cons
- Learning curve due to OPAL syntax
- SaaS-only architecture with no self-hosting or BYOC option
Best for
Observe is best suited for data-driven engineering, analytics, and observability teams that prioritize deep exploratory analysis over instant alerting. It fits enterprises already using Snowflake or those seeking unified telemetry correlation with a powerful query language. Teams focusing on historical analytics, cost optimization experiments, or multi-source data pipelines can benefit most from its relational observability model.
Observe Pricing & Customer Reviews
- Pricing: Logs ($0.49/GiB), Traces ($0.59/GiB), and Metrics ($0.008 per DPM). Data retention: Optional $0.01/GiB per month
- G2 rating: 4.8/5 (2 reviews)
- Praised for: Strong Snowflake integration, deep data correlation, and flexible data modeling.
- Criticized for: Learning curve, lack of self-hosting
8 Best Observe Alternatives
1. CubeAPM
Known for
CubeAPM is known for its OpenTelemetry-native observability platform that provides unified monitoring across Metrics, Events, Logs, and Traces (MELT). It is designed for teams seeking cost-efficient, full-stack visibility without vendor lock-in. CubeAPM enables real-time distributed tracing, infrastructure monitoring, log analytics, and synthetic/RUM monitoring.
Key Features
- OpenTelemetry Support: Native OTLP ingestion across all telemetry types for vendor-neutral observability.
- Smart Sampling: Context-aware sampling retains important traces (errors, latency spikes) while reducing data volume.
- MELT Coverage: Combines metrics, events, logs, and traces for 360° system visibility.
- Infrastructure Monitoring: Track hosts, containers, Kubernetes clusters, and workloads through unified dashboards.
- Synthetic and RUM Monitoring: Measure end-user experience, uptime, and frontend performance.
- Error Tracking: Identify and prioritize application exceptions with contextual insights.
- 800+ Integrations: Works seamlessly with databases, message queues, cloud services, and DevOps tools.
Standout Features
- Smart Data Retention: Unlimited retention at no additional cost for self-hosted or BYOC deployments.
- Self-Hosting & BYOC Support: Deploy CubeAPM on your cloud to meet compliance and data sovereignty needs.
- High Compatibility: Fully compatible with Datadog, New Relic, Prometheus, and Elastic ecosystems.
- Real-Time Alerting: Instant, event-driven alerts across metrics and traces for quick incident response.
Pros
- Predictable pricing; no extra fees for infrastructure or data transfer
- OpenTelemetry-native architecture with unified MELT visibility
- Fast customer support with Slack/WhatsApp access to core engineers
- BYOC and on-prem hosting to meet data residency requirements
- 800+ integrations covering cloud, infra, and app stacks
Cons
- Not ideal for teams strictly preferring managed, off-prem SaaS deployments
- Focused on observability; does not include cloud security posture management
Best for
CubeAPM is best for modern DevOps, SRE, and engineering teams that prioritize OpenTelemetry compliance, data control, and cost predictability. It’s especially suited for cloud-native and hybrid environments, regulated industries requiring data localization, and teams wanting full observability without paying per-host or user licensing fees.
Observe Pricing & Customer Reviews
- Pricing: $0.15 per GB of data ingested, with no hidden costs
- G2 Rating: 4.7/5
- Praised for: Transparent pricing, full MELT observability, and exceptional support quality
CubeAPM vs Observe
CubeAPM provides real-time observability with cost-efficiency with a simple priceof $0.15/GB for logs, metrics, and traces. But Observe’s cost is higher and different for logs, metrics, and traces. Also, CubeAPM can be fully self-hosted on customers’ cloud or on-premises, but Observe is only SaaS-hosted, no BYOC or self-hosting available.
2. Dynatrace
Known for
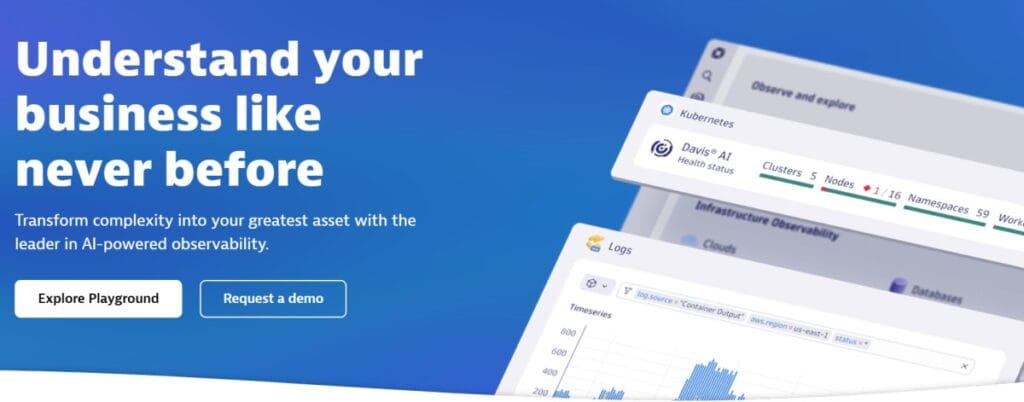
Dynatrace is known for its AI-powered, unified observability platform that brings together application, infrastructure, digital experience, logs/analytics, and business telemetry. Core platform services like Davis® AI, Grail™ data lakehouse, Dynatrace Query Language (DQL), OneAgent®, Smartscape® topology, AppEngine, AutomationEngine, and OpenPipeline provide end-to-end visibility and automation for cloud-native and enterprise environments.
Key Features
- Application Observability: APM, distributed tracing, service baselining, K8s and serverless visibility, SLOs at scale with OpenTelemetry support.
- Infrastructure Observability: Auto-discovery and intelligent monitoring across hybrid/multi-cloud with Davis AI insights.
- Digital Experience: RUM, synthetic, and session insights to connect frontend experience with backend health.
- Log Management & Analytics: Multiple pricing models (including pay-per-query) with ingest, retention, and query tiers.
- Business Analytics: Correlate technical telemetry to business KPIs and journeys for real outcomes.
Standout Features
- Davis® AI (predictive + causal + generative): Combines multiple AIs to detect anomalies, determine root cause, and accelerate remediation.
- Grail™ + DQL: A causational data lakehouse with a massively parallel engine and a powerful query language for instant, context-rich analytics.
- OneAgent® + Smartscape®: Automatic instrumentation and real-time dependency mapping across apps, services, processes, hosts, and Kubernetes.
- OpenPipeline: Unified, scalable ingestion with stream processing and extraction to simplify data routing and control.
- AppEngine & AutomationEngine: Build custom apps on platform data and automate workflows based on Davis insights.
Pros
- Deep AI assistance (Davis) for anomaly detection and root-cause
- Unified platform spanning APM, infra, logs, DEM, and business analytics
- Strong auto-discovery and automatic instrumentation with OneAgent
- Mature Kubernetes and cloud-native coverage
- Powerful query and data engine (Grail + DQL)
Cons
- Pricing and units (GiB-hour, pay-per-query logs) can be complex
- Steep learning curve, especially for smaller teams
Best for
Dynatrace is best for large enterprises and high-scale cloud-native teams that want an AI-first, all-in-one platform to correlate apps, infra, experience, logs, and business signals. If your priority is precise root-cause analytics, automatic discovery, and automation at scale—with strong Kubernetes/serverless coverage—Dynatrace’s platform services (Davis, Grail, DQL, OneAgent, Smartscape) are built for that remit.
Dynatrace Pricing & Customer Reviews
Dynatrace publishes an hourly rate card: for example, Full-Stack Monitoring at $0.01 per memory-GiB-hour, Infrastructure Monitoring at $0.04 per host-hour (any size), and Log Analytics pay-per-query with ingest & process at $0.20/GiB, retention at $0.0007/GiB-day, and query at $0.0035 (see full rate card for additional capabilities and volume discounts). The Dynatrace Platform Subscription (DPS) also enables a consolidated annual commitment you can flex across modules.
- G2 rating: 4.5/5
- Praised for: Accurate AI-powered root cause analysis, scalability, and unified data model.
- Criticized for: Expensive, learning curve
Dynatrace vs Observe
Both platforms deliver broad observability, but they differ architecturally and in pricing models. Dynatrace centers on Davis AI, Grail, and DQL for in-platform analytics with hourly rate-card pricing (e.g., memory-GiB-hour for full-stack; flexible log pricing), providing AI-assisted root-cause and automation at scale. Observe builds on a Snowflake-backed warehouse with per-GiB ingest pricing for logs/traces and metrics by DPM.
Teams that value automatic instrumentation, AI-led analysis, and a single platform spanning apps/infra/DEM/logs/business often favor Dynatrace; teams focused on SQL-like analytics atop warehouse data may prefer Observe.
3. New Relic
Known for
New Relic is known for its full-stack observability platform that unifies application monitoring, infrastructure visibility, digital experience, logs/analytics, and business telemetry. It provides developers and SREs with deep insights across distributed systems, combining APM, logs, synthetics, RUM, and mobile monitoring under one intuitive interface.
Key Features
- Application Monitoring: Offers detailed code-level visibility, distributed tracing, anomaly detection, and error tracking.
- Infrastructure Monitoring: Monitors hosts, containers, Kubernetes, and multi-cloud environments in real time.
- Digital Experience Monitoring: Includes Browser (RUM) and Mobile monitoring to connect user experience with backend performance.
- Synthetic Monitoring: Performs API, uptime, and scripted journey checks to detect performance issues before users do.
- Log Management: Collects, parses, and correlates logs with APM data for faster troubleshooting and contextual root cause analysis.
- Pathpoint Analytics: Connects application and infrastructure data to business KPIs, tracking how technical issues affect outcomes.
Standout Features
- Unified Telemetry: Combines logs, metrics, traces, and events into a single analytics pipeline.
- Extensive Integrations: Over 700 integrations across databases, cloud providers, frameworks, and DevOps tools.
- Custom Dashboards: Flexible visualizations using NRQL (New Relic Query Language) and prebuilt “Nerdpacks.”
- OpenTelemetry Support: Accepts OTLP data alongside native agents for flexible instrumentation.
- Proactive Detection: SLO tracking, alerting, and anomaly detection powered by applied intelligence.
Pros
- Unified observability across apps, infra, logs, and user experience
- 700+ integrations covering modern tech stacks
- Strong correlation between RUM, APM, and logs for full-context troubleshooting
- Easy setup with detailed documentation and onboarding
- Active developer community and plugin marketplace
Cons
- Can be costly at high data ingest volumes
- SaaS-only; no self-hosting
Best for
New Relic is best for engineering, DevOps, and SRE teams seeking a single-pane observability solution that spans from code to customer. It’s ideal for organizations using multiple cloud services and needing robust RUM, mobile, and synthetic monitoring to connect performance data with end-user experience and business KPIs.
New Relic Pricing & Customer Reviews
- Pricing: New Relic follows a usage-based pricing model, offering 100 GB/month of free data ingest and $0.40 per GB thereafter. User-based paid plans cost $49-$349 per user per month
- G2 rating: 4.4/5
- Praised for: Breadth of integrations, data correlation across layers, and reliability of RUM/synthetics.
- Criticized for: High cost
New Relic vs Observe
Both platforms deliver comprehensive observability but follow different design philosophies. New Relic focuses on real-time telemetry correlation with a flexible $0.40/GB usage model and native RUM/mobile coverage, while Observe uses a Snowflake-based warehouse with separate ingest meters for logs, traces, and metrics. Observe excels at relational analytics, whereas New Relic offers faster real-time correlation, stronger end-user monitoring, and more mature integrations.
4. Datadog
Known for
Datadog is known for its integrated observability and security platform that unifies infrastructure monitoring, APM, log management, digital experience monitoring (RUM and synthetics), error tracking, and mobile telemetry. It’s widely adopted for cloud-native workloads thanks to strong integrations, rich dashboards, and correlation across metrics, traces, logs, and user experience data.
Key Features
- Infrastructure Monitoring: Host, container, Kubernetes, network, and serverless visibility with out-of-the-box dashboards and alerts.
- Application Performance Monitoring (APM): Code-level distributed tracing, service maps, SLOs, profiling, and deep dependency insights.
- Log Management: Centralized log ingestion, processing pipelines, indexing controls, and analytics tied to APM and infra.
- Digital Experience Monitoring: Real User Monitoring (web and mobile RUM) and Synthetic tests for uptime, API checks, and scripted journeys.
- Error Tracking: Automatic issue grouping from logs, traces, and RUM events to triage, prioritize, and remediate faster.
- Platform & Integrations: Large integrations catalog, dashboards, metrics pipelines, and APIs to automate observability workflows.
Standout Features
- Cross-telemetry correlation: Seamless pivots between traces, metrics, logs, RUM, and synthetics for fast root cause analysis.
- Extensive integrations: A very large marketplace across clouds, databases, queues, runtimes, CI/CD, and collaboration tools.
- Service Catalog & Ownership: Centralizes service metadata, on-call, and runbooks alongside health and dependencies.
- CI Visibility & Profiling: Build/test analytics and a continuous profiler to optimize performance and costs.
- Mobile RUM & Session Replay: Connects mobile app performance and errors to backend traces and infra signals.
Pros
- Broad product surface covering infra, APM, logs, RUM, synthetics, security
- Strong cross-signal correlation and polished dashboards
- Mature Kubernetes and cloud ecosystem support
- Large integrations marketplace and solid documentation
- Granular pipelines and controls for data processing
Cons
- Pricing can be expensive at scale
- No self-hosting; only SaaS
Best for
Datadog is best for teams that want a single, polished SaaS to monitor everything from hosts and containers to services, logs, browser/mobile experience, and synthetic uptime. It fits organizations that value fast time-to-value, broad integrations, and cross-telemetry correlation across large, dynamic cloud environments.
Datadog Pricing & Customer Reviews
- Pricing: Infrastructure Monitoring starts at $15/host per month, APM at $31/host per month, and Log Management is billed by GB ingested and indexed. Synthetics are priced at roughly $7.20 per 10,000 API tests and $12 per 1,000 browser tests, while RUM and session replay are billed separately per 1,000 sessions.
- G2 rating: 4.4/5
- Praised for: Wide product breadth, strong integrations, and fast cross-signal troubleshooting.
- Criticized for: Cost complexity at scale and the effort needed to tune ingest, indexing, and retention.
Datadog vs Observe
Both Datadog and Observe offer end-to-end visibility, but they differ in architecture and billing. Datadog provides a modular SaaS platform with per-product meters (hosts, GB of logs, RUM sessions, and synthetic runs) and tight correlation across services, infra, and user experience.
Observe leans on a warehouse-style model with per-GiB rates for logs/traces and DPM for metrics, favoring relational analytics. Teams prioritizing speed to onboard, rich out-of-the-box dashboards, and broad integrations often prefer Datadog; teams seeking SQL-like analytics on warehouse data and object relationships may lean toward Observe.
5. Splunk AppDynamics
Known for
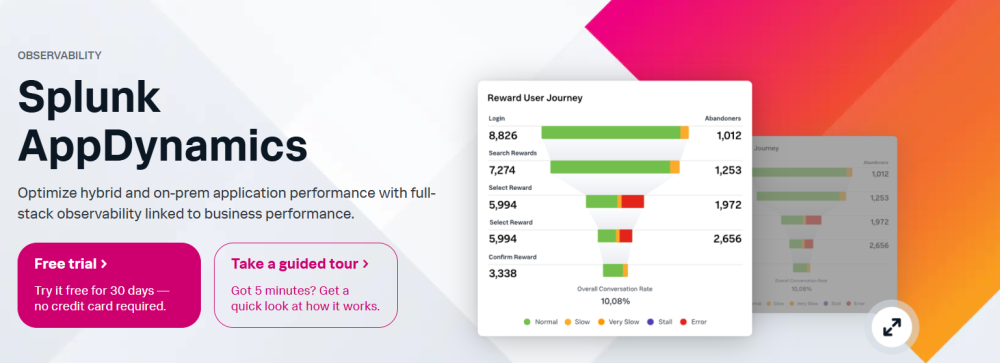
Splunk AppDynamics is known for full-stack application performance monitoring tied to business outcomes, with strong coverage for hybrid and on-prem, three-tier, and SAP environments. It helps teams quickly detect issues, trace them to code, database, or infrastructure layers, and align fixes to customer and revenue impact through prebuilt business journey views.
Key Features
- Application Performance Monitoring: Code-level diagnostics, flow maps, business transactions, and database visibility.
- Infrastructure Monitoring: Real-time health for servers, containers, networks, and supporting services.
- Digital Experience Monitoring: RUM and synthetic monitoring to capture web and mobile experience.
- Business Analytics: Journey dashboards (e.g., order-to-cash) to tie technical health to KPIs.
- Security in Runtime: Application security to detect and prioritize vulnerabilities within running apps.
Standout Features
- Hybrid & SAP depth: Purpose-built capabilities for SAP and traditional three-tier applications.
- Business context out of the box: Preconfigured dashboards linking performance to business outcomes.
- Tight Splunk alignment: Click-through to Splunk log analytics for deeper investigations.
- Agent-assisted precision: Automatic discovery and baselining to speed up root-cause analysis.
- Enterprise controls: Robust role-based access and governance for large estates.
Pros
- Strong fit for hybrid/on-prem and SAP-centric estates
- Clear business-journey mapping and KPI alignment
- Deep application diagnostics with fast root-cause paths
- Seamless handoff to Splunk logging for advanced analysis
- Enterprise-grade RBAC and governance
Cons
- Alert issues
- Update cycle is slower
Best for
Splunk AppDynamics is best for enterprises running complex, revenue-critical applications—especially hybrid, on-prem, and SAP—who want code-to-business visibility with clear journeys and KPI mapping. It’s a strong choice when you need deep APM diagnostics, governed operations, and tight interoperability with Splunk’s broader observability and logging capabilities.
Splunk AppDynamics Pricing & Customer Reviews
- Pricing: Infrastructure edition starts at $6 per vCPU/month (billed annually); APM (Applications) starts at $33 per vCPU/month (billed annually); Enterprise edition starts at $50 per vCPU/month (billed annually)
- G2 rating: 4.3/5
- Praised for: Deep diagnostics, business journey views, and SAP/hybrid strengths
- Criticized for: alert issues
Splunk AppDynamics vs Observe
Both aim for end-to-end visibility, but they take different paths. Splunk AppDynamics emphasizes deep APM diagnostics with business context for hybrid and SAP estates, using vCPU-based editions and add-ons. Observe focuses on a warehouse-driven analytics model with per-GiB meters for logs/traces and DPM for metrics.
If you need code-level troubleshooting tied directly to KPIs—and especially if you run on-prem or SAP—AppDynamics is a stronger operational fit. If you prefer SQL-like analytics atop a telemetry data warehouse, Observe will feel more natural.
6. Elastic Observability
Known for
Elastic Observability is known for an open, unified observability stack that brings logs, metrics, traces, synthetics, and digital experience monitoring together on the Elastic platform. Teams use Elastic to ingest high-volume telemetry, analyze it in Elasticsearch, and visualize and alert in Kibana—blending powerful search with AI-assisted troubleshooting for cloud-native and hybrid estates.
Key Features
- Application Performance Monitoring (APM): Code-level insights, distributed tracing, errors, and service maps with OpenTelemetry support.
- Log Monitoring: Scalable collection, enrichment, search, and correlation of logs across services and infrastructure.
- Infrastructure Monitoring: Host, container, Kubernetes, and cloud service visibility with curated dashboards.
- Digital Experience Monitoring: RUM, synthetic uptime, and user experience analytics to tie front end to back end.
- Analytics & ML: Query and visualize telemetry in Kibana with anomaly detection and alerting.
Standout Features
- OpenTelemetry-ready ingestion: Elastic APM Server accepts OTLP, so you can standardize on OTel SDKs and collectors.
- Flexible deployment models: Serverless Elastic Cloud, hosted Elastic Cloud, or self-managed for maximum control.
- Search-first workflows: Elasticsearch under the hood enables fast ad-hoc investigations across massive datasets.
- Digital experience suite: Built-in RUM and synthetics to connect user journeys with back-end telemetry.
- Interactive sandboxes: Public demo to explore APM, logs, infra, and uptime with live data.
Pros
- Open and flexible stack with strong OTel support
- Powerful search and visualization for high-volume data
- Multiple deployment options (serverless, hosted, self-managed)
- Broad MELT coverage, including RUM and synthetics
- Mature ecosystem and documentation
Cons
- Setup is complex
- Learning curve for Elasticsearch/Kibana and query tooling
- Costly premium support (5-15% of billing)
Best for
Elastic Observability is best for teams that want an open, search-centric approach with the freedom to run serverless SaaS, hosted cloud, or self-managed. It suits organizations ingesting large log/trace volumes that value fast ad-hoc querying, OpenTelemetry pipelines, and built-in RUM/synthetics—from startups standardizing on OTel to enterprises that need flexible data residency and deployment choices.
Elastic Observability Pricing & Customer Reviews
- Pricing: Cloud-hosted: starts at $99/month; Serverless: $0.09/GB for full-stack observability; self-hosted: custom
- G2 rating: 4.2/5
- Praised for: Flexible deployment options, strong search/visualization, and solid OTel support.
- Criticized for: Learning curve, alert issues
Elastic Observability vs Observe
Both platforms cover MELT and integrate with OpenTelemetry, but they differ in architecture and pricing meters. Observe runs a warehouse-centric model with per-GiB ingest for logs/traces and DPM for metrics, emphasizing relational analytics.
Elastic offers search-first observability with options for serverless per-GB ingest/retention pricing or hosted/self-managed footprints, giving teams more flexibility over deployment and data control—particularly useful when you need to fine-tune storage tiers, retention, and egress to match workload economics.
7. Grafana Cloud

Known for
Grafana Cloud is known for a managed, OSS-aligned observability stack that unifies metrics (Mimir), logs (Loki), traces (Tempo), profiles (Pyroscope), RUM, synthetics, and alerting in one SaaS. It emphasizes OpenTelemetry/Prometheus-first workflows, powerful dashboards, and cost-optimization features like Adaptive Metrics and tiered pricing for high-volume telemetry.
Key Features
- Application Observability: Out-of-the-box APM views built on OpenTelemetry and Prometheus with RED/SLO insights.
- Logs: Fully managed log aggregation powered by Loki with query, label-based filtering, and export to your own object storage.
- Traces: Managed Tempo backend for distributed tracing, metrics-from-traces, and tight links to logs/metrics in Grafana.
- Metrics: Managed Mimir with active series/DPM accounting, Adaptive Metrics to curb cardinality, and long retention options.
- Synthetics & Frontend: Global API and browser tests plus RUM for end-user experience, all correlated with backend signals.
- Alerting & Automation: Centralized alerting, IRM/on-call, and cost management/billing tools for usage governance.
Standout Features
- Open standards-first: Native OpenTelemetry and Prometheus ingestion to avoid vendor lock-in.
- OSS lineage: Loki/Tempo/Mimir/Pyroscope foundation with seamless cross-navigation in Grafana.
- Cost controls: Adaptive Metrics and clear per-GB/per-series pricing with a useful free tier for logs/traces/metrics.
- Flexible products: Choice of Application Observability (host-hour) or building blocks (metrics/logs/traces) à la carte.
- Deep correlations: Click-through workflows between traces, logs, metrics, and RUM/synthetics in one UI.
Pros
- Strong OpenTelemetry and Prometheus alignment
- Broad MELT coverage with OSS backends (Loki/Tempo/Mimir)
- Useful free tier and granular pricing knobs
- Mature dashboards and visualization with a large plugin ecosystem
- Good cost-optimization features for high-cardinality data
Cons
- Complex setup
- Best experience often needs Prometheus/OTel expertise
Best for
Grafana Cloud is best for teams standardizing on OpenTelemetry/Prometheus that want a managed version of the LGTM (Loki-Grafana-Tempo-Mimir) stack. It’s a great fit for organizations needing cost-conscious scale, rich dashboards, and end-to-end correlation, without running their own clusters, spanning cloud-native apps, Kubernetes, and SLO-driven operations.
Grafana Cloud Pricing & Customer Reviews
- Pricing: Free tier includes 10k active series, 50 GB logs, 50 GB traces, 14-day retention, and 3 active users for visualization. Metrics Pro at $6.50 per 1k active series (with a $19/month platform fee), Logs at $0.50/GB ingested, Traces at $0.50/GB, Application Observability at $0.04/host-hour, RUM at $0.90 per 1k sessions, and Synthetics at $5 per 10k API tests / $50 per 10k browser tests.
- G2 rating: 4.5/5
- Praised for: Open standards, powerful dashboards, and cost controls (Adaptive Metrics)
- Criticized for: Setup complexity and learning curve
Grafana Cloud vs Observe
Both provide end-to-end observability, but Grafana Cloud leans on open-source backends (Loki/Tempo/Mimir) with clear per-series/per-GB/host-hour meters and an actually useful free tier. Observe centers on a warehouse-style model with per-GiB logs/traces and DPM for metrics, emphasizing relational analytics over OSS alignment.
8. Sumo Logic
Known for
Sumo Logic is known for a cloud-native observability and security analytics platform that centralizes logs, metrics, traces, and events with built-in dashboards, alerting, and compliance/audit use cases. Its solutions span application observability, infrastructure monitoring, log analytics, audit & compliance, and security, designed to speed up troubleshooting and elevate reliability at scale.
Key Features
- Application Observability: Integrated views for services and microservices with tracing, metrics, and correlated logs.
- Infrastructure Monitoring: Health and performance across hosts, containers, Kubernetes, and cloud resources.
- Log Analytics: Powerful collection, enrichment, search, and analytics for high-volume logs.
- Audit & Compliance: Prebuilt content for audit trails, compliance reporting, and governance workflows.
- Security Analytics: “Logs for Security” to surface threats and anomalies from operational telemetry.
Standout Features
- Continuous Intelligence Platform: Unifies telemetry to accelerate root-cause analysis and reduce MTTR.
- Zero-dollar ingest (Flex): Flex pricing emphasizes $0 ingest and paying for analytics/search activity.
- Credit-based pricing: Flexible credits that allocate to ingest, storage, and scanned GB for search.
- Correlation & dashboards: Out-of-the-box content and curated dashboards for common stacks.
- SaaS simplicity: Managed platform with rapid onboarding and no cluster administration.
Pros
- Strong logs-first analytics with integrated metrics and traces
- Simple SaaS onboarding and out-of-the-box content
- Flexible credit-based model with $0 ingest (Flex)
- Useful audit/compliance and security-oriented workflows
- Good coverage for modern microservices and Kubernetes
Cons
- Credit/scan-based pricing can be tricky to forecast for heavy query workloads
- Learning curve
- UI issues
Best for
Sumo Logic is best for teams that want a SaaS-first, logs-centric observability platform with seamless expansion into application observability, infrastructure monitoring, and audit/security use cases. It suits organizations that value fast onboarding, built-in dashboards, and compliance reporting, while retaining the ability to correlate traces and metrics with large-scale log data.
Sumo Logic Pricing & Customer Reviews
- Pricing: Starts $3.14 per TB of scanned data; Sumo Logic follows its Flex Pricing model, which emphasizes $0 ingest and a pay-per-analytics approach. This means organizations don’t pay to ingest or index logs but instead pay based on how much data they analyze or scan during searches and dashboards. The pricing is credit-based, where credits are consumed for scanning, retention, and analytics activities.
- G2 rating: 4.3/5
- Praised for: Logs-first strength, rapid onboarding, and strong audit/security visibility
- Criticized for: Forecasting scan costs and credit consumption in very large environments
Sumo Logic vs Observe
Both platforms deliver SaaS-based observability, but their pricing meters and architectural emphasis differ. Observe uses per-GiB meters for logs/traces and DPM for metrics on a warehouse-driven model focused on relational analytics. Sumo Logic emphasizes logs-first workflows with $0 ingest (Flex) and credits tied to analytics/search, plus integrated solutions for app observability, infra monitoring, and audit/security. Teams prioritizing rapid SaaS onboarding, strong log analytics, and compliance reporting often find Sumo Logic a pragmatic alternative to Observe.
Conclusion
Observe offers a powerful data warehouse–style approach to observability, but often challenges users with complex pricing, no self-hosting options, and a steep learning curve.
CubeAPM solves these problems with a predictable $0.15/GB pricing, OpenTelemetry-native architecture, full MELT coverage, and smart sampling that keeps data costs low while preserving precision. It also offers full self-hosting to help meet data residency requirements and faster customer support.
Book a free demo with CubeAPM to explore the platform.
Disclaimer: The information in this article reflects the latest details available at the time of publication and may change as technologies and products evolve.
FAQs
1. What are the best alternatives to Observe in 2026?
Some of the top alternatives include CubeAPM, Dynatrace, New Relic, Datadog, Splunk AppDynamics, Elastic Observability, Grafana Cloud, and Sumo Logic.
2. Why are teams moving away from Observe?
Users cite pricing complexity, no self-hosting, and a learning curve as major issues with Observe.
3. Why is CubeAPM considered the best Observe alternative?
CubeAPM offers OpenTelemetry-native ingestion, predictable pricing, and full MELT coverage, ensuring complete observability without hidden costs.
4. How does CubeAPM pricing compare to Observe?
CubeAPM costs $0.15/GB of data ingested, with no extra fees for infrastructure or data transfer, which is lower than Observe’s pricing.
5. Does CubeAPM support both cloud and on-prem deployments?
Yes. CubeAPM supports full self-hosting on your cloud or on-premise infrastructure, useful for organizations needing data sovereignty and compliance.


