Laravel is one of the most popular PHP frameworks for modern web apps, known for its clean syntax and rich ecosystem. But as applications scale, maintaining visibility across Eloquent queries, Horizon queues, and Blade rendering becomes harder. Performance issues like slow requests or hidden N+1 queries often go unnoticed until they affect users.
CubeAPM simplifies Laravel observability by providing framework-aware instrumentation out of the box — automatically tracing HTTP requests, Artisan commands, and queued jobs. Its OpenTelemetry-native design ensures every event, metric, and trace is correlated, helping teams pinpoint slow code paths and optimize Laravel performance faster.
In this guide, we’ll explore the best Laravel monitoring tools, compare their framework support, features, and scalability, and help you find the best technical fit for your Laravel workloads.
Best Laravel Monitoring Tools
- CubeAPM
- Atatus
- Stackify Retrace
- Datadog
- New Relic
- Dynatrace
- Sentry
- Inspector.dev
What Is Laravel Monitoring
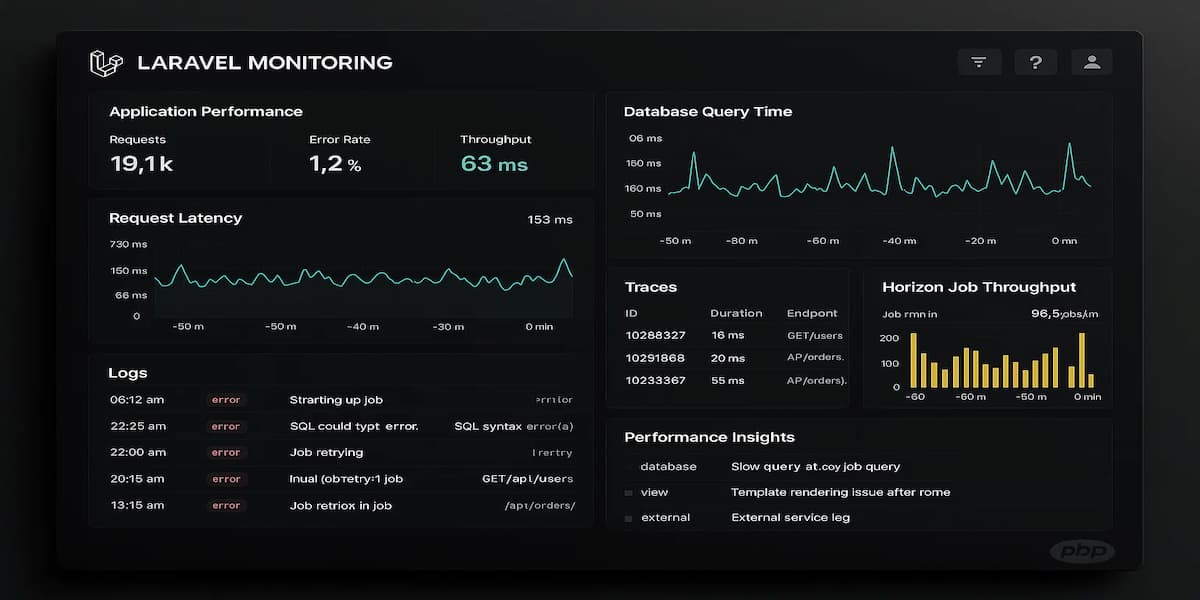
Laravel monitoring is the continuous tracking of application performance, errors, and resource usage across your Laravel ecosystem — including web requests, database queries, queues, and background jobs. It helps developers identify performance bottlenecks, slow Eloquent operations, failed jobs, or inefficient caching before they affect users.
A good monitoring setup for Laravel typically covers:
- HTTP Request Metrics: Track response time, throughput, and error rate for routes and controllers.
- Database Query Performance: Detect slow or redundant queries through Eloquent and Query Builder.
- Queue and Job Monitoring: Measure processing time, job failures, and Horizon queue performance.
- Cache and External Services: Observe cache hit/miss ratios and latency in API or Redis calls.
- Exception Tracking: Capture and group application errors with full stack traces and context.
- Infrastructure and PHP Runtime Metrics: Monitor CPU, memory, and worker utilization to catch early resource exhaustion.
Laravel monitoring tools combine metrics, logs, and distributed traces to give full-stack visibility — helping teams pinpoint exactly where and why performance degrades inside the framework’s request lifecycle.
Example: How CubeAPM Handles Laravel Monitoring
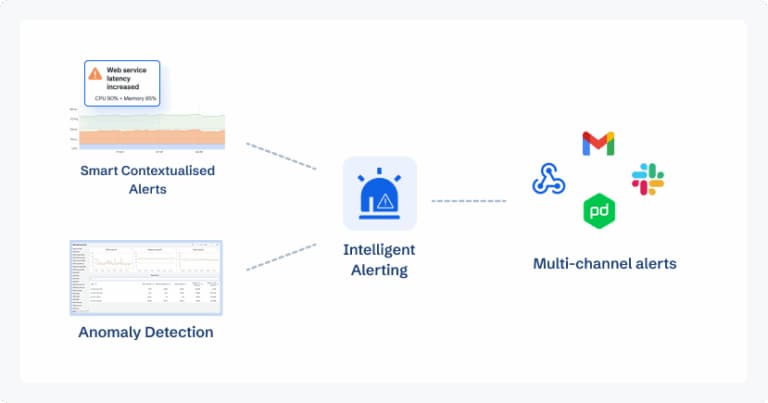
CubeAPM provides native support for Laravel and PHP through its OpenTelemetry-based agent, making it easy to capture framework-specific metrics and traces without heavy configuration. Once integrated, CubeAPM automatically instruments the full Laravel lifecycle — from HTTP requests and middleware execution to Eloquent queries and queued jobs.
- Automatic HTTP Tracing: Every incoming request is traced end-to-end, showing controller execution time, route performance, and status codes.
- Database Query Insights: CubeAPM tracks query duration, table access, and N+1 patterns from Eloquent ORM, helping developers identify inefficient SQL.
- Queue & Horizon Monitoring: Job dispatch and processing metrics are correlated with application traces, revealing bottlenecks in background workers.
- Error Correlation: Exceptions and failed requests are linked with their traces and logs, enabling faster debugging with full context.
- Dashboard Templates: Prebuilt Laravel dashboards visualize response time, queue latency, and database performance at a glance.
By unifying metrics, logs, and traces in one view, CubeAPM gives Laravel teams a clear picture of how each layer — controller, model, or job — impacts overall performance. Whether you deploy via SaaS or self-host, CubeAPM’s lightweight PHP agent ensures minimal overhead and maximum visibility into every Laravel request.
Why Teams Choose Different Laravel Monitoring Tools
1. Cost Model and Data Gravity
As Laravel applications scale, observability data grows exponentially — from HTTP traces to queue logs and database metrics. Many teams struggle with unpredictable costs as vendors charge separately for logs, APM, and infrastructure hosts. This drives teams toward solutions that offer transparent, usage-based, or flat-rate models, allowing them to scale observability without surprise overages.
2. Framework Depth and Real Laravel Awareness
Generic PHP monitoring often fails to capture Laravel-specific signals like Eloquent query performance, Horizon queue latency, or Blade rendering time. Teams prefer tools that natively understand the Laravel lifecycle — providing deep visibility into middleware execution, job processing, and ORM behavior. Framework-aware instrumentation dramatically improves debugging speed and accuracy.
3. OpenTelemetry Adoption and Vendor Neutrality
Laravel teams increasingly prefer OpenTelemetry-based solutions to avoid vendor lock-in. OTEL’s standardization allows developers to instrument once and export telemetry anywhere — whether to a managed APM or an in-house backend. Tools that natively integrate with OTEL collectors make it easier to future-proof observability pipelines and reduce integration friction.
4. Agent Overhead and Sampling Strategy
In high-throughput Laravel environments — such as API-heavy or queue-driven systems — agent overhead can affect performance. Teams evaluate how efficiently a monitoring agent collects traces and how smartly it samples data. Lightweight agents that support adaptive or head-based sampling help maintain full coverage without inflating compute or storage costs.
5. Queue and Job Observability
Since Laravel applications rely heavily on background jobs, Horizon, and Redis-backed queues, visibility into job execution time and failure rate is crucial. The best monitoring tools correlate job metrics with application traces, making it easier to spot retry loops, bottlenecks, or misconfigured workers before they impact throughput.
6. Error Monitoring and Trace Correlation
Error tracking is only useful when tied to contextual traces. Tools that can automatically link exceptions, logs, and HTTP requests help developers pinpoint the exact failing component — whether it’s a Blade template, controller, or database call. This correlation reduces mean time to resolution and improves developer productivity.
7. Ecosystem Integrations and Automation
Teams also evaluate how seamlessly a monitoring tool connects with their broader ecosystem — CI/CD systems, incident management platforms, and alerting tools like Slack or PagerDuty. Out-of-the-box dashboards and automation workflows accelerate adoption and simplify how alerts translate into actionable responses.
Top 8 Laravel Monitoring Tools
1. CubeAPM
Known For
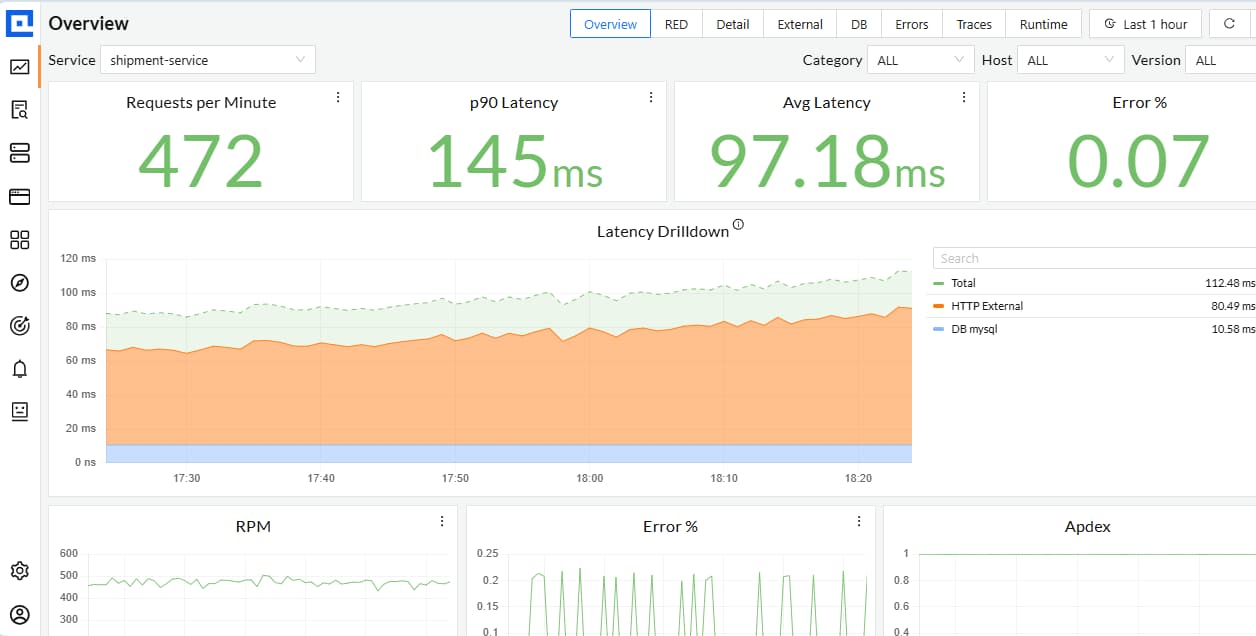
CubeAPM is an OpenTelemetry-native observability platform built for developers who need deep visibility into Laravel and PHP applications. It unifies metrics, logs, and traces in a single platform with flexible SaaS or BYOC deployment options.
Laravel Monitoring Features
- Monitors controller, middleware, and route performance.
- Detects slow queries and Eloquent N+1 issues.
- Tracks job duration, retries, and worker health.
- Links exceptions and stack traces to related spans.
- Prebuilt templates for Laravel latency, queue throughput, and query load.
Key Features
- OpenTelemetry-native ingestion with 800+ integrations.
- Full MELT visibility with Smart Sampling and trace retention.
- Lightweight PHP agent with minimal overhead.
- RBAC, SSO, and audit logging for enterprise control.
- Supports SaaS, self-hosted, and BYOC deployments.
Pros
- Laravel-specific instrumentation with zero-code setup.
- Unified dashboards for metrics, logs, and traces.
- Cost-efficient and scalable for large telemetry volumes.
- Works seamlessly across modern DevOps stacks.
Cons
- Smaller plugin ecosystem than legacy APM tools.
- Limited built-in integrations for niche alerting platforms.
Pricing
Flat-based pricing of 0.15/GB of data ingested
CubeAPM Laravel Monitoring Pricing at Scale
*All pricing comparisons are calculated using standardized Small/Medium/Large team profiles defined in our internal benchmarking sheet, based on fixed log, metrics, trace, and retention assumptions. Actual pricing may vary by usage, region, and plan structure. Please confirm current pricing with each vendor.
For a mid-sized SaaS company ingesting 45TB(~45,000) total monthly data ingestion and 45,000TB of observability data outcharged by the cloud provider, the total cost will be about ~$7200/month.
Tech Fit
CubeAPM is ideal for Laravel SaaS, multi-tenant platforms, and enterprise APIs requiring high visibility and flexible deployment. It suits teams adopting OpenTelemetry or moving away from costly vendor-locked APMs. With native Laravel instrumentation, strong MELT coverage, and easy self-hosting, CubeAPM enables fast root-cause analysis and consistent performance monitoring across all layers of a Laravel stack.
2. Atatus
Known For
Atatus is a full-stack observability platform that combines APM, log analytics, real user monitoring, infrastructure metrics, and synthetic checks within a single interface. It’s known for its simplicity, lightweight agents, and clear visibility into application performance from code to infrastructure.
Laravel Monitoring Features
- Automatic instrumentation for Laravel controllers, middleware, and routes.
- Query tracing for Eloquent ORM and raw SQL with latency tracking.
- Error and exception capture with detailed stack traces.
- Queue and job monitoring to detect delays and failures in Horizon.
- Unified dashboards correlating logs, traces, and metrics across Laravel services.
Key Features
- Unified APM, logs, infrastructure, and RUM in one platform.
- OpenTelemetry ingestion compatibility.
- Smart dashboards and custom alerting.
- Lightweight agents with minimal performance overhead.
- Multi-environment support for cloud and on-prem workloads.
Pros
- All-in-one observability with a single interface.
- Straightforward setup and Laravel agent support.
- Transparent tiered pricing that’s easy to calculate.
- Real-time tracing with low instrumentation friction.
Cons
- Host-hour pricing can become expensive with dynamic scaling.
- Steep learning curve for new users.
- Complex initial setup
Pricing
- APM / Host Monitoring: $0.07 per host-hour.
- Infrastructure Monitoring: $0.021 per host-hour.
- Log Ingestion: $2 per GB per month.
- RUM and Synthetic Monitoring: Charged per event, session, or test run.
Atatus Laravel Monitoring Pricing at Scale
Atatus charges based on host-hour usage for APM and infrastructure monitoring, making it easier to forecast costs for steady workloads. For a mid-sized company ingesting 45 TB (~45, 000 GB) of telemetry from Laravel applications each month and running 125 hosts, the total cost would be approximately ~$6,300/month (50 hosts × 720 hours × ($0.07 + $0.021) = $3,276). This estimate covers full-stack APM and infrastructure visibility without factoring in optional log ingestion. Atatus remains a practical option for Laravel teams that value simplicity and unified monitoring, though cost efficiency depends on maintaining a consistent number of active hosts.
Tech Fit
Atatus fits well for small to medium Laravel teams or agencies seeking full-stack observability without complex setup. It’s especially effective for applications with steady infrastructure footprints and moderate data volumes.
3. Stackify Retrace
Known For
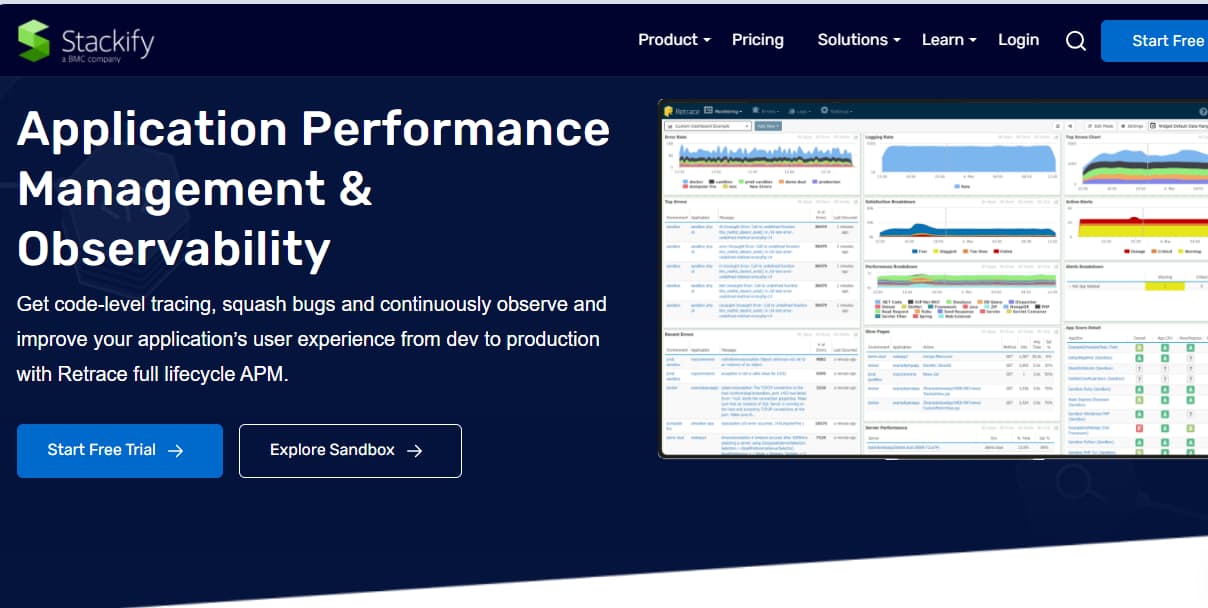
Stackify Retrace, now part of BMC Software, is an all-in-one APM and log management platform built specifically for developers. It combines code profiling, tracing, logging, and error tracking under a single interface. Retrace was designed to give PHP and Laravel teams production-ready insights without needing multiple tools for application performance, errors, and infrastructure monitoring.
Laravel Monitoring Features
- Automatic tracing for Laravel controllers, routes, and middleware.
- Query performance tracking for Eloquent ORM and raw SQL.
- Exception and error detection with contextual trace data.
- Queue and job monitoring with timing and retry visibility.
- Real-time log correlation with performance traces.
Key Features
- Unified APM, logging, and code profiling in one platform.
- Low-overhead agent suitable for production workloads.
- Centralized error tracking and alerting tied to application traces.
- Environment segmentation for development, staging, and production.
- Support for PHP, .NET, Node.js, and other popular backend stacks.
Pros
- Developer-centric design focused on debugging speed.
- Combines profiling, logging, and tracing in one dashboard.
- Strong PHP/Laravel compatibility with minimal configuration.
- Clear visibility into query performance and slow transaction analysis.
Cons
- Complex and unintuitive interface.
- Steep learning curve.
- Challenging configuration of integrations.
Pricing
Tier 1 (Annual Plan): $80/month — includes 1,500 host hours and 5 GB of data.
- Additional Host Hours: $0.055 per host-hour
- Additional Data: $0.89 per GB
Tier 2 (Annual Plan): $249/month — includes 5,000 host hours and 50 GB of data.
- Additional Host Hours: $0.050 per host-hour
- Additional Data: $0.89 per GB
Enterprise Retrace (Custom Plan): Custom pricing for large deployments or on-prem usage.
Stackify Retrace Laravel Monitoring Pricing at Scale
For a mid-sized company ingesting 10 TB (10,000 GB) of telemetry from Laravel applications each month and running 50 hosts, the cost under the Tier 2 plan can be estimated as follows: included data covers 50 GB, leaving 9,950 GB billed at $0.89 per GB = $8,855; included host hours cover 5,000, and the remaining 31,000 hours (50 hosts × 720 = 36,000 − 5,000) are billed at $0.05 = $1,550. Adding the base plan fee of $249 brings the total to approximately $10,654 per month ($8,855 + $1,550 + $249). While Retrace’s pricing model is transparent, heavy data volumes from verbose Laravel logging or queue traces can quickly drive monthly costs higher, making it better suited for teams optimizing ingestion or using moderate data retention windows.
Tech Fit
Stackify Retrace is a strong fit for Laravel and PHP teams that need deep code-level visibility, live profiling, and log correlation without maintaining multiple tools. It’s ideal for small-to-mid enterprises or SaaS companies focused on improving application reliability and developer efficiency. For teams seeking a developer-friendly APM that balances performance diagnostics with usability, Retrace provides a focused, Laravel-ready solution with comprehensive trace and log context.
4. Datadog
Known For
Datadog is one of the most established observability platforms, offering comprehensive monitoring for infrastructure, applications, logs, and security. It’s a top choice for DevOps teams seeking unified dashboards, AI-powered anomaly detection, and seamless integrations with cloud ecosystems. For Laravel workloads, Datadog’s PHP tracer delivers end-to-end visibility — from controller execution to database latency and background job performance.
Laravel Monitoring Features
- Automatic instrumentation for Laravel controllers, middleware, and routes.
- Query performance tracking for Eloquent ORM and raw SQL.
- Real-time visibility into Horizon queues, Redis, and job throughput.
- Error detection with contextual trace correlation.
- Prebuilt dashboards for response time, error rate, and database latency.
Key Features
- Unified APM, infrastructure, and log analytics platform.
- 900+ integrations across CI/CD, cloud, and security tools.
- AI-powered anomaly detection and adaptive alerting.
- Distributed tracing with service maps and custom tagging.
- Custom dashboards for detailed metric visualization.
Pros
- Excellent visualization for complex, multi-layer Laravel stacks.
- Seamless integrations with major cloud and DevOps ecosystems.
- Reliable distributed tracing across services and queues.
- Mature SaaS platform with strong automation and alerting.
Cons
- Costs can scale steeply with data ingestion and host count.
- Pricing structure is complex across APM, logs, and metrics.
Pricing
- APM (Pro Plan): $35/host/month
- Infra (Pro Plan): $15/host/month
- Ingested Logs: $0.10 per ingested or scanned GB per month
Datadog Laravel Monitoring Pricing at Scale
For a mid-sized SaaS company operating 125 APM hosts, 40 profiled hosts, 100 profiled container hosts, 500,000,000 indexed spans, 200 infra hosts, 1,500,000 container hours, 300,000 custom metrics, and ingesting around 10TB(~10,000 GB) of logs per month with 3500 indexed logs, the monthly cost would be around ~$27,475/month.
Tech Fit
Datadog is ideal for enterprise-scale Laravel environments running across hybrid or multi-cloud infrastructures. It suits teams that prioritize cross-service observability, automation, and proactive alerting over cost predictability. For organizations already using Datadog for infrastructure or log monitoring, extending APM to Laravel ensures unified insight.
5. New Relic
Known For
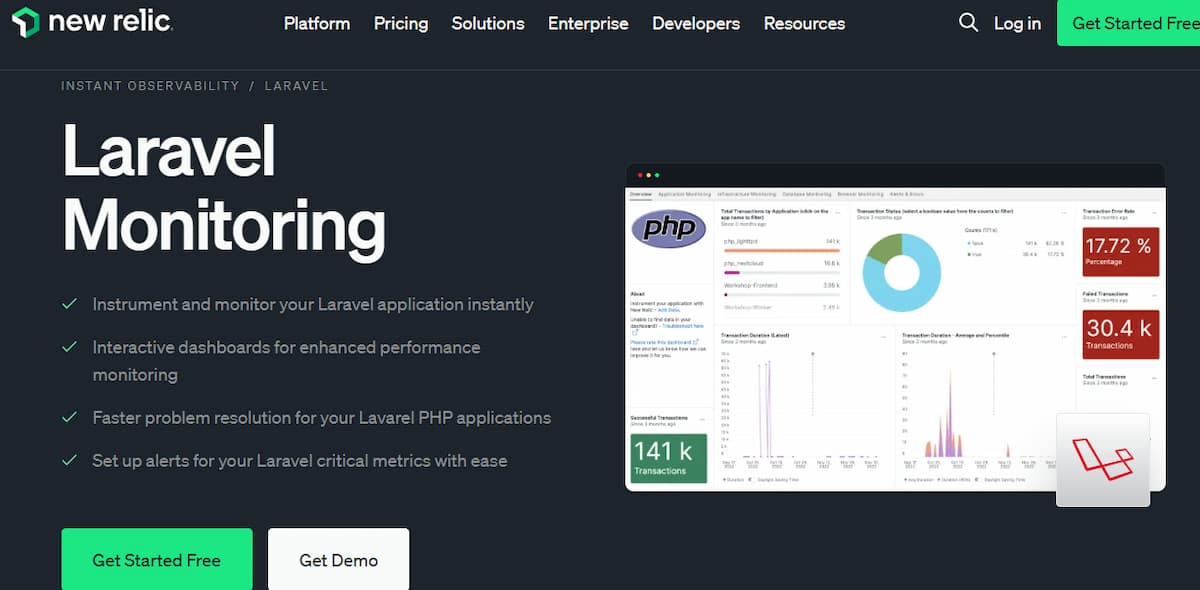
New Relic is a full-stack observability platform known for its unified data model and flexible usage-based pricing. It provides deep application performance insights, infrastructure visibility, and log analytics under a single platform. For Laravel developers, New Relic’s PHP agent enables real-time performance tracking and transaction-level visibility across web requests, queries, and queue workloads.
Laravel Monitoring Features
- Automatic instrumentation for Laravel controllers, middleware, and background jobs.
- Eloquent ORM query tracing with timing and execution metrics.
- Error and exception tracking with contextual span data.
- Detailed transaction maps showing controller-to-database latency.
- Custom dashboards for route performance and API response time.
Key Features
- Unified telemetry ingest for logs, metrics, and traces.
- OpenTelemetry support with cross-service correlation.
- AI-powered error detection and anomaly analysis.
- Real-time user, browser, and mobile performance tracking.
Pros
- Clean, developer-friendly interface with strong PHP/Laravel support.
- Transparent usage-based pricing model with no host licensing.
- Broad ecosystem integrations and open-source instrumentation.
- Unified data layer simplifies correlation across services.
Cons
- Costs can rise sharply with high data ingestion or long retention periods.
- User-based licensing adds complexity for large teams.
Pricing
- Free tier: 100GB/month of data ingested
- Data Ingest: $0.40 per GB ingested beyond the free 100GB
- Full Platform Users: $418.80 per user/month
New Relic Laravel Monitoring Pricing at Scale
A mid-sized SaaS company ingesting 45TB (~45,000 GB) of telemetry data per month and with 10 full users, the cost would come around ~$25,990/month.
Tech Fit
New Relic is best suited for Laravel applications running at scale where teams want granular visibility without managing agents or self-hosting infrastructure. It fits organizations emphasizing developer productivity, clean dashboards, and unified observability across front-end, back-end, and database layers. For Laravel teams that value simplicity and real-time analytics, New Relic offers a flexible yet premium option.
6. Dynatrace
Known For
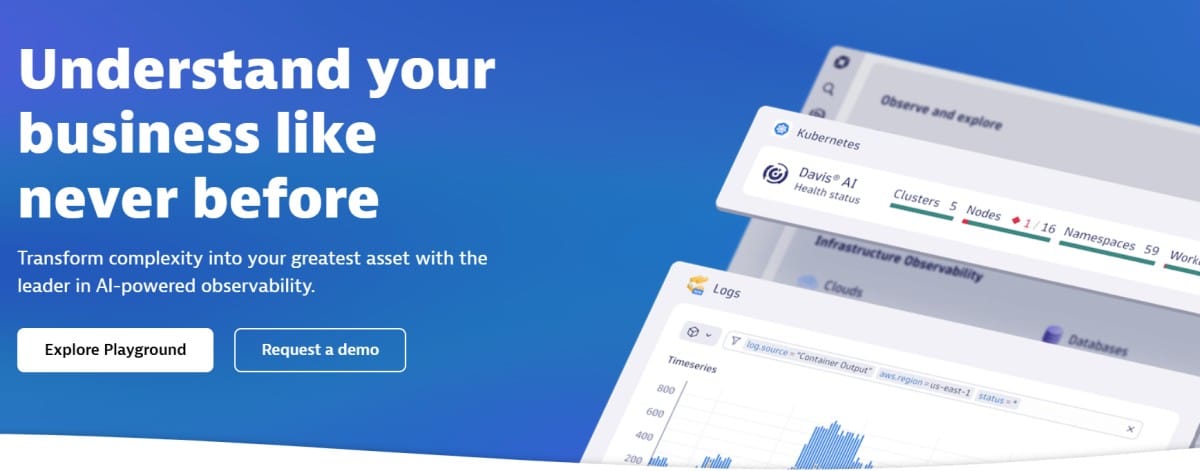
Dynatrace is an enterprise-grade observability and application performance management platform, widely recognized for its AI-driven root cause analysis (Davis AI) and single-agent architecture. It provides automatic instrumentation, code-level tracing, and deep infrastructure analytics across cloud and hybrid environments. For Laravel developers, Dynatrace brings strong PHP support with real-time insight into application dependencies, database bottlenecks, and user experience metrics.
Laravel Monitoring Features
- Auto-instrumentation for Laravel controllers, middleware, and service containers.
- End-to-end tracing of Eloquent ORM queries and cache operations.
- Horizon and job queue performance tracking with execution timing.
- Error and exception visibility through AI-assisted root cause mapping.
- Unified dashboards for latency, throughput, and user experience.
Key Features
- OneAgent architecture with automatic dependency discovery.
- Davis AI for anomaly detection and automated RCA.
- Full-stack coverage: APM, infra, logs, network, and user experience.
- Built-in synthetic monitoring and session replay.
- Centralized configuration for large-scale cloud environments.
Pros
- Automated instrumentation and topology discovery.
- Enterprise-grade analytics and intelligent RCA.
- Deep infrastructure and network observability.
- Highly scalable for multi-environment Laravel deployments.
Cons
- Premium pricing with limited flexibility for small teams.
- Steeper learning curve for configuration and dashboarding.
Pricing
- Infrastructure Monitoring: $29/mo/host
- Full-Stack Monitoring: $58/mo/8 GiB host
Dynatrace Laravel Monitoring Pricing at Scale
A midsized SaaS company operating 125 APM hosts, 200 infra hosts, 10TB(~10,000 GB) of ingested logs, 300,000 custom metrics, 1,500,000 container hours, and 45,000GB of observability data out(charged by cloud provider), the cost would come around ~$21,850/month.
Tech Fit
Dynatrace is ideal for enterprise-grade Laravel environments running across complex multi-cloud or hybrid architectures. It suits organizations that prioritize automation, intelligent anomaly detection, and unified visibility from infrastructure to end-user sessions. For DevOps teams managing large Laravel workloads and requiring proactive diagnostics with minimal manual setup, Dynatrace offers unmatched automation and AI depth — though with the highest total cost of ownership among major APM tools.
7. Sentry
Known For
Sentry is a popular open-source platform for error tracking, performance monitoring, and application diagnostics. Initially focused on exception management, Sentry has evolved into a lightweight APM solution with tracing and profiling capabilities for modern frameworks. Its PHP SDK offers full compatibility with Laravel, making it one of the easiest tools to integrate for real-time error visibility and performance insights.
Laravel Monitoring Features
- Automatic error and exception tracking with stack traces and context.
- Performance tracing for Laravel controllers, middleware, and database queries.
- Eloquent query span visibility to detect N+1 issues.
- Transaction tracing across routes, jobs, and external services.
- Laravel-specific integration through the official Sentry SDK and service provider.
Key Features
- Unified error, trace, and performance dashboards.
- Release health tracking and issue grouping.
- Real-time alerting via Slack, PagerDuty, and email.
- Code-level profiling for slow transactions and bottlenecks.
- OpenTelemetry-compatible ingestion for advanced pipelines.
Pros
- Excellent Laravel and PHP SDK integration.
- Strong developer experience with minimal setup.
- Clear visual separation of issues, traces, and transactions.
- Flexible cloud or self-hosted deployment options.
Cons
- High costs due to per-user and data retention pricing.
- Complex initial setup
- Overwhelming UI, especially for beginners
Pricing
- Developer Plan: Free — includes 1 user, error monitoring, tracing
- Team Plan: $29/month — adds unlimited users, third-party integrations
- Business Plan: $89/month — includes unlimited dashboards, 90-day insights
- Enterprise Plan: Custom pricing — tailored for high-volume.
Sentry Laravel Monitoring Pricing at Scale
For a mid-sized SaaS company ingesting 10,000 TB (~10,000GB) of logs, 500,000,000 indexed spans, and 45,000GB of observability data (charged by the cloud provider), the cost would come around $12,100/month.
Tech Fit
Sentry is best suited for Laravel development teams that want deep error monitoring and lightweight performance tracing without managing full observability stacks. It’s ideal for small to mid-sized SaaS applications, APIs, and product teams that need immediate visibility into exceptions and bottlenecks. For Laravel developers seeking an intuitive, developer-first APM solution, Sentry delivers fast insights, real-time alerting, and flexible deployment — making it a cost-effective and agile choice for most PHP projects.
8. Inspector.dev
Known For
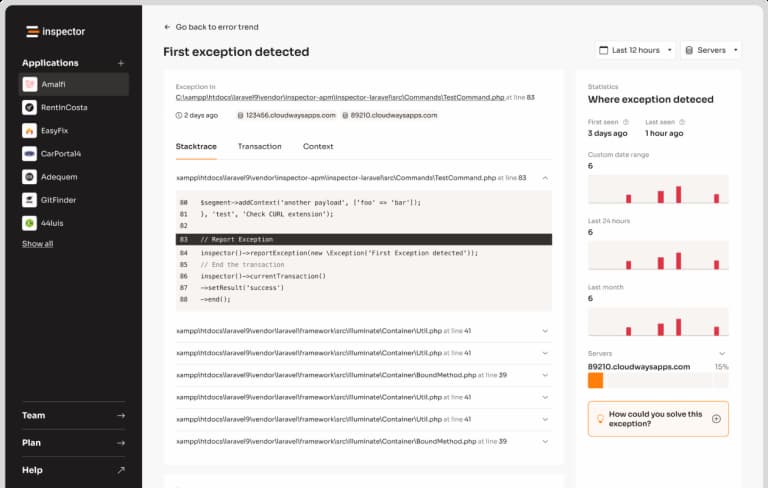
Inspector is a lightweight, Laravel-focused APM that automatically instruments your application to surface code execution metrics across HTTP routes, Artisan commands, and job queues. It’s built to integrate smoothly into Laravel apps with minimal setup.
Laravel Monitoring Features
- Tracing of HTTP requests, controllers, and middleware.
- Measurement of database query durations through Eloquent and raw SQL.
- Monitoring of background jobs and Artisan command performance.
- Exception and error capture tied to spans.
- Custom instrumentation support for any code block.
Key Features
- Laravel-first, minimal-overhead instrumentation.
- Support for tracing across jobs and Artisan commands.
- OpenTelemetry-compatible ingestion.
- Simple API for custom instrumentation.
- Dashboarding focused on Laravel performance metrics.
Pros
- Very easy to integrate into Laravel projects.
- Focused on framework-level visibility (controllers, jobs).
- Low overhead with lean architecture.
- Good fit for Laravel teams who want essential observability without overcomplexity.
Cons
- Expensive as data volumes grow
- Complex initial setup
Pricing
- Free Plan: €0/month — includes 30K transactions
- Beginner Plan: €15/month — includes 300K transactions.
- Developer Plan: €39/month — includes 800K transactions.
- Team Plan: €69/month — includes 1.5M transactions.
Inspector Laravel Monitoring Pricing at Scale
Inspector’s pricing is transaction-based, making it simple for Laravel teams to scale based on application throughput. For a mid-sized company processing 100 million transactions per month across APIs, controllers, and queues, the cost would scale linearly from the Team Plan (€69 for 1.5M transactions) to roughly €4,600/month (100M ÷ 1.5M × €69). Even at this scale, Inspector remains one of the more affordable Laravel-native tools compared to enterprise APMs, though large volumes may require direct enterprise pricing for better optimization and quota management.
Tech Fit
Inspector is well-suited for Laravel teams that want focused framework observability without the complexity of full observability suites. It’s ideal for startups and mid-size applications that want to monitor controllers, database interactions, and job performance with minimal overhead.
Conclusion
Monitoring Laravel applications goes far beyond simple uptime checks — it’s about maintaining performance visibility across controllers, database queries, queues, and external services. The right Laravel monitoring tool should not only detect slow code paths and hidden N+1 queries but also provide actionable insight into how application behavior affects users and business performance.
From established enterprise platforms like Datadog, New Relic, and Dynatrace to developer-friendly tools like Sentry, Stackify Retrace, and Inspector, every solution offers a different trade-off between cost, depth, and ease of use. Enterprise APMs excel in automation and scale but can be costly, while lightweight Laravel-native options offer faster setup with lower overhead but limited infrastructure visibility.
CubeAPM bridges these worlds by delivering Laravel-specific observability with OpenTelemetry-native tracing, queue visibility, and unified MELT coverage — without complex licensing or hidden usage tiers. For teams seeking a modern, predictable, and Laravel-aware observability platform, CubeAPM makes it easy to trace every request, monitor every job, and optimize performance confidently at any scale.
Disclaimer: The information in this article reflects the latest details available at the time of publication and may change as technologies and products evolve.
FAQs
1. What is Laravel monitoring and why is it important?
Laravel monitoring involves tracking the performance, errors, and resource usage of your Laravel applications in real time. It helps developers detect slow queries, job failures, and memory bottlenecks before they affect end users. Continuous monitoring ensures smoother deployments, better user experience, and faster debugging when issues occur.
2. Which metrics should I monitor in a Laravel application?
Key metrics include response time, error rate, database query latency, queue processing time, and cache hit ratio. Monitoring PHP runtime metrics like CPU, memory, and worker utilization is also critical for detecting early performance regressions in Laravel workloads.
3. How do I monitor Laravel performance in production?
You can monitor Laravel performance by integrating an APM or observability platform that supports PHP tracing. Tools like CubeAPM automatically capture HTTP request traces, database query timings, and Horizon queue performance. These insights help you pinpoint exactly where requests slow down — in your controllers, models, or external services.
4. Can I use OpenTelemetry for Laravel monitoring?
Yes. OpenTelemetry (OTEL) provides a vendor-neutral way to instrument Laravel applications. Using OTEL-compatible agents, you can export metrics, traces, and logs to any observability backend, including CubeAPM. This ensures flexibility and avoids vendor lock-in while maintaining full-stack visibility across services.
5. How can I reduce the cost of Laravel monitoring?
To keep monitoring affordable, use sampling, filtering, and shorter retention periods for non-critical data. Choose tools that offer usage-based or flat-rate ingestion pricing instead of host-based licenses. CubeAPM, for example, optimizes telemetry through Smart Sampling and compression to retain high-value traces while controlling ingestion volume and cost.


