The main difference between Azure Monitor, Grafana, and CubeAPM is about architecture, data control, cost scaling, and how quickly teams can explain production incidents.
Azure Monitor is a fully managed monitoring service tightly integrated with Microsoft Azure. Grafana is a flexible observability and visualization layer built around open-source components like Prometheus and Loki. CubeAPM is a self-hosted, OpenTelemetry-native full-stack observability platform designed for predictable ingestion-based pricing, unlimited retention, and data residency control.
In this guide, we compare Azure Monitor vs Grafana vs CubeAPM across deployment models, multi-agent support, pricing structures, sampling strategies, data retention, and support experiences.
Azure Monitor vs Grafana vs CubeAPM Comparison
The comparison below reflects information available in official vendor documentation and common production deployment patterns. Actual costs, sampling behavior, retention settings, and support response times can differ based on region, workload scale, configuration choices, and the specific plan or support tier selected.
| Feature | CubeAPM | Azure Monitor | Grafana |
| Known for | Unified MELT, native OTEL, self-hosting, cost predictability | Native Azure monitoring & diagnostics | Open-source dashboards, composable observability stack |
| Multi-Agent Support | Yes (OTel, New Relic, Datadog, Elastic, etc.) | Limited (Azure Monitor Agent, OTel) | Yes (OTel, Prometheus exporters, Loki, Tempo) |
| MELT Support | Full MELT coverage | Full MELT coverage | Full MELT coverage |
| Deployment | Self-hosted with vendor-managed | SaaS (Fully managed) | SaaS, self-hosted, & self-managed |
| Pricing | Ingestion-based: $0.15/GB | Logs: $0.50/GBMetrics: $0.16/10 million samples ingested | OSS: Free; Cloud: $19/month; Enterprise: $25,000/yr |
| Sampling Strategy | Smart sampling, automated, context-aware | Fixed-percentage, rate-limited sampling | Head-based & tail-based |
| Data Retention | Unlimited Retention | Basic Logs: 30dCustom Metrics: 90d | Free: 14d; Pro: 30d for logs/traces, 13m for metrics |
| Support Channel & TAT | Slack, WhatsApp; response in minutes | Email, chat, phone; TAT: 8 hr to 15 min (plan-based) | Free: Community; Pro: 8×5 email; Enterprise: 24×7, custom SLAs |
Azure Monitor vs Grafana vs CubeAPM: Feature Breakdown
Known for
CubeAPM is positioned as a unified full-stack observability platform with native OpenTelemetry support across metrics, logs, events, and traces. It emphasises ingestion-based pricing, self-hosted deployment options, and compatibility with multiple telemetry formats. CubeAPM focuses on simplifying correlation across MELT signals while allowing teams to keep data within their own cloud environment.
Grafana is best known as an open source visualization and observability platform that connects to multiple data sources rather than acting as a single monolithic backend. Its documentation highlights support for dashboards, alerting, and integration with Prometheus, Loki, Tempo, and OpenTelemetry pipelines. Grafana’s strength lies in composability, allowing teams to build custom observability stacks around different storage backends.
Azure Monitor is Microsoft’s native monitoring and diagnostics service for Azure workloads. It provides integrated metrics, logs, and tracing through services such as Log Analytics and Application Insights, with deep visibility into Azure resources including virtual machines, App Services, and AKS clusters. Microsoft’s documentation positions Azure Monitor as the central observability layer for Azure environments.
Multi-Agent Support
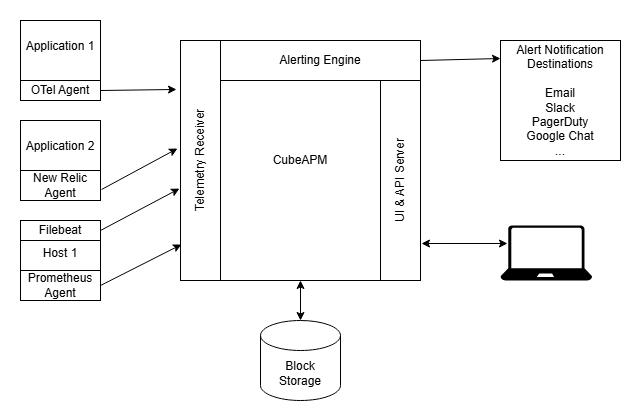
CubeAPM supports a wide range of telemetry sources and agent formats. It is built with OpenTelemetry at its core, and can ingest data from OpenTelemetry libraries, Prometheus metrics, and compatibility layers for other agent formats. According to its official documentation, CubeAPM’s approach allows teams to use existing instrumentation and collect telemetry from diverse services without needing custom adapters for each agent type.
Grafana itself does not run agents but provides a flexible data source layer that connects to multiple observability backends and agent outputs. The official Grafana documentation shows that it can visualize data from OpenTelemetry pipelines, Prometheus exporters, Loki for logs, and Tempo for traces. This composable architecture means you can use a variety of agents and exporters to feed data into Grafana dashboards and unified views.
Azure Monitor primarily collects telemetry through the Azure Monitor Agent and the OpenTelemetry exporters configured to send data into Azure services like Log Analytics and Application Insights. Customers can use the Azure Monitor Agent for infrastructure telemetry and OpenTelemetry SDKs for application traces and metrics.
MELT Support
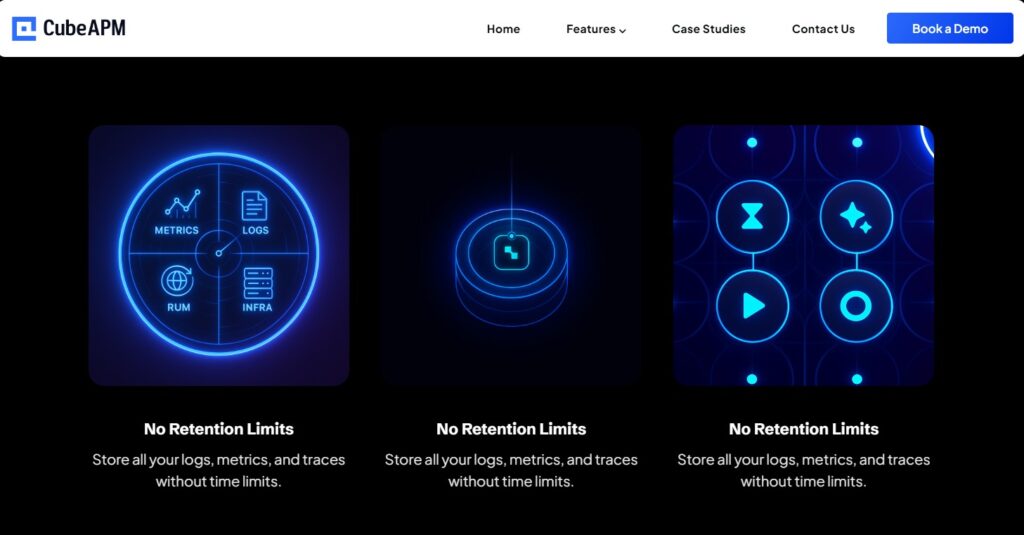
CubeAPM provides full coverage across metrics, logs, events, and traces in a unified platform. Its official documentation highlights that it ingests OpenTelemetry telemetry across all four signal types and correlates them in one observability backend. This means teams can navigate from a metric anomaly to logs and traces without switching tools, with all telemetry stored and searchable in a single system.
Grafana supports full MELT visibility through integrations with specialized backends and data sources. While Grafana itself does not store all telemetry types natively, its official documentation shows that it can visualize metrics from Prometheus, logs from Loki, and traces from Tempo or other OpenTelemetry pipelines. This modular architecture lets teams build a MELT observability stack by connecting these components, and Grafana unifies the display and exploration layer.
Azure Monitor supports all four observability signal types within the Microsoft ecosystem. Metrics are collected and stored in the Azure Monitor metrics store, logs are ingested into Log Analytics workspaces, events are available via activity logs and diagnostic settings, and distributed tracing data can be collected via Application Insights and OpenTelemetry exporters targeting Azure Monitor. While these components are separate services within the Azure ecosystem, Microsoft’s documentation shows that they work together to provide full MELT capabilities for Azure workloads.
Deployment
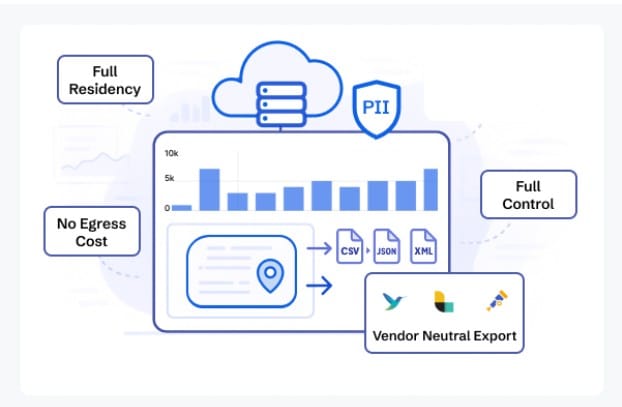
CubeAPM supports self-hosted deployment, with vendor-managed assistance available. Its official materials describe that CubeAPM runs inside the customer’s own cloud environment, meaning telemetry data is stored within the customer’s infrastructure rather than in a vendor-controlled SaaS environment. This approach allows organizations to control data residency, networking, and scaling policies while still receiving platform-level support.
Grafana supports multiple deployment models. Grafana Open Source can be self-hosted and self-managed on the infrastructure of your choice. Grafana Cloud provides a fully managed SaaS option operated by Grafana Labs. Grafana Enterprise adds enterprise features and support, and can also be deployed self-managed. According to official documentation, this flexibility allows teams to choose between operational control and managed convenience.
Azure Monitor is delivered as a fully managed SaaS service within Microsoft Azure. Customers provision resources such as Log Analytics workspaces and Application Insights instances, but the backend infrastructure, storage systems, and scaling are operated by Microsoft. There is no self-hosted version of Azure Monitor. Telemetry from on-premises or multi-cloud environments can be sent to Azure Monitor, but the observability backend remains Microsoft-managed.
Pricing for Small, Mid, and Large Teams
*All pricing comparisons are calculated using standardized Small/Medium/Large team profiles defined in our internal benchmarking sheet, based on fixed log, metrics, trace, and retention assumptions. Actual pricing may vary by usage, region, and plan structure. Please confirm current pricing with each vendor.
| Approx. cost for teams (size) | Small (~30) | Mid-Sized (~125) | Large (~250) |
| CubeAPM | $2,080 | $7,200 | $15,200 |
| Azure Monitor | $2,064 | $5,232 | $13,228 |
| Grafana | $2,290 | $8,625 | $17,750 |
CubeAPM Costs in Detail
CubeAPM uses an ingestion-based pricing model with transparent per-GB rates and no license fees per user or host. Based on CubeAPM’s official pricing documentation:
- Data ingestion: $0.15 per GB
CubeAPM’s pricing focuses on predictable costs tied directly to telemetry volume rather than node count or user seats.
- Small teams (~ 30): $2,080
- Mid-sized teams (~ 125): $7,200
- Large teams (~250): $15,200
Azure Monitor Cost in Detail
Azure Monitor pricing for logs and metrics is based on usage and ingestion volume, with official numbers published on Microsoft’s pricing page for 2026. The key components are:
- Basic Logs: $0.50 per GB ingested
- Metrics ingestion: $0.16 per 10 million samples ingested (published rate on Azure Monitor pricing page)
Here’s how pricing looks for different teams:
- Small teams: $2,064
- Mid-size teams: $5,232
- Large teams: $13,228
Grafana Cost in Detail
Grafana’s pricing varies based on edition and hosting model. According to Grafana Labs’ pricing page:
- Grafana Open Source: Free
- Grafana Cloud: Starting at $19 per month
- Grafana Enterprise: Starting at $25,000 per year
These published tiers reflect what customers pay for managed dashboards and enterprise support. Usage-based charges are as follows:
- Metrics: $6.50 per 1,000 metric series
- Logs and traces: $0.50 per GB
Here’s how pricing looks for different team sizes:
- Small teams: $2,290
- Mid-size teams: $8,625
- Large teams: $17,750
Teams usually start noticing cost differences as telemetry volume grows, especially with sustained traffic, high-cardinality logs, and multiple microservices. At that stage, observability shifts from a small tooling expense to a variable cost that requires active monitoring and forecasting.
Sampling Strategy
This section explains how each platform supports telemetry sampling, specifically, how traces and other high-volume data are sampled or controlled, based on official vendor documentation.
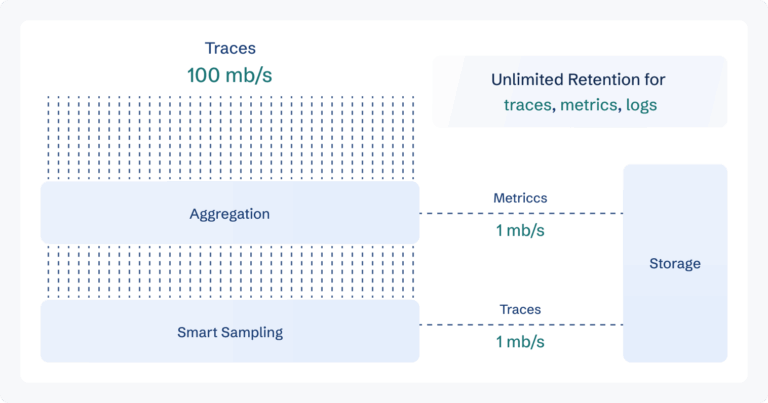
CubeAPM uses smart, context-aware sampling as a built-in part of its observability pipeline. According to CubeAPM’s official materials, sampling decisions are made automatically based on trace context such as latency, errors, or unusual patterns, so that high-value traces are retained at higher rates while lower-value data is reduced. This automated approach helps control ingestion costs without losing important diagnostic visibility.
Grafana supports sampling strategies through integrations with observability backends and data collection pipelines. For example, when using Grafana with OpenTelemetry Collector, Tempo, or other trace collectors, users can configure head-based sampling (at the start of a trace) or tail-based sampling (after inspecting trace content) within the collector’s processors. Grafana itself does not enforce sampling policies but exposes and visualizes data passed from the configured pipeline. The official Grafana Cloud documentation includes configuration options for sampling when sending traces to hosted Grafana services.
Azure Monitor supports sampling primarily at the instrumentation layer via the Application Insights SDK or OpenTelemetry SDKs targeting Azure Monitor. According to Microsoft’s documentation, you can configure fixed-percentage sampling to reduce telemetry volume by collecting only a defined fraction of traces, and adaptive sampling in some SDKs adjusts sampling based on traffic rates to help control ingestion without manual tuning.
Tail-based sampling, where traces are evaluated before being accepted or dropped, can be configured using an OpenTelemetry Collector in front of Azure Monitor, but this is not a native feature of the Azure Monitor backend itself, sampling controls are applied before data is sent to Azure’s ingestion endpoints.
Data Retention
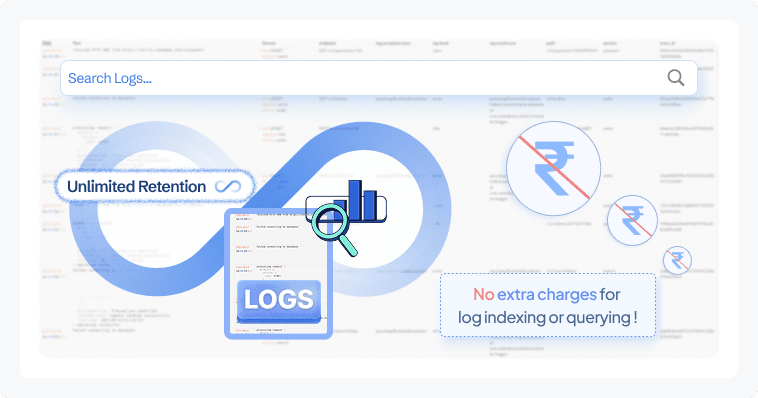
CubeAPM supports unlimited retention of telemetry data (metrics, logs, traces) in its platform without extra retention-tier charges. According to CubeAPM’s official documentation, teams can retain data for as long as needed because the pricing model does not tie retention limits to costs, and users control the backend storage where CubeAPM runs. This makes it suitable for compliance requirements or historical analysis where long-term data access is essential.
Grafana’s data retention depends on the storage backend and configuration chosen by the user or cloud plan:
- For self-hosted Grafana with data sources like Loki or Prometheus, retention is configured at the backend level (for example, compaction and retention policies in Loki or Prometheus TSDB settings).
- The default retention limits in hosted Grafana Cloud plans also depend on plan tiers; for example, logs and traces retention durations (such as 14 days for free tiers, 30 days for paid tiers) are published by Grafana Labs in their plan details.
- Official Grafana documentation explains that data retention for each data source must be configured separately because Grafana itself is a visualization layer connected to other storage systems.
Azure Monitor’s data retention model is defined per telemetry type and officially published on Microsoft’s pricing and service pages:
- Basic Logs: up to 30 days retention included at no extra cost
- Analytics Logs: up to 31 days retention included at no extra cost
- Custom Metrics: up to 90 days retention included at no extra cost
- Extended Retention: Data retained beyond included retention periods is charged on a per-GB per-month basis (pro-rated by day).
Azure Monitor retains logs and metrics in its managed backend (Log Analytics workspaces and metrics store), and retention configuration beyond the included period is set per workspace with associated charges.
Support Channel and Response Times
CubeAPM provides support through direct channels with relatively fast response expectations. According to CubeAPM’s official material, support includes access via community and private channels such as Slack and WhatsApp, and the core engineering team engages directly with customers for troubleshooting and assistance. Response times are often noted to be in the minutes range, particularly for critical issues, because direct communication with the engineering team is part of the support experience.
Grafana’s support offerings vary by the edition and plan selected. Grafana provides:
- Community support for the open source edition via forums and documentation
- Grafana Cloud support that includes email and ticketing channels with defined service levels
- Enterprise support with additional SLAs and 24×7 options for Critical issues
Official Grafana documentation and support pages outline that paid plans offer structured incident handling and prioritized response, while community support for open source is self-service driven. Response times may vary based on plan and severity.
Azure Monitor support is provided through Microsoft Support Plans rather than as part of the product itself. Official Microsoft support documentation explains that response channels and target response times depend on the support tier you purchase:
- Basic (included): access to documentation and community forums, no guaranteed SLAs
- Developer Support: email ticket support with business-hours response commitment
- Standard Support: 24×7 support with response targets (for example, <1 hour for critical severity) depending on plan details
- Professional Direct / Premier / Unified Support: higher dedicated support tiers with tighter SLA targets, including 15-minute to 1-hour response windows for critical issues
These official support tiers and response time commitments are part of Microsoft’s documented support options for Azure services, including Azure Monitor.
How Teams Evaluate These Platforms at Scale
Modern observability decisions rarely happen in isolation. Once telemetry volume, compliance requirements, and infrastructure complexity increase, platform selection becomes a cross-functional evaluation rather than just a tooling choice.
Who Is Involved
- Engineering typically leads the technical evaluation. They assess instrumentation effort, OpenTelemetry compatibility, correlation across metrics, logs, and traces, and how the platform impacts mean time to resolution.
- Finance becomes involved when telemetry volume grows. Ingestion-based billing, retention policies, and sampling configuration directly influence monthly cloud spend. Teams often model log volume and trace throughput before committing to a platform.
- Security and compliance teams review deployment models and data residency. For regulated environments, questions around where telemetry is stored, how long it is retained, and whether it leaves a specific region can determine whether SaaS-only solutions are acceptable.
At scale, observability is not just an engineering tool. It becomes an infrastructure governance decision.
What Questions Block Decisions
Common blockers usually surface around architecture and cost:
- Will ingestion costs spike during traffic growth?
- How much operational overhead does a self-hosted stack introduce?
- Can sampling preserve critical traces during incidents?
- What happens to data retention costs after 30 or 90 days?
- Does OpenTelemetry support native or layered through adapters?
These questions often matter more than dashboard aesthetics or feature checklists.
Why Comparisons Alone Aren’t Enough
Side-by-side tables are useful, but they rarely capture how platforms behave under real production pressure. The real test happens when:
- Trace volume spikes during an outage
- Log cardinality explodes due to a deployment issue
- Retention requirements increase due to audit requests
- Multiple teams begin querying data simultaneously
At that stage, cost structure, sampling design, and deployment architecture matter more than surface-level features.
For most teams, the decision ultimately balances three variables: control, complexity, and cost predictability. The right platform depends on which of those matters most in your environment.
Azure Monitor vs Grafana vs CubeAPM: Use Cases
Different platforms fit different architectural, compliance, and cost realities. Below are practical scenarios where each tool typically makes the most sense in production environments.
Choose CubeAPM if:
CubeAPM fits teams that want unified full-stack observability with predictable ingestion pricing and deployment control. Based on CubeAPM’s official documentation and demo data, it is positioned for organizations that want OpenTelemetry native instrumentation without per-user licensing complexity.
- You are a startup or scaleup that needs full-stack observability without per-user license fees. Based on CubeAPM’s published pricing, ingestion is $0.15 per GB, which helps model cost growth more directly as traffic scales.
- You want a self-hosted, OpenTelemetry-based alternative where telemetry data stays inside your cloud for compliance or data residency requirements.
- You operate in regulated environments where logs and traces cannot leave your region or VPC, and long retention periods are required without tiered storage pricing.
- You want predictable pricing and unlimited data retention instead of paying extra for extended retention windows.
- You are running distributed microservices and want end-to-end tracing across services with automated sampling designed to preserve high latency and error traces.
- You need to reduce MTTR by correlating metrics, logs, and traces in a single backend without stitching multiple tools together.
- You are migrating from Datadog or New Relic and want compatibility with OpenTelemetry and existing instrumentation formats without fully re-instrumenting applications.
- You run high-throughput Java services and need deep JVM observability such as garbage collection visibility, thread pool behavior, and dependency tracing across Spring Boot or Jakarta applications. For Java heavy backends, unified trace and log correlation often simplifies debugging memory leaks and latency regressions.
- You prefer direct support access through engineering channels rather than ticket-only enterprise workflows.
Choose Azure Monitor if:
Azure Monitor works best when your infrastructure is primarily Azure native, and you want fully managed SaaS observability tightly integrated with Microsoft services.
- Your workloads run mainly on Azure services such as Azure VMs, AKS, App Services, Azure SQL, or Functions, and you want native integration without additional connectors.
- You want a fully managed SaaS observability service operated by Microsoft, with no responsibility for maintaining the backend infrastructure.
- You rely heavily on Azure platform metrics, activity logs, and resource diagnostics that integrate directly into Log Analytics and Application Insights.
- Your organization already uses Microsoft support plans and prefers centralized enterprise vendor support.
- You are comfortable with ingestion-based pricing where log ingestion for Basic Logs is published at $0.50 per GB and metrics are priced at $0.16 per 10 million samples, based on Microsoft’s official pricing page.
- You want Azure RBAC integration and policy enforcement across observability resources inside your Azure subscription.
- You prefer a single cloud provider ecosystem where monitoring, identity, networking, and compute are tightly integrated.
Choose Grafana if:
Grafana is ideal for teams that value composability and open source flexibility and are comfortable operating multiple observability components.
- You already use Prometheus for metrics and want a powerful dashboarding layer without changing your backend architecture.
- You prefer building your own observability stack using Loki for logs, Tempo for traces, and OpenTelemetry collectors.
- You want to start with open source tooling and gradually scale into managed Grafana Cloud plans as operational complexity increases.
- You operate in multi-cloud or hybrid environments and need vendor-neutral dashboards that connect to many different data sources.
- You want flexible retention policies controlled by your storage backend rather than fixed SaaS retention tiers.
- Your engineering team is comfortable managing observability infrastructure components and tuning head-based or tail-based sampling pipelines.
- You want strong visualization capabilities and custom dashboards across different telemetry backends.
In practice, the right choice depends on your balance between control, operational complexity, ecosystem integration, and long-term cost predictability.
Conclusion
Azure Monitor, Grafana, and CubeAPM approach observability from different architectural philosophies. Azure Monitor is tightly integrated into the Microsoft ecosystem and works well for Azure native environments. Grafana offers flexibility and composability, allowing teams to build customized observability stacks around open source components.
CubeAPM combines unified MELT coverage, OpenTelemetry native support, self-hosted deployment, predictable ingestion-based pricing, and unlimited retention. For teams prioritizing data control, cost visibility, and reduced MTTR, it presents a strong alternative.
Evaluate your scale, compliance needs, and cost model carefully. If you are exploring modern observability options, book a CubeAPM demo to see how it fits your environment.
Disclaimer: The information in this article reflects the latest details available at the time of publication and may change as technologies and products evolve.
FAQs
1. Can Azure Monitor, Grafana, and CubeAPM monitor Kubernetes clusters?
Yes, all three can monitor Kubernetes environments, but the approach differs. Azure Monitor integrates natively with AKS through Azure Monitor for Containers. Grafana typically relies on Prometheus, Loki, and other collectors deployed in the cluster. CubeAPM supports Kubernetes through OpenTelemetry and infrastructure monitoring agents, enabling trace, log, and metric correlation across microservices.
2. Which platform is better for multi-cloud environments?
Grafana and CubeAPM are generally better suited for multi-cloud setups. Grafana connects to multiple data sources across AWS, Azure, and on-prem systems. CubeAPM supports OpenTelemetry and self-hosted deployment inside your own cloud, making it adaptable across cloud providers. Azure Monitor is optimized primarily for Azure workloads, though it can ingest external telemetry.
3. Do these platforms support real user monitoring (RUM)?
Azure Monitor supports browser monitoring through Application Insights. Grafana offers RUM through Grafana Faro and related integrations in Grafana Cloud. CubeAPM includes real user monitoring as part of its full-stack observability suite, correlating frontend signals with backend traces.
4. How do these tools handle compliance and data residency requirements?
Azure Monitor stores telemetry within selected Azure regions and follows Microsoft’s compliance framework. Grafana Cloud stores data in selected regions depending on plan, while self-hosted Grafana allows full control over storage location. CubeAPM runs within the customer’s own cloud when self-hosted, which supports strict data residency and compliance requirements.
5. Which platform is easier to migrate to from another APM tool?
Migration complexity depends on your current instrumentation. Grafana often requires building or integrating a new telemetry pipeline. Azure Monitor typically involves configuring the Azure Monitor Agent or Application Insights SDKs. CubeAPM supports OpenTelemetry and compatibility with common agent formats, which can simplify migration without full re-instrumentation in many environments.


