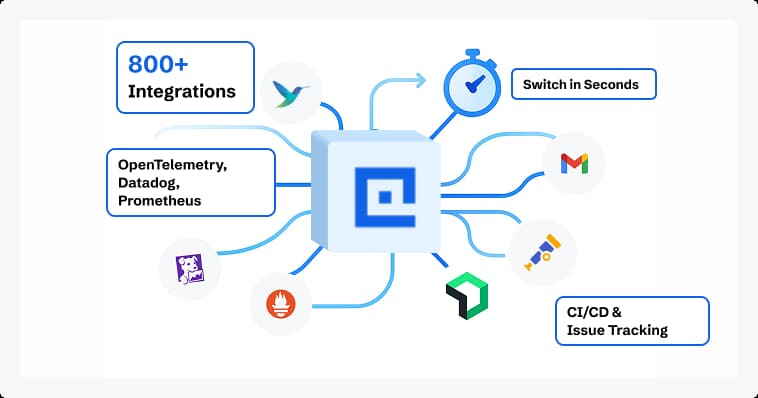
The main difference between Azure Monitor, Datadog, and CubeAPM is the operating model they enforce: Azure Monitor is a cloud-native monitoring stack designed around Azure resource context; Datadog is a centralized SaaS observability platform across diverse stacks, and CubeAPM is a unified OpenTelemetry-native observability platform built for predictable ingestion-based cost across cloud, hybrid, and on-prem systems.
Azure Monitor is typically used by teams running applications and infrastructure primarily on Microsoft Azure. It collects metrics, logs, and traces through Azure-native services and agents, with pricing driven by data ingestion and retention. Datadog and CubeAPM are commonly evaluated by teams that want a single observability layer across multiple services or environments, using agent-based or OpenTelemetry-based collection models.
In this article, we compare Azure Monitor vs Datadog vs CubeAPM across feature coverage, sampling behavior, data retention, support models, and how costs change for small, mid-sized, and large production teams.
Azure Monitor vs Datadog vs CubeAPM: Feature Comparison
The comparison below is based on publicly available documentation, standard production usage patterns, and commonly adopted configurations for each platform. Feature behavior, pricing, retention, and sampling characteristics can vary depending on workload size, region, data volume, and configuration choices. The table is intended to highlight architectural and operational differences rather than prescribe a preferred tool.
| Features | CubeAPM | Azure Monitor | Datadog |
| Known for | OpenTelemetry-native observability with predictable costs | Native Azure monitoring and diagnostics | Centralized SaaS observability across infrastructure and applications |
| Multi-Agent Support | Yes (OTel, New Relic, Datadog, Elastic) | Limited to Azure ecosystem (Azure Monitor Agent, Application Insights SDKs, OTEL exporters) | Limited (OTel, Prometheus) |
| MELT Support | Full MELT | Full MELT | Full MELT |
| Setup | Self-hosted but vendor-managed | SaaS (Fully managed Azure service) | SaaS only |
| Pricing | Ingestion-based pricing of $0.15/GB | Basic Logs: $0.50/GB Metrics: $0.16/10 million samples ingested | APM Pro: $35/host/month Infra Pro: $15/host/month |
| Sampling Strategy | Smart sampling (95% compression) | Fixed-percentage Rate-limited sampling | Head + Tail-based |
| Log Retention | Unlimited Retention | Basic Logs: 30 days Custom Metrics: 90 days | APM Errors: 15 days |
| Support TAT | < 10 minutes | ProDirect: < 1 hour Standard: < 1 hour | 30 mins to 2 days |
Azure Monitor vs Datadog vs CubeAPM: Feature-by-feature breakdown
Known for

CubeAPM: Known for unified observability built around OpenTelemetry. It is used to ingest and analyze traces, metrics, and logs from distributed systems using standardized instrumentation and collectors. CubeAPM is typically adopted in environments where teams want a cloud-agnostic observability layer or are standardizing on OpenTelemetry across services.

Azure Monitor: Known as the native monitoring and diagnostics platform for Microsoft Azure. It collects metrics, logs, and traces from Azure services and applications through Azure-managed ingestion pipelines and workspaces. Azure Monitor is commonly used to observe infrastructure health and application behavior within Azure environments, with workflows integrated into the Azure Portal and Azure management tooling.

Datadog: Known for providing a centralized, SaaS-based observability platform that unifies metrics, logs, and traces across infrastructure and applications. It is widely used in environments with diverse technologies and services, emphasizing cross-signal correlation, dashboards, and a large ecosystem of built-in integrations within a single hosted platform.
Multi-agent support
CubeAPM: Integrates natively with OpenTelemetry collectors and can receive telemetry from Prometheus as well as from commonly used vendor agents, including Datadog, New Relic, and Elastic. This allows metrics, logs, and traces from different collection paths to be ingested into a single backend, enabling teams to consolidate observability data without re-instrumenting existing services during migration.
Azure Monitor: Relies on Azure-native agents and SDKs for telemetry collection, including the Azure Monitor Agent and Application Insights SDKs. OpenTelemetry exporters are supported for sending data into Azure Monitor, particularly for application tracing and metrics. Telemetry collection is designed to integrate closely with Azure services and managed resources, and agent support is primarily optimized for workloads running within Azure.
Datadog: Uses its own agents and language-specific libraries to collect telemetry across infrastructure and applications. It also supports OpenTelemetry ingestion alongside native agents. This allows teams to combine Datadog-specific instrumentation with OpenTelemetry-based data sources, depending on workload requirements. Agent deployment and configuration are typically managed centrally across environments.
MELT support (Metrics, Events, Logs, Traces)
CubeAPM: Offers full MELT support through OpenTelemetry-based ingestion. Metrics, events, logs, and traces are handled within the same observability backend, allowing teams to analyze system behavior and request-level execution together. Events are treated as part of the telemetry stream and can be reviewed alongside traces and metrics during investigations.
Azure Monitor: Offers MELT support across Azure Metrics, Log Analytics, Application Insights, and Azure Activity Logs. Metrics, logs, and traces are accessed through Azure Monitor workspaces, while events are surfaced through platform and service-level activity records. Signal correlation is primarily driven by timestamps and Azure resource context.
Datadog: Offers full MELT support within its SaaS observability platform. Metrics, logs, traces, and events are available through integrated products such as infrastructure monitoring, APM, and log management. Events generated from monitors, deployments, and infrastructure changes can be viewed alongside telemetry data, with support for OpenTelemetry ingestion in addition to Datadog-native formats.
Deployment options

CubeAPM: Supports self-hosted and BYOC-style deployments, where the observability backend runs in infrastructure controlled by the customer. Platform operations such as upgrades and maintenance are vendor-managed, while telemetry processing and storage remain within the team’s environment. This deployment model is typically used when teams want portability across environments or need greater control over where observability data resides.
Azure Monitor: Delivered as a fully managed service within Microsoft Azure. Telemetry ingestion, storage, and querying are handled by Azure-managed services such as Azure Metrics, Log Analytics, and Application Insights. Deployment and configuration are performed through Azure-native tooling, and the platform is designed to operate only within Azure environments.
Datadog: Offered as a fully managed SaaS platform. Telemetry is collected using Datadog agents or supported integrations and sent to Datadog-managed infrastructure for processing and storage. Customers do not manage the backend infrastructure, and deployment primarily involves agent installation and configuration across monitored systems.
Pricing: Approximate Cost for Small, Mid-Sized & Large Teams
*All pricing comparisons are calculated using standardized Small/Medium/Large team profiles defined in our internal benchmarking sheet, based on fixed log, metrics, trace, and retention assumptions. Actual pricing may vary by usage, region, and plan structure. Please confirm current pricing with each vendor.
*An APM host is a host that is actively generating trace data, and an Infra host is any physical or virtual OS instance that you monitor with any observability tool.
Below is a cost comparison for small, mid-sized, and large teams.
| Approx. Cost for Teams | Small (~30 APM Hosts) | Mid-sized (~125 APM Hosts) | Large (~250 APM Hosts) |
| CubeAPM | $2,080 | $7,200 | $15,200 |
| Azure Monitor | $2,063.84 | $5,231.36 | $13,227.2 |
| Datadog | $8,185 | $27,475 | $59,050 |
What This Comparison Means at Scale
At small team sizes, differences between CubeAPM, Azure Monitor, and Datadog are usually subtle. Telemetry volume is low, architectures are simpler, and observability is often limited to basic metrics, logs, and alerts. Setup convenience and native integrations tend to outweigh concerns about cost behavior or sampling.
As systems reach sustained production use, telemetry volume increases due to higher traffic, more services, and broader tracing and logging coverage. At this stage, ingestion models, sampling strategies, and retention policies begin to affect both investigation workflows and monthly observability spend. Cost sensitivity shifts from host count to how much data is generated and retained.
At a larger scale, long-term behavior becomes the deciding factor. High-cardinality telemetry, frequent incident investigations, and extended retention requirements magnify differences in how platforms manage data volume and correlation. Teams typically focus on cost predictability, operational overhead, and how reliably signals can be connected during complex failures.
CubeAPM: Cost for Small, Medium, and Large Teams
CubeAPM uses an ingestion-based pricing approach where observability spend increases with the amount of telemetry processed. Costs are tied to data volume rather than user count, enabled features, or infrastructure units.
Pricing overview:
- Telemetry ingestion priced at $0.15 per GB
Using consistent workload assumptions across environments, estimated monthly costs typically fall into these ranges:
- Small teams (~30 APM hosts): $2,080
- Mid-sized teams (~125 APM hosts): $7,200
- Large teams (~250 APM hosts): $15,200
Azure Monitor: Cost for Small, Medium, and Large Teams
Azure Monitor follows an ingestion-based pricing model. Charges primarily depend on how much log data is ingested, how many metric samples are collected, and how long data is retained. Costs increase as observability coverage expands across services and environments.
Pricing inputs used:
- Basic Logs: $0.50 per GB
- Metrics: $0.16 per 10 million samples ingested
Under comparable production workloads, typical monthly costs are:
- Small teams (~30 APM hosts): $2,063.84
- Mid-sized teams (~125 APM hosts): $5,231.36
- Large teams (~250 APM hosts): $13,227.2
At a higher scale, Azure Monitor spend becomes increasingly sensitive to log volume, metric cardinality, and retention configuration across workspaces.
Datadog: Cost for Small, Medium, and Large Teams
Datadog prices observability based on host-based subscriptions, with separate charges for application performance monitoring and infrastructure monitoring. Costs scale primarily with the number of monitored hosts, which means spend increases as environments grow in size and service count.
Pricing inputs used:
- APM Pro: $35 per host per month
- Infrastructure Pro: $15 per host per month
Using consistent workload assumptions across environments, estimated monthly costs are:
- Small teams (~30 APM hosts): $8,185
- Mid-sized teams (~125 APM hosts): $27,475
- Large teams (~250 APM hosts): $59,050
At a larger scale, Datadog costs reflect the cumulative effect of host-based pricing across infrastructure and application tiers. As additional services are added, observability spend tends to increase in step with host count.
For a detailed breakdown of how Datadog pricing is calculated at different scales, including how host-based charges compound across APM and infrastructure tiers, you can explore the CubeAPM Datadog pricing calculator here.
Sampling strategy
CubeAPM: Uses smart sampling to determine which traces should be retained based on how requests behave. Sampling decisions consider signals such as latency, errors, and execution paths before data is stored. This allows traces that carry diagnostic value to be preserved while reducing low-signal traffic, helping control ingestion volume as request rates increase without relying on static sampling percentages.
Azure Monitor: Supports fixed-percentage sampling and rate-limited sampling for application tracing when using Application Insights and OpenTelemetry. Fixed-percentage sampling retains a consistent fraction of requests, while rate-limited sampling enforces an upper bound on the number of traces collected per second. Sampling decisions are applied during ingestion and are typically configured at the SDK or exporter level, requiring explicit tuning as traffic patterns change.
Datadog: Supports both head-based and tail-based sampling for distributed tracing. Head-based sampling makes decisions at the start of a request, while tail-based sampling evaluates completed traces and can retain them based on observed characteristics such as errors or latency. Sampling configuration is managed within the Datadog platform and is used to balance trace volume against visibility as system traffic grows.
Data retention
CubeAPM: Provides unlimited data retention for metrics, logs, and traces. Retention policies are not constrained by predefined time windows and are controlled by the team operating the platform. This allows telemetry to be retained based on operational, investigative, or compliance requirements rather than vendor-imposed limits.
Azure Monitor: Applies retention limits based on data type and configuration. Basic Logs are retained for 30 days, while custom metrics are retained for 90 days. Retention behavior is tied to Azure Monitor pricing and data models, and longer-term retention typically requires additional storage, which can increase the cost.
Datadog: Applies retention periods that vary by telemetry type and customer plan. APM traces and indexed spans are retained for a limited time window (for example, around 15 days) for search and detailed analysis, while aggregated statistics may be kept longer. Log retention periods are determined by the customer’s selected plan and configuration, with longer retention requiring higher-tier plans or additional storage options. Retention behavior is defined by Datadog’s documented data retention policies and differs across products and pricing tiers.
Support channels and response time (TAT)

CubeAPM: Provides support through Slack and email, with requests handled directly by the engineering team. Response times for active issues are typically under 10 minutes, without requiring separate support tiers. This support model is designed for teams running production workloads where fast feedback during incidents is critical.
Azure Monitor: Support is delivered through Microsoft Azure support plans rather than as a product-specific offering. Under the Standard support plan, critical (Severity A) issues have an initial response target of less than 1 hour. Higher-tier plans, such as Unified Enterprise support, offer faster response targets for critical issues, with response times cited as low as 15 minutes, depending on severity and agreement level.
Datadog: Datadog’s support terms define response targets based on impact and plan level. For a business-critical incident, the Standard Support plan aims to respond to support requests within 2 hours, while Premier Support targets responses within 30 minutes for similar critical scenarios. Other, lower-severity issues have longer initial response targets depending on incident type and plan level in the documented support terms.
How Teams Evaluate These Platforms at Scale
As systems grow, teams move away from feature comparisons and focus on how observability behaves under sustained production load. At scale, observability evaluation centers on whether metrics, logs, and traces remain usable during incidents, how much configuration effort is required over time, and how quickly engineers can trace issues across many services.
For platforms like Azure Monitor and Datadog, teams often look at how native workflows and centralized views perform as telemetry volume increases. Sampling limits, retention rules, and pricing mechanics are examined closely, especially during traffic spikes or extended investigations.
When evaluating CubeAPM, teams tend to focus on application-level visibility as trace volume grows and on how ingestion and retention can be managed over long periods. Across all three platforms, predictability, investigation speed, and ongoing operational overhead tend to matter more than ease of initial setup.
Azure Monitor vs Datadog vs CubeAPM: Use cases
Choose CubeAPM if:
- You are standardizing on OpenTelemetry for traces, metrics, and logs across services.
- Your workloads are distributed or span hybrid and multi-cloud environments.
- Application-level tracing is a primary requirement for debugging and performance analysis.
- You need long-term telemetry retention without fixed vendor-imposed limits.
Choose Azure Monitor if:
- Your applications and infrastructure run primarily on Microsoft Azure.
- You rely on Azure-native services such as Application Insights, Log Analytics, and Activity Logs.
- You want monitoring tightly integrated with Azure Portal, RBAC, and resource management.
- Your observability needs are closely aligned with Azure platform diagnostics and services.
Choose Datadog if:
- You want a centralized SaaS observability platform across many services and technologies.
- You need broad out-of-the-box integrations for infrastructure, applications, and third-party tools.
- Host-based pricing aligns with how your environments are structured.
- You prefer a managed platform with built-in dashboards and cross-signal correlation.
Conclusion
Azure Monitor, Datadog, and CubeAPM approach observability from different starting points. Azure Monitor is designed around Azure-native diagnostics and works best when monitoring stays closely aligned with Microsoft Azure services. Datadog provides a centralized SaaS platform that brings together metrics, logs, traces, and events across a wide range of technologies and environments. CubeAPM focuses on OpenTelemetry-based observability, emphasizing application-level visibility and ingestion-driven scaling.
As systems grow, differences between these platforms become more apparent in how they handle sampling, retention, pricing, and operational workflows. What works well for basic monitoring at a smaller scale can behave very differently under sustained production load, higher telemetry volume, and frequent investigations.
In practice, teams choose between these tools based on where their workloads run, how observable data is generated and retained, and how much control they want over cost and configuration as systems evolve. Evaluating these factors early helps avoid surprises as observability requirements expand over time.
Disclaimer: The information in this article reflects the latest details available at the time of publication and may change as technologies and products evolve.
FAQs
1. What is the main difference between Azure Monitor, Datadog, and CubeAPM?
Azure Monitor is a cloud-native monitoring service designed for Microsoft Azure workloads; Datadog is a SaaS observability platform that centralizes metrics, logs, traces, and events across environments; and CubeAPM is an OpenTelemetry-based observability platform focused on ingesting and analyzing application telemetry across distributed systems.
2. Can Azure Monitor and Datadog be used outside their primary ecosystems?
Azure Monitor is optimized for Azure environments, though external data can be ingested with additional configuration. Datadog is cloud-agnostic and commonly used across AWS, Azure, GCP, and on-prem systems. CubeAPM is also cloud-agnostic and is typically used in hybrid or multi-cloud environments through OpenTelemetry instrumentation.
3. How do these tools differ in how they handle observability costs?
Datadog uses host-based pricing models, but the cost drivers differ. Azure Monitor costs are tied to data ingestion and retention by data type, while Datadog pricing is largely host-based with additional usage components. CubeAPM pricing is driven by telemetry ingestion volume, which can change how costs scale as traffic and tracing depth increase.
4. Do all three platforms support distributed tracing?
Yes. Azure Monitor supports distributed tracing through Application Insights and OpenTelemetry exporters; Datadog provides built-in APM with head-based and tail-based sampling, and CubeAPM supports distributed tracing natively through OpenTelemetry. The setup and sampling behavior differ across platforms.
5. Which teams typically evaluate CubeAPM instead of Azure Monitor or Datadog?
Teams often evaluate CubeAPM when they want to standardize on OpenTelemetry, need consistent observability across hybrid or multi-cloud environments, or want greater control over telemetry ingestion and retention. Azure Monitor and Datadog are more commonly chosen when teams prefer Azure-native tooling or a fully managed SaaS platform, respectively.


