










Amazon Managed Service for Prometheus (AMP) charges for metric samples ingested, stored, and queried with a tiered pricing model that starts low but scales fast. A 10-node Kubernetes cluster scraping 1,000 metrics per node every 30 seconds costs approximately $81/month in AMP according to AWS pricing examples. Scale to 50 nodes and that figure jumps to $405/month. Add query load, native histograms, or the managed collector, and monthly costs can exceed $1,000 before you ingest a single log or trace.
Beyond cost, three structural issues drive most AMP evaluations. First, the tiered ingestion model makes month-to-month forecasting difficult. Second, AWS egress fees add $0.09/GB when querying AMP from outside the same AWS region. Third, AMP is metrics only, no logs, no traces, no unified correlation, which pushes teams to stack Amazon Managed Grafana ($9/user/month) and CloudWatch Logs ($0.50/GB ingested) on top.
This guide breaks down AMP pricing, features, limitations, and alternatives. Each section includes real cost scenarios, sourced drawbacks, and decision criteria for teams evaluating AWS managed Prometheus versus self-hosted or unified observability platforms.
What Is Amazon Managed Service for Prometheus?
Amazon Managed Service for Prometheus is a fully managed, Prometheus-compatible monitoring service for container and Kubernetes workloads running on AWS. It ingests metrics scraped by Prometheus agents or OpenTelemetry collectors, stores them in a secure workspace, and exposes them via PromQL queries. AMP eliminates the operational burden of running Prometheus servers, managing storage, or configuring high availability clusters.
AMP is not a general-purpose APM platform. It handles metrics only. No distributed traces. No log aggregation. No RUM or synthetics. For full observability, teams layer AMP alongside CloudWatch for logs, AWS X-Ray for traces, and Amazon Managed Grafana for visualization. This multi-service architecture drives cost complexity and operational overhead that alternatives like CubeAPM as a Datadog alternative, address with unified platforms.
AWS designed AMP for EKS (Elastic Kubernetes Service) workloads, though it supports metrics from ECS, EC2, and on-prem Kubernetes via remote write. The core value proposition: Prometheus semantics without managing Prometheus infrastructure. The core trade-off: AWS-only deployment and a cost model that penalizes high-cardinality workloads.
How Amazon Managed Service for Prometheus Pricing Works
AMP uses a four-part pricing model: metric samples ingested, metric samples stored, query samples processed, and managed collector usage. Each dimension bills separately. Understanding how these combine is essential to forecasting real monthly costs.
Metric sample ingestion pricing
AMP charges per metric sample ingested with tiered rates that decrease as volume increases. As of early 2026, AWS pricing is:
- First 2 billion samples: $0.90 per 10 million samples
- Next 250 billion samples: $0.35 per 10 million samples
- Over 252 billion samples: $0.16 per 10 million samples
A metric sample is a single data point: one metric name, one timestamp, one value, one set of labels. If you scrape 1,000 metrics every 30 seconds from 10 nodes, you generate 1.2 million samples per hour or 892.8 million samples per month (10 nodes × 1,000 metrics ÷ 30 seconds × 3,600 seconds × 744 hours). That falls entirely in the first tier, costing $80.35/month for ingestion alone.
Native histograms introduced in Prometheus 2.40 change the calculation. Each populated histogram bucket counts as 0.25 of a sample. A histogram with 20 populated buckets counts as 5 samples. Empty buckets are not metered. This matters for workloads with high bucket counts, where native histograms can reduce sample volume by 60–80% compared to classic histograms.
Storage pricing
AMP charges $0.03 per GB per month for stored metric samples and metadata. Storage size depends on two factors: the number of samples ingested and the size of metric metadata (metric names, labels, label values).
AWS estimates 1–2 bytes per sample for storage. Metadata size varies widely based on label cardinality. A metric with 20 labels and 100 unique values per label consumes significantly more space than a metric with 3 labels and 10 values each.
For the 10-node example above (892.8 million samples/month, 1,000 metrics, 20 labels, 100 label values), AWS calculates 3.34 GB of storage, costing $0.10/month. Storage is rarely the cost driver. Ingestion dominates.
Query pricing
AMP charges $0.10 per billion query samples processed (QSP). QSP is the total number of data points scanned to execute a PromQL query. A query covering 24 hours of data for a metric scraped every 30 seconds scans 2,880 samples per series. If that query spans 100 series, QSP is 288,000.
Query costs scale with dashboard refresh frequency, query complexity, and lookback windows. A Grafana dashboard with 20 panels refreshing every 60 seconds, each querying 100,000 samples, generates 7.2 billion QSP per month (assuming 2 hours of daily viewing). That costs $0.72/month.
High query costs appear when teams run frequent recording rules, alerting rules with wide lookback windows, or SLO calculations over 30-day periods. One Reddit user documented query costs exceeding ingestion costs after enabling hourly SLO recalculation across 500 services.
Managed collector pricing
AWS offers a managed scraper called Amazon Managed Service for Prometheus collector. It costs $0.04 per collector hour plus $0.03 per 10 million samples collected. For a single collector running 744 hours/month collecting 892.8 million samples, the cost is $29.78 for collector hours plus $2.68 for samples collected, totaling $32.46/month.
The managed collector simplifies deployment but adds 40% to total cost compared to self-managed Prometheus agents. Most teams use ADOT (AWS Distro for OpenTelemetry) or Prometheus Operator instead to avoid this fee.
Amazon Managed Service for Prometheus Cost Scenarios: Real Monthly Pricing
Cost estimates below model realistic workloads based on AWS pricing as of early 2026. All figures link to AWS pricing documentation.
Small Kubernetes cluster: 10 nodes, 1,000 metrics per node
- Scrape interval: 30 seconds
- Monthly samples ingested: 892.8 million
- Ingestion cost: $80.35
- Storage (3.34 GB): $0.10
- Query samples processed (7.2 billion): $0.72
- Total monthly cost: $81.17
This assumes no managed collector, minimal query load, and standard label cardinality. Add a managed collector and the cost rises to $113.63/month.
Medium EKS cluster: 50 nodes, 1,500 metrics per node
- Scrape interval: 30 seconds
- Monthly samples ingested: 6.7 billion
- Ingestion cost: $603.00 (first 2B at $0.90/10M + next 4.7B at $0.35/10M)
- Storage (25 GB): $0.75
- Query samples processed (50 billion): $5.00
- Total monthly cost: $608.75
Scale query load for 5 engineers viewing dashboards 2 hours/day, and query cost rises to $12–$15/month. Still manageable. The problem appears when you add alerting rules that query every minute.
Large production cluster: 150 nodes, 2,000 metrics per node
- Scrape interval: 15 seconds (higher resolution for production)
- Monthly samples ingested: 53.6 billion
- Ingestion cost: $4,377.60 (tiered across all three pricing bands)
- Storage (200 GB): $6.00
- Query samples processed (500 billion): $50.00
- Total monthly cost: $4,433.60
This excludes managed Grafana, CloudWatch Logs, or X-Ray. For unified observability, add $9/user/month for Grafana (3 users = $27), $50/month for CloudWatch Logs (100 GB), and $150/month for X-Ray traces (10 million traces). Total observability cost: $4,660/month.
Compare this to CubeAPM pricing at $0.15/GB all-in. 200 GB of metrics, 100 GB of logs, 50 GB of traces = 350 GB total. Cost: $52.50/month for compute at $0.15/GB, plus self-hosted infrastructure (estimated $200/month for a 3-node HA cluster on AWS EC2). Total: $252.50/month.
Key Features of Amazon Managed Service for Prometheus
AMP delivers core Prometheus functionality without operational overhead. Teams get high availability, automatic scaling, and AWS-native integrations. Understanding what AMP includes and what it does not is critical to evaluating fit.
Prometheus-compatible ingestion and querying
AMP supports Prometheus remote write for ingestion and PromQL for querying. Any agent that writes to Prometheus (Prometheus Operator, ADOT, Grafana Agent, Telegraf) works with AMP without modification. Queries execute via the standard Prometheus HTTP API, meaning existing Grafana dashboards and alerting rules work as is.
This compatibility is AMP’s strongest feature. Migration from self-hosted Prometheus requires changing one remote write endpoint. No data format changes. No query rewrites. Zero learning curve for teams already using Prometheus.
High availability and automatic scaling
AMP runs across multiple availability zones by default. If one AZ fails, queries and ingestion continue without interruption. Storage scales automatically as sample volume grows. No disk provisioning, no replication configuration, no failover scripting.
For teams running self hosted Prometheus with Thanos or Cortex for HA, AMP eliminates that complexity entirely. The trade-off: you lose control over retention policies (AMP defaults to 150 days, configurable down to 1 day) and cannot customize compaction or downsampling behavior.
Native histogram support
AMP supports Prometheus native histograms, which reduce storage and query costs by 60–80% compared to classic histograms. Each populated bucket counts as 0.25 samples instead of 1. For workloads with high histogram cardinality (latency distributions, request sizes), this cuts ingestion costs significantly.
Adoption is still early. Most Prometheus instrumentation libraries do not emit native histograms by default. Teams must explicitly enable them in application code and ensure their query tooling supports the new format.
AWS-native integrations
AMP integrates directly with EKS, ECS, and EC2 via ADOT. CloudWatch Container Insights can forward metrics to AMP. Amazon Managed Grafana connects to AMP workspaces with one click. IAM policies control who can ingest, query, and manage workspaces.
This tight AWS coupling is both a feature and a limitation. If your infrastructure is 100% AWS, AMP fits naturally. If you run multi-cloud or hybrid environments, AMP becomes one of many metrics backends, complicating your observability architecture.
No log or trace correlation
AMP handles metrics only. To correlate a latency spike in AMP with error logs or trace spans, you must manually switch between AMP, CloudWatch Logs, and X-Ray. No unified interface. No automatic correlation. No single query that spans metrics, logs, and traces.
This fragmentation drives teams toward unified platforms where metrics, logs, and traces share the same backend and query interface. Tools like Honeycomb pricing and review or CubeAPM solve this by design.
Limitations and Drawbacks of Amazon Managed Service for Prometheus
AMP works well for specific use cases but has structural limitations that surface at scale or in regulated environments. Every limitation below is sourced from AWS documentation, Reddit threads, or user-reported issues.
Metrics only, no unified observability
AMP stores metrics. Period. No logs. No traces. No frontend monitoring. To build full observability, you assemble AMP + CloudWatch Logs + X-Ray + Managed Grafana. Each service bills separately. Each has its own retention policy, query language, and access control model.
A production incident requires switching between four AWS consoles to correlate a CPU spike (AMP) with an error log (CloudWatch) and a slow database trace (X-Ray). Compare this to unified platforms where one query surfaces correlated signals across all telemetry types.
Tiered pricing makes forecasting difficult
AMP’s three-tier ingestion model means your per-sample cost changes as volume grows. In January, you pay $0.90 per 10M samples. In February, after crossing 2 billion samples, the marginal cost drops to $0.35 per 10M. This variability complicates budgeting.
Reddit users have noted that AMP costs can jump unexpectedly when a new service starts scraping high-cardinality metrics or when a DaemonSet rollout temporarily doubles node count during a deployment.
AWS egress fees when querying from outside the region
If your Grafana instance runs in us-east-1 and your AMP workspace is in us-west-2, AWS charges approximately $0.09/GB for cross-region data transfer. Querying 10 GB of metric data per day and egress fees add $27/month.
This is rarely mentioned in AMP pricing discussions but can exceed query costs for teams running centralized Grafana in one region querying AMP workspaces in multiple regions.
No on-prem or hybrid deployment
AMP runs only in AWS. If you have data residency requirements, HIPAA constraints, or air-gapped environments, AMP is not an option. Self-hosted Prometheus or platforms like CubeAPM that deploy inside your VPC are the only paths forward.
Limited retention customization
AMP defaults to 150 days of retention. You can reduce it to as low as 1 day but cannot extend beyond 150 days without exporting to S3 and querying via Athena. Long-term retention for compliance or trend analysis requires additional engineering.
Compare this to self-hosted Prometheus with Thanos or Cortex, where retention is limited only by your S3 bucket size and budget.
Amazon Managed Service for Prometheus Alternatives
AMP fits specific workflows but is not the only managed Prometheus option. The alternatives below are grouped by deployment model and use case. Each includes pricing, deployment options, and sourced trade-offs.
CubeAPM: Self-hosted unified observability with predictable pricing
CubeAPM runs inside your VPC or on-prem, handling metrics, logs, traces, and Kubernetes monitoring in one platform. It ingests Prometheus metrics via remote write, OpenTelemetry, or Datadog agents. Unlike AMP, CubeAPM correlates metrics with traces and logs automatically.
Pricing: $0.20/GB all-in for ingestion. No per-user fees. No separate storage charges. A 50-node cluster ingesting 200 GB/month of metrics, logs, and traces costs $40/month for CubeAPM ingestion plus approximately $200/month for self-hosted infrastructure (3-node HA cluster on AWS EC2). Total: $240/month.
Deployment: Self-hosted in your cloud or data center. Managed by the CubeAPM team (upgrades, patches, support), but data never leaves your infrastructure.
Best for: Teams with data residency requirements, cost-sensitive workloads, or those consolidating metrics, logs, and traces into one platform.
Limitations: Requires managing infrastructure. Not a pure SaaS experience.
Learn more: CubeAPM pricing
Grafana Cloud: Managed Prometheus with full LGTM stack
Grafana Cloud offers managed Prometheus, Loki (logs), Tempo (traces), and Grafana dashboards in one service. Metrics are ingested via Prometheus remote write or Grafana Agent. Pricing is usage-based with free and paid tiers.
Pricing: Free tier includes 10,000 series, 50 GB logs, 50 GB traces. Pro tier starts at $8/month for 15,000 series, $0.50/GB for logs beyond 100 GB, and $0.50/GB for traces. A 50-node cluster exceeds the free tier and costs approximately $150–$200/month.
Deployment: SaaS only. No on-prem option.
Best for: Teams already using Grafana OSS who want to offload Prometheus operations to Grafana Labs.
Limitations: Costs scale with cardinality. High-label metrics drive series count up fast. No self-hosted option.
VictoriaMetrics: High-performance self-hosted Prometheus alternative
VictoriaMetrics is a time-series database that ingests Prometheus metrics, supports PromQL, and compresses data 7x better than Prometheus. Open-source and free for self-hosting. Managed cloud option available.
Pricing: Open-source version is free. VictoriaMetrics Cloud starts at $0.01/hour for compute. A 50-node workload costs approximately $200/month self-hosted (infrastructure) or $400/month on VictoriaMetrics Cloud.
Deployment: Self-hosted or VictoriaMetrics Cloud (SaaS).
Best for: Teams with high metric volumes who need lower storage costs than Prometheus or AMP.
Limitations: Smaller ecosystem than Prometheus. Some PromQL edge cases are not fully compatible. Requires Prometheus or ADOT for scraping.
Self-hosted Prometheus with Thanos or Cortex
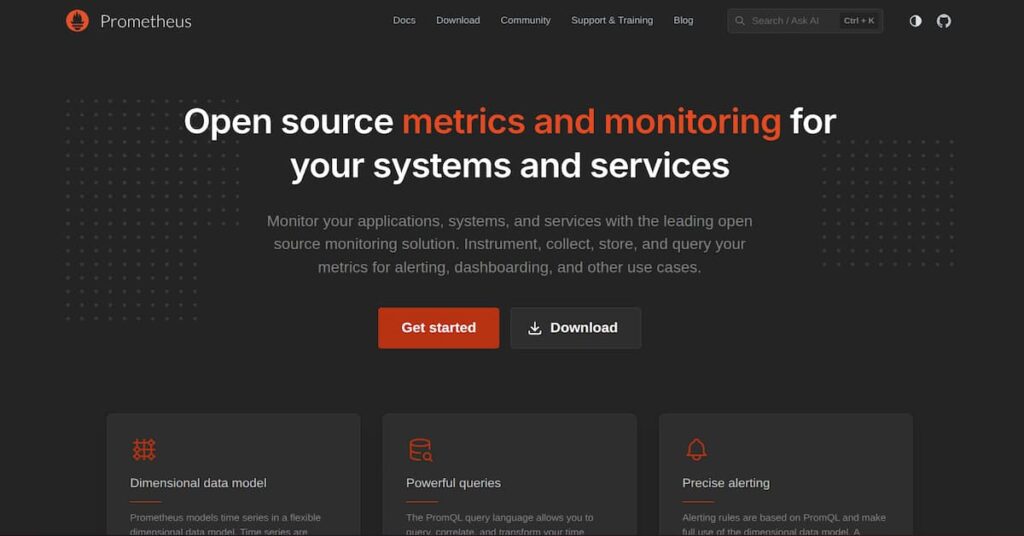
Run Prometheus in Kubernetes, use Thanos or Cortex for long-term storage and HA. This is the DIY route. Full control, zero vendor fees, maximum operational overhead.
Pricing: Infrastructure only. A 3-node Prometheus HA setup with Thanos sidecar costs approximately $300/month on AWS (compute, storage, egress).
Deployment: Self-hosted.
Best for: Teams with strong Prometheus expertise who want full control.
Limitations: You manage everything: upgrades, HA, scaling, storage compaction, backup/restore. Operational burden is high.
How to Migrate from Amazon Managed Service for Prometheus
Migrating away from AMP depends on your target platform. The steps below assume migration to CubeAPM but apply to any Prometheus-compatible backend.
Step 1: Audit current AMP usage
Identify what writes to AMP: Prometheus Operator, ADOT, Grafana Agent. List all workspaces, retention policies, and query sources (Grafana dashboards, alert rules, API consumers).
Step 2: Deploy target platform
For CubeAPM, deploy a 3-node HA cluster in your AWS VPC. CubeAPM team handles setup and provides a Prometheus remote write endpoint. For Grafana Cloud, create a workspace and note the remote write URL.
Step 3: Dual-write metrics during cutover window
Configure your Prometheus agents to write to both AMP and the new backend. This allows validation without data loss. Run dual-write for 7–14 days.
Step 4: Migrate dashboards and alerts
Export Grafana dashboards from AMP workspace. Import to new Grafana instance connected to CubeAPM or Grafana Cloud. Test each panel. Migrate alerting rules by copying PromQL queries to the new alert manager.
Step 5: Switch query traffic and decommission AMP
Point all queries to the new backend. Monitor for 7 days. If stable, delete AMP workspace.
Estimated timeline: 2–4 weeks for a 50-node cluster with 20 dashboards and 50 alert rules.
Frequently Asked Questions
How much does Amazon Managed Service for Prometheus cost?
AMP charges per metric sample ingested ($0.90 per 10M samples for the first 2 billion), stored ($0.03/GB/month), and queried ($0.10 per billion samples processed). A 10-node Kubernetes cluster costs approximately $81/month. A 50-node cluster costs $600–$800/month depending on query load.
Does AMP support logs and traces?
No. AMP handles metrics only. For logs, use CloudWatch Logs ($0.50/GB ingested). For traces, use AWS X-Ray ($5 per million traces). For unified observability, consider alternatives like CubeAPM or Grafana Cloud that combine metrics, logs, and traces in one platform.
Can I run AMP on-prem or in other clouds?
No. AMP runs only in AWS regions. If you need on-prem or multi-cloud deployment, use self-hosted Prometheus, VictoriaMetrics, or CubeAPM.
What is the retention period for AMP?
AMP defaults to 150 days. You can configure retention down to 1 day. For longer retention, export metrics to S3 and query via Athena.
How does AMP pricing compare to Datadog or New Relic?
AMP is cheaper for metrics-only workloads. Datadog charges $15/host/month for infrastructure monitoring plus per-metric ingestion fees. New Relic charges $0.40/GB. For a 50-node cluster, AMP costs $600/month, Datadog costs $1,200/month, and New Relic costs around $800/month. However, Datadog and New Relic include logs, traces, and APM. AMP does not.
Does AMP support OpenTelemetry?
Yes. AMP ingests metrics via Prometheus remote write, which OpenTelemetry Collector supports natively. Configure OTEL Collector to export metrics to AMP using the Prometheus remote write exporter.
What happens to my data if I stop using AMP?
AMP does not support bulk export. To preserve historical data, dual-write to another backend before decommissioning AMP, or use Grafana Mimir’s migration tools to export samples to a new Prometheus-compatible system.
Disclaimer: The information in this article reflects the latest details available at the time of publication and may change as technologies and products evolve. Features, pricing, and plan limits can change over time. Always verify the latest information directly with the vendor before making purchasing or deployment decisions.