









Prometheus has been the go-to metrics tool for Kubernetes environments since it joined the CNCF in 2016. It scrapes time-series data on a pull model, stores it in its custom TSDB, and exposes a rich query language called PromQL.
ClickStack is a newer, open-source observability stack built by ClickHouse in 2025 after acquiring HyperDX. It unifies logs, metrics, traces, and session replay in a single columnar database, using OpenTelemetry for ingestion and a purpose-built UI called HyperDX for visualization.
This comparison looks at architecture, data model, scalability, query experience, and use cases to help you decide which tool belongs in your stack.
🔑 Key Takeaways
- Prometheus is a dedicated metrics tool with a proven pull-based scrape model and PromQL.
- ClickStack is a full observability stack covering logs, metrics, traces, and session replay in one database.
- Prometheus struggles with high-cardinality metrics at scale; ClickHouse handles them natively via columnar storage.
- ClickStack uses OpenTelemetry natively; Prometheus uses its own exposition format with an OTel compatibility layer.
- Both are Apache 2.0 licensed and free to self-host.
- Choose Prometheus for a dedicated metrics layer; choose ClickStack for unified, multi-signal observability.
ClickStack vs Prometheus: Feature Overview
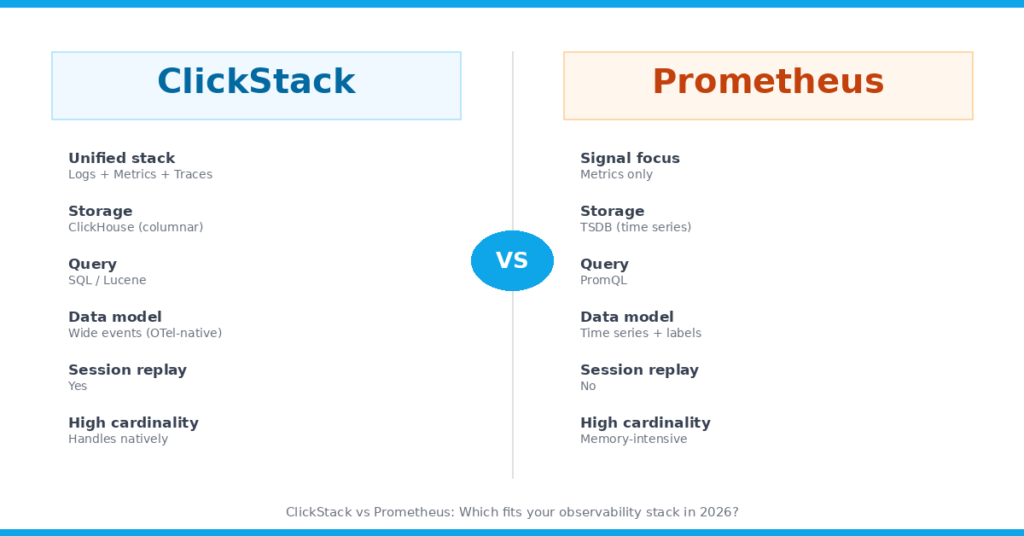
ClickStack vs Prometheus: a side-by-side feature overview
What Is Prometheus?
Prometheus is an open-source monitoring and alerting toolkit originally built at SoundCloud and released in 2012. It became a CNCF graduated project in 2018 and is licensed under the Apache 2.0 license.
Its core job is collecting numeric metrics from instrumented targets using an HTTP pull model. Each application exposes a /metrics endpoint, and Prometheus scrapes it on a configurable interval. It stores data locally in its time series database (TSDB) and provides PromQL, a functional query language designed specifically for time-series data.
Prometheus is metrics-only. For logs, you need Loki. For traces, you need Tempo or Jaeger. That is why most teams pair it with the full LGTM stack (Loki, Grafana, Tempo, Mimir) to get full observability coverage.
What Is ClickStack?
ClickStack is an open-source observability stack released by ClickHouse in 2025, built from the acquisition of HyperDX earlier that year. It is also Apache 2.0 licensed.
It brings three components together into one cohesive stack:
- ClickHouse as the high-performance columnar storage engine for all telemetry data.
- OpenTelemetry Collector (a custom, preconfigured distribution) for ingesting logs, metrics, traces, and session data.
- HyperDX UI as the visualization and investigation layer, supporting SQL, Lucene-style queries, dashboards, alerting, and trace exploration.
Unlike Prometheus, ClickStack stores all four observability signals in a single ClickHouse database. That means you can correlate a slow trace with the log lines and infrastructure metrics that surrounded it in the same query, without jumping between tools.
Architecture Comparison
The fundamental difference between ClickStack and Prometheus is one of scope. Prometheus is a single-purpose time-series database with a scrape engine. ClickStack is a full observability platform where the database happens to be ClickHouse.
| Feature | ClickStack | Prometheus |
|---|---|---|
| Primary purpose | Full observability stack (logs, metrics, traces, sessions) | Metrics collection and alerting |
| Storage engine | ClickHouse (columnar, analytical) | TSDB (custom time-series format) |
| Data ingestion | OpenTelemetry push (OTLP) | HTTP pull (scrape model) |
| Query language | SQL + Lucene-style syntax | PromQL |
| Signals covered | Logs, metrics, traces, session replay | Metrics only |
| UI | HyperDX (built-in) | No built-in UI (Grafana recommended) |
| Alerting | Built-in to HyperDX | Alertmanager (separate component) |
| Session replay | Yes | No |
| License | Apache 2.0 | Apache 2.0 |
| Managed option | ClickHouse Cloud (Managed ClickStack) | Various third-party managed options |
Data Model: Pull vs Push, TSDB vs Columnar
Prometheus uses a pull model. The Prometheus server discovers targets through service discovery and scrapes them at a configured interval, typically every 15 seconds by default. This simplifies deployment since services only need to expose an HTTP endpoint.
ClickStack flips this to push-based ingestion. Your application sends telemetry to the OpenTelemetry Collector, which batches and writes it to ClickHouse using the OTLP protocol. This matches how most modern observability pipelines work and aligns with the OpenTelemetry standard.
Prometheus stores data as time series identified by a metric name plus key-value labels. ClickHouse stores all telemetry as wide events in a columnar format, which enables fast filtering and aggregation across arbitrary dimensions without pre-defining schema.
High Cardinality: Where They Diverge Most
High cardinality is where the architectural difference matters most in practice.
In Prometheus, every unique combination of metric name and label values creates a new time series. Adding dynamic labels like user_id, request_id, or URL path can cause cardinality to explode. A single metric with four label dimensions, each with ten possible values, produces 10,000 time series. This translates directly to memory pressure on the Prometheus server. A practical guideline is to allocate 3 to 4 GB of RAM per million active time series for the head block alone.
ClickHouse handles high-cardinality data natively because of its columnar storage model. It compresses columns with high repetition efficiently and queries across arbitrary attribute combinations without the memory overhead of maintaining per-series state. This is one reason companies at scale like Netflix and eBay have used ClickHouse as a backing store for observability data.
If your application generates per-user, per-request, or per-session metrics, ClickStack scales more predictably than standalone Prometheus.
Query Language: PromQL vs SQL
Prometheus uses PromQL, a purpose-built functional query language for time-series data. It is powerful for calculating rates, histograms, and aggregations over sliding windows. Most Prometheus users learn it as part of the monitoring workflow.
ClickStack exposes SQL for all data types, plus a Lucene-style search syntax in the HyperDX UI for log and trace searches. If your team already knows SQL, the learning curve for ClickStack is lower. If your team has deep PromQL expertise, that is a switching cost worth factoring in.
One practical benefit of SQL in ClickStack is the ability to write cross-signal queries. You can join log data with trace timing data in the same SQL query against ClickHouse, which is not possible when logs and metrics are in separate systems.
Logs, Traces, and Session Replay
Prometheus is metrics only. To monitor your services end-to-end, you need a separate log aggregation system (commonly Loki or Elasticsearch), a trace backend (Jaeger, Tempo, or a commercial tool), and a dashboarding layer (Grafana). Each of these adds operational overhead, and correlating data across them requires manual effort.
ClickStack covers all four signals in one stack. Logs, metrics, traces, and session replays all land in ClickHouse. The HyperDX UI is built to correlate them. For example, you can open a trace, jump to the associated log lines that occurred in the same time window, and view the infrastructure metrics for the affected host without leaving the interface.
Session replay is particularly notable. Among open-source observability tools, very few include frontend session capture alongside backend telemetry in a single platform.
Alerting
Prometheus handles alerting through a separate component called Alertmanager. You define alerting rules in PromQL, Prometheus evaluates them, and Alertmanager routes notifications to Slack, PagerDuty, email, or webhook endpoints. This is a mature, well-understood setup that most SREs are familiar with.
ClickStack includes alerting directly in the HyperDX UI. Alerts can be defined over any signal type: log patterns, metric thresholds, trace error rates, or custom SQL queries. This means a single alerting interface covers your entire observability scope without a separate Alertmanager deployment.
Deployment and Operational Overhead
Prometheus is a single binary with minimal dependencies. It is straightforward to run in Kubernetes via the prometheus-operator or the kube-prometheus-stack Helm chart. The trade-off is that for full observability you need to also deploy and maintain Loki, Tempo, and Grafana alongside it.
ClickStack is also deployable as a Docker Compose setup or via Helm chart, and it includes a preconfigured OpenTelemetry Collector. The stack is heavier than a standalone Prometheus but lighter than the full LGTM stack because everything runs on a single ClickHouse instance.
ClickHouse Cloud offers a managed version of ClickStack where ClickHouse and the HyperDX UI are hosted and operated for you. Users run only the OpenTelemetry Collector on their own infrastructure, which significantly reduces the operational burden.
When to Choose Prometheus
- Your team has deep PromQL expertise and an established Grafana setup.
- You need a dedicated, lightweight metrics layer with a proven CNCF ecosystem.
- You are already using the LGTM stack and want to keep the components separate.
- Your metric cardinality is manageable and you do not need log or trace correlation.
- You need the widest possible ecosystem of exporters for third-party systems.
When to Choose ClickStack
- You want logs, metrics, traces, and session replay in a single storage layer.
- High-cardinality metrics from dynamic environments like Kubernetes are causing Prometheus memory issues.
- You want to use OpenTelemetry as the single instrumentation standard across your stack.
- Your team is comfortable with SQL and wants to run cross-signal queries.
- You are starting fresh and want to avoid building a multi-component observability stack.
📌 Looking for a Self-Hosted APM That Covers the Full Observability Stack?
CubeAPM is a self-hosted, OpenTelemetry-native APM and observability platform with flat-rate pricing at $0.15/GB, with no per-host, per-user, or per-series fees.
It supports distributed tracing, metrics, logs, and service maps out of the box, and works with any OpenTelemetry-instrumented application.
CubeAPM gives you full observability without the cost unpredictability of SaaS tools or the operational complexity of multi-component open-source stacks.
Conclusion
Prometheus and ClickStack solve different problems. Prometheus is a focused, battle-tested metrics platform with a massive ecosystem, a pull-based model that integrates cleanly into Kubernetes, and PromQL as a powerful query language for time-series data.
ClickStack is a broader bet: a unified observability stack that stores all telemetry signals in ClickHouse, uses OpenTelemetry for ingestion, and exposes everything through the HyperDX UI. It handles high-cardinality data more efficiently and eliminates the need to stitch together separate log, trace, and metrics backends.
The right choice depends on what you already run. If you have Prometheus embedded in a mature Grafana ecosystem, the switching cost may outweigh the benefits. If you are building from scratch or hitting Prometheus scaling limits, ClickStack is worth evaluating as a unified alternative.
⚠️ Disclaimer
Pricing and feature information referenced in this article is based on publicly available documentation as of June 2026. Product capabilities change frequently; verify details directly with each vendor before making infrastructure decisions.
FAQs
1. Does ClickStack replace Prometheus entirely?
Not necessarily. ClickStack covers metrics alongside logs, traces, and session replay in a unified stack. If you are already invested in the Prometheus and Grafana ecosystem, you can continue using Prometheus for metrics and use ClickStack as an alternative if you want a single-database approach. ClickStack does support ingesting Prometheus metrics via OpenTelemetry, so migration paths exist.
2. Can ClickStack ingest Prometheus metrics?
Yes. ClickStack ingests all telemetry through OpenTelemetry, and OpenTelemetry supports Prometheus remote-write and scraping as a receiver. You can configure an OpenTelemetry Collector to scrape Prometheus endpoints and forward the data to ClickStack without modifying your instrumentation.
3. How does ClickStack handle high cardinality compared to Prometheus?
ClickHouse, the storage engine behind ClickStack, uses columnar compression and a format that does not tie memory usage directly to the number of unique label combinations. Prometheus TSDB keeps active time series in memory, and cardinality explosions can cause OOM errors. ClickStack is a better fit for workloads with dynamic labels like user IDs, container IDs, or request paths.
4. Is ClickStack free to use?
The open-source version of ClickStack is free and licensed under Apache 2.0. ClickHouse Cloud offers a managed version of ClickStack where ClickHouse and the HyperDX UI are hosted for you. That managed option has its own pricing based on ClickHouse Cloud compute and storage consumption. You can review current pricing at https://clickhouse.com/pricing.
5. What query language does ClickStack use?
ClickStack uses SQL for queries against ClickHouse, which covers all signal types including logs, metrics, and traces. The HyperDX UI also supports a Lucene-style search syntax for log and trace searches, similar to what you get in Elasticsearch or Kibana. Prometheus uses PromQL, which is purpose-built for time-series arithmetic but limited to the metrics domain.