Monitoring Apache HTTP Servers is critical to keep sites fast, reliable, and error-free. As of September 2025, Apache powers 25.5% of all websites worldwide, making it the backbone of the internet. Even small performance dips can quickly cascade into downtime and lost revenue.
Yet many teams struggle when monitoring Apache HTTP Servers. Basic tools like mod_status or raw logs miss latency spikes, error surges, and upstream issues. In cloud-native and microservices environments, the lack of correlation often forces engineers to firefight blind, delaying root-cause discovery.
CubeAPM is the best solution for monitoring Apache HTTP Servers. It combines metrics, logs, and error tracing with OpenTelemetry-native ingestion, Smart Sampling for scale, and BYOC deployments for compliance—giving teams real-time, cost-efficient Apache visibility.
In this article, we’ll cover what Apache HTTP Servers are, why monitoring matters, the key metrics, and how CubeAPM enables Apache monitoring with dashboards, logs, and trace correlation.
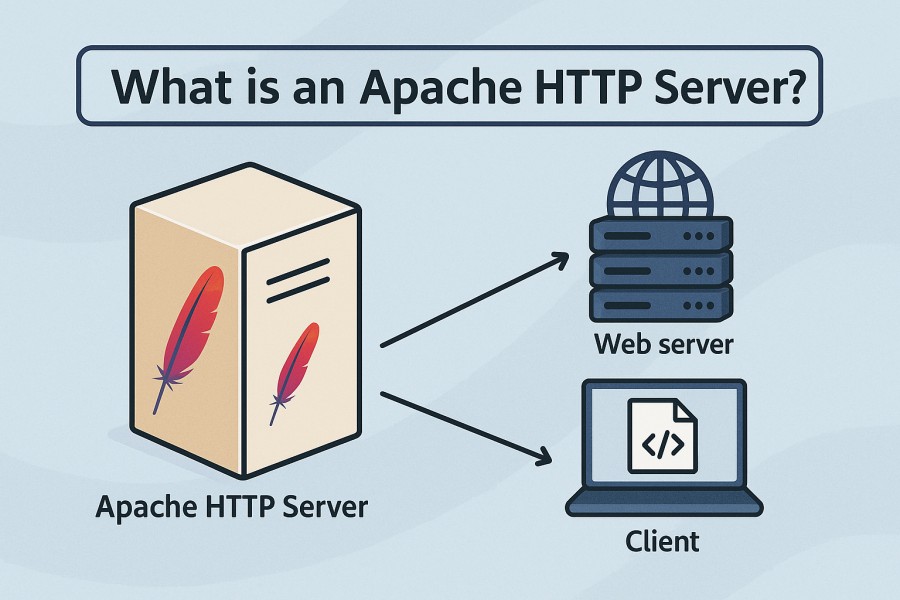
What is an Apache HTTP Server?

Apache HTTP Server, commonly called Apache, is an open-source web server software that’s been powering the internet since 1995. It’s designed to handle everything from simple static websites to complex, high-traffic applications, thanks to its modular architecture (mod_ssl, mod_rewrite, mod_status) and broad compatibility across Linux, Windows, and cloud platforms.
Monitoring Apache HTTP Server is critical for modern businesses because it connects web performance directly to user experience and revenue. By tracking real-time metrics and logs, teams can:
- Detect slowdowns, failed requests, and errors before customers feel the impact
- Optimize resource usage during traffic surges to prevent outages
- Correlate frontend issues with backend services for faster root-cause analysis
- Ensure compliance by monitoring access and error logs for anomalies
Example: Monitoring Apache During Black Friday Sales
Imagine an e-commerce site running Apache during Black Friday. Traffic spikes 10x in minutes, leading to rising latency and 5xx errors. With proactive monitoring, the team spots the bottleneck in request processing time and database connections, scales resources, and resolves the issue before it impacts checkout. Without it, millions in sales could be lost within an hour.
Why Monitoring Apache HTTP Servers is Critical
Concurrency, Worker Saturation, and the Apache Scoreboard
Apache’s mod_status exposes BusyWorkers, IdleWorkers, and a detailed “scoreboard” of request states. These are critical signals: if MaxRequestWorkers is too low, requests queue and time out; too high, and the server risks memory swapping. Monitoring these values ensures stable performance and helps fine-tune concurrency before bottlenecks impact end users.
Reverse Proxy & Upstream Reliability (mod_proxy)
Apache is frequently deployed as a reverse proxy using mod_proxy. Here, spikes in 502 (Bad Gateway) and 504 (Gateway Timeout) errors reveal upstream outages or slow applications. Watching backend connect times and ProxyTimeout values helps operators separate Apache misconfigurations from real upstream failures.
Choosing the Right MPM (event/worker vs. prefork)
Apache’s multi-processing modules (MPMs) dictate how it handles requests. Prefork runs one process per request and consumes more memory, while worker/event MPMs use threads to support higher concurrency. Monitoring RAM per process, thread utilization, and context switches ensures that whichever MPM you use, it’s tuned for workload and stability.
TLS/SSL Handshakes and Certificate Expiry
Apache is widely used as an HTTPS terminator with mod_ssl. Tracking handshake times helps detect CPU spikes or misconfigured ciphers, while monitoring certificate expiry avoids costly downtime. A Let’s Encrypt outage in 2021 showed how missed renewals can impact millions of domains — proactive monitoring makes this preventable.
Capacity Planning Under Real Traffic
Metrics like requests per second, bytes per second, keep-alive utilization, and latency percentiles (p95/p99) guide scaling decisions. Monitoring them helps teams avoid over-provisioning while ensuring headroom for traffic spikes.
Business Impact: Minutes Matter
Apache often serves as the front door to revenue-critical apps. When it falters, the impact is immediate. Industry research shows the average cost of downtime is $14,056 per minute (EMA, 2024 via BigPanda) — a reminder that even short disruptions at the web tier can cascade into major financial losses.
Compliance and Security Monitoring
Apache access and error logs are a key compliance artifact for GDPR, HIPAA, and PCI DSS audits. Real-time monitoring of unusual user agents, suspicious IPs, or brute-force login attempts allows teams to catch security issues before regulators or attackers do. This makes observability not just a performance concern, but a governance requirement.
From mod_status to Full Telemetry
While mod_status with ExtendedStatus On provides valuable basics, it is not enough for complex environments. Modern monitoring requires combining structured logs, infrastructure metrics, and distributed traces to pinpoint whether a spike in 5xx errors originates in Apache, the network, or an upstream database. This holistic view is what keeps MTTR low in real-world environments.
Key Metrics to Monitor in Apache HTTP Server
Monitoring Apache HTTP Server requires a clear view across traffic, performance, and resource consumption. Grouping metrics into categories makes it easier to spot bottlenecks and optimize server behavior.
Request & Traffic Metrics
These metrics reveal how much load Apache is handling and help you detect surges before they overwhelm your infrastructure.
- Requests per second: Shows the number of HTTP requests Apache processes each second. A sudden spike may indicate a traffic surge or even a DDoS attempt. Threshold: alert if requests exceed 2–3x the daily baseline within 5 minutes.
- Bytes served per second: Measures total throughput in bytes sent to clients. Drops may indicate network throttling or upstream slowdowns, while abnormal increases could suggest large file downloads consuming bandwidth. Threshold: alert if throughput grows beyond 80% of your available bandwidth.
- Active connections: Tracks the number of concurrent client connections. Sustained high values can saturate worker threads, leading to delayed responses. Threshold: alert when active connections consistently exceed 75% of MaxRequestWorkers.
Performance & Latency Metrics
These metrics indicate how efficiently Apache responds to requests and whether users are experiencing delays or errors.
- Request processing time: Measures the time taken to serve each request. Monitoring at percentiles (p95, p99) shows tail latency that averages can hide. Threshold: alert if p95 latency exceeds 500 ms for more than 10 minutes.
- Error rates (4xx, 5xx): Track both client (4xx) and server (5xx) errors. Rising 5xx errors often point to backend failures, while spikes in 4xx may indicate misrouted traffic or bots. Threshold: alert if 5xx errors cross 2% of total requests.
- Queue length: Shows how many requests are waiting to be handled. A rising queue signals resource starvation or improper worker tuning. Threshold: alert if the queue length exceeds 20% of worker capacity.
Resource Utilization Metrics
Apache’s performance depends on efficient use of CPU, memory, and I/O. Tracking these ensures that the server doesn’t degrade under pressure.
- CPU usage by Apache processes: High CPU usage often comes from SSL handshakes, heavy mod_rewrite rules, or poorly optimized apps behind Apache. Threshold: alert if CPU usage per process exceeds 85% for sustained periods.
- Memory footprint per child process: Each worker or child process consumes RAM. Growth beyond expected patterns may indicate memory leaks or inefficient modules. Threshold: alert if memory per process rises above 150 MB in prefork MPM setups.
- Disk I/O and log write rates: Apache writes constantly to access and error logs, which can saturate disk I/O in high-traffic scenarios. Monitoring these prevents slowdowns due to logging bottlenecks. Threshold: alert if disk I/O for Apache logs consumes over 70% of disk throughput capacity.
How to Monitor Apache HTTP Server with CubeAPM
Monitoring Apache with CubeAPM is straightforward once you install the platform, connect your infrastructure, and configure metrics, logs, and alerts.
Step 1: Install CubeAPM
To start, deploy CubeAPM in your environment. You can install it on-prem, in your cloud account, or on Kubernetes clusters. The Install Guide and Kubernetes Setup walk you through running the control plane, connecting agents, and preparing Apache hosts for monitoring.
Step 2: Instrument Apache with OpenTelemetry
CubeAPM is OpenTelemetry-native, which means you can use OTel collectors to gather Apache metrics and traces. The OpenTelemetry instrumentation guide explains how to configure collectors to scrape Apache’s mod_status endpoint and forward structured logs. This ensures request counts, latency, and error codes flow into CubeAPM alongside traces.
Step 3: Configure Infrastructure and Log Monitoring

Once agents are connected, use the Infra Monitoring module to track CPU, memory, and disk I/O on Apache servers. Then configure Log Monitoring to ship access and error logs. CubeAPM supports Fluent Bit, Logstash, Vector, and OTel log exporters, parsing entries into structured events for query and correlation with traces.
Step 4: Set Up Dashboards
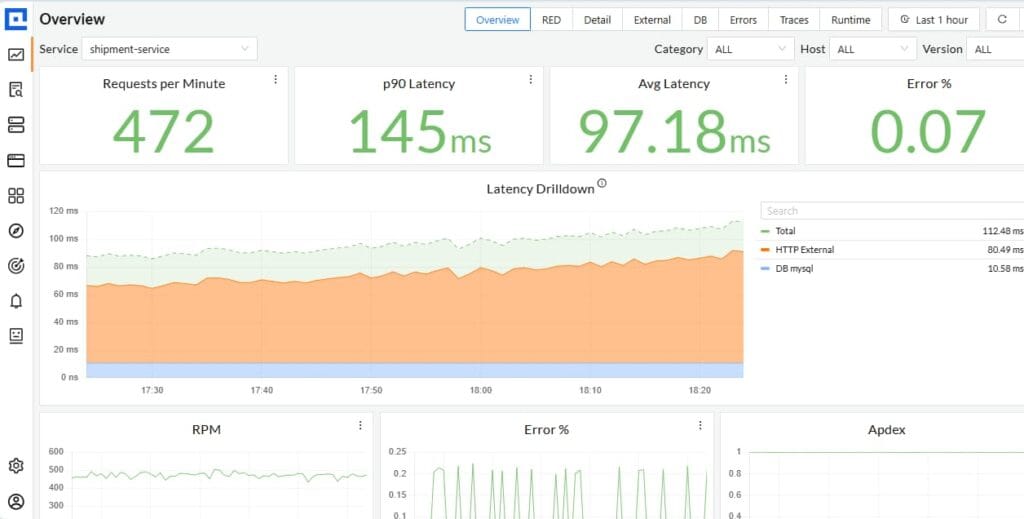
CubeAPM automatically builds dashboards once metrics and logs are ingested. You can customize panels for requests per second, latency percentiles, and error codes by route. By combining Apache logs with system metrics, dashboards reveal whether issues stem from Apache itself or from upstream services.
Step 5: Configure Alerts

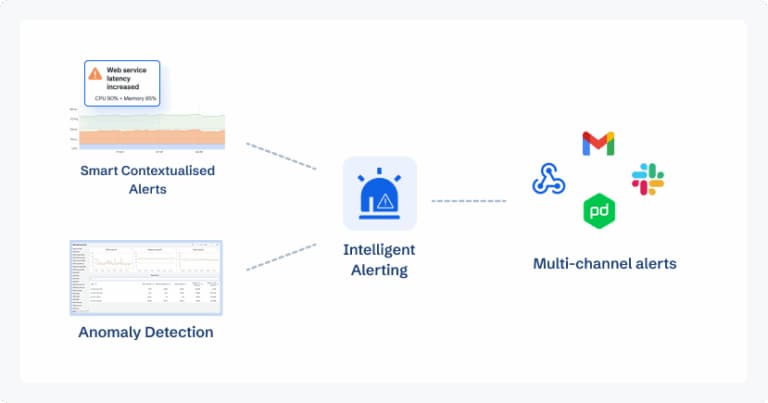
With observability in place, define alerts for critical Apache signals. The alerting docs show how to connect CubeAPM to email, Slack, or PagerDuty. Alerts can trigger on conditions like 5xx error rates >2%, latency >500 ms at the 95th percentile, or memory footprint per process exceeding safe thresholds.
Step 6: Correlate with Traces and Errors
Finally, use CubeAPM’s Instrumentation features to link Apache metrics with distributed traces and error events. This correlation shortens root-cause analysis: when a spike in 502s happens, CubeAPM can point to the slow backend service or resource bottleneck that triggered it.
Real-World Example: Apache Under High Load with CubeAPM
Challenge
A large media streaming platform relied on Apache HTTP Server as its edge gateway to handle millions of concurrent connections during live sports events. On a high-traffic match day, the team noticed sudden spikes in latency and 5xx error rates, especially on video playback requests. Traditional monitoring tools only showed surface-level CPU load, leaving engineers blind to the exact bottleneck.
Solution
The platform deployed CubeAPM to integrate Apache’s mod_status metrics, system resource usage, and access/error logs into one observability layer. They set up dashboards for requests per second, p95 latency, error breakdowns, and BusyWorkers/IdleWorkers metrics. CubeAPM’s Smart Sampling allowed them to ingest traces from millions of requests without blowing up storage costs, ensuring critical anomalies were captured in real time.
Fixes
With CubeAPM’s trace-log correlation, engineers pinpointed that upstream database queries were timing out under traffic surges, cascading into Apache 504 errors. They:
- Increased MaxRequestWorkers to balance concurrency more efficiently
- Tuned keep-alive settings to prevent worker saturation
- Optimized database connection pooling to reduce backend wait times
- Deployed proactive alerts in CubeAPM to trigger on latency >500 ms at the 95th percentile
Result
The fixes reduced error rates by 82% during subsequent live events, cutting p95 latency from 1.2 seconds to under 400 ms. With CubeAPM, the team achieved real-time visibility into Apache under extreme load, slashed mean time to resolution (MTTR) from hours to minutes, and avoided revenue losses projected at $200,000 per hour of downtime.
Verification Checklist & Example Alert Rules for Monitoring Apache HTTP Server with CubeAPM
Before going live, it’s important to validate that your Apache monitoring setup in CubeAPM is complete and reliable. Below is a verification checklist followed by sample alert rules to ensure you catch issues early.
Verification Checklist
- Apache status enabled: Confirm mod_status is active with ExtendedStatus On for detailed metrics.
- Log pipeline working: Ensure access and error logs are being shipped to CubeAPM and parsed into structured fields (method, status code, latency, IP).
- Infrastructure metrics connected: CPU, memory, and disk I/O metrics from Apache servers should appear in CubeAPM Infra Monitoring.
- Dashboards populated: Validate that request rates, latency percentiles, and error code panels are visible and updating in real time.
- Alerts configured: Check that threshold-based alerts (5xx errors, high latency, worker saturation) are firing test notifications to email or Slack.
- Trace correlation active: Verify Apache logs and metrics link to distributed traces for upstream and downstream services.
- Baseline thresholds defined: Historical traffic patterns should be reviewed to set realistic baselines for RPS, latency, and error rates.
Example Alert Rules
1. High Error Rate
Trigger alerts when Apache serves an abnormal number of 5xx errors.
- alert: ApacheHighErrorRate
  expr: rate(apache_http_requests_total{status=~"5.."}[5m]) > 0.02
  for: 5m
  labels:
    severity: critical
  annotations:
    description: "Apache 5xx error rate above 2% for 5 minutes"
2. High Latency
Track tail latency to catch performance degradation before users feel it.
- alert: ApacheHighLatency
  expr: histogram_quantile(0.95, rate(apache_request_duration_seconds_bucket[5m])) > 0.5
  for: 10m
  labels:
    severity: warning
  annotations:
    description: "95th percentile request latency exceeds 500ms"
3. Worker Saturation
Alert when Apache workers are running out, causing queuing and slowdowns.
- alert: ApacheWorkerSaturation
  expr: apache_scoreboard_busy_workers / (apache_scoreboard_busy_workers + apache_scoreboard_idle_workers) > 0.8
  for: 5m
  labels:
    severity: warning
  annotations:
    description: "Apache BusyWorkers > 80% of capacity for 5 minutes"
Why Use CubeAPM for Apache HTTP Server Monitoring?
Monitoring Apache with CubeAPM goes beyond collecting surface-level metrics — it’s about giving teams deep, actionable insights with predictable costs and enterprise-ready features. Here’s why CubeAPM is the best fit for Apache workloads:

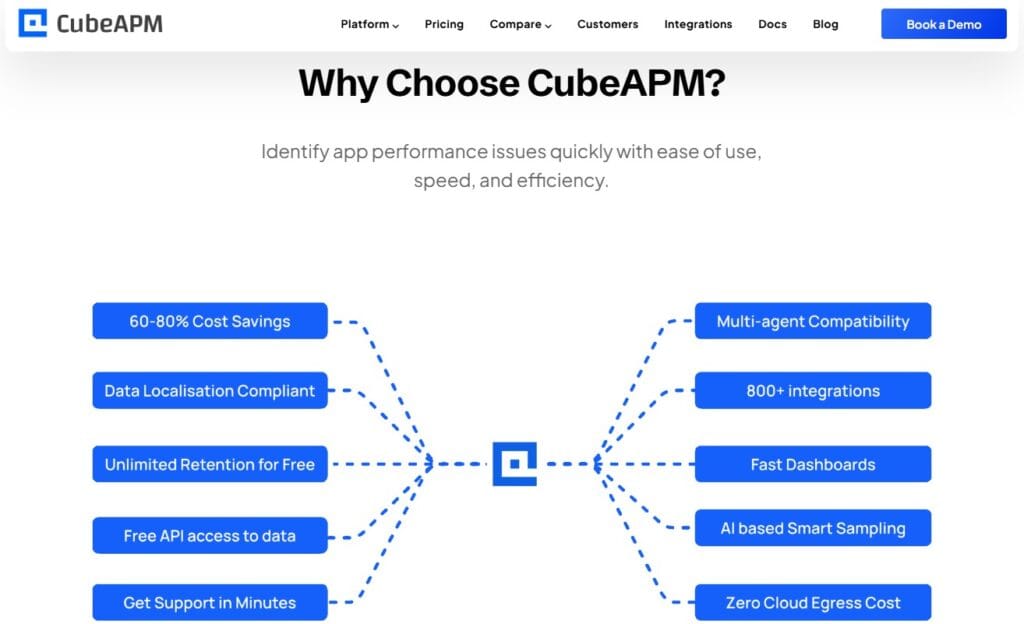
- Transparent pricing ($0.15/GB, no egress fees): Unlike legacy tools that charge hidden fees for data transfer or retention, CubeAPM keeps pricing simple and predictable. This is especially important for Apache environments generating terabytes of logs and metrics each month.
- Smart Sampling for high-volume environments: CubeAPM’s Smart Sampling captures the most valuable traces (slow requests, errors, anomalies) while filtering out noise. This means you can monitor Apache at 10TB+/month ingestion scale without runaway costs or losing critical insights.
- 800+ integrations, including Apache, MySQL, PHP, Kubernetes: Apache rarely runs alone — it fronts PHP apps, proxies to MySQL databases, or sits inside Kubernetes clusters. CubeAPM natively integrates across the stack, giving you a single pane of glass for correlated troubleshooting.
- Deploy anywhere (SaaS or BYOC, GDPR/HIPAA-ready): For teams in regulated industries, CubeAPM supports Bring Your Own Cloud (BYOC) deployment, ensuring Apache logs and metrics stay within your environment to meet GDPR, HIPAA, or India DPDP compliance.
- Proven case studies across industries: From e-commerce platforms handling Black Friday traffic to streaming services delivering live sports, CubeAPM has been tested under some of the highest-demand Apache workloads — reducing MTTR from hours to minutes and cutting monitoring costs by over 60%.
Conclusion
Monitoring Apache HTTP Servers is no longer optional — it’s essential for ensuring uptime, fast response times, and a secure user experience. With Apache powering a quarter of the world’s websites, the stakes are high: even minor slowdowns can ripple into customer dissatisfaction and revenue loss.
CubeAPM brings together metrics, logs, traces, and error tracking to give full-stack visibility into Apache workloads. Its OpenTelemetry-native design, Smart Sampling, and 800+ integrations mean you can monitor Apache in real time without skyrocketing costs or compliance risks.
By adopting CubeAPM, businesses cut MTTR, improve reliability, and keep monitoring costs predictable. Start monitoring Apache HTTP Server today with CubeAPM — book a free demo and experience observability built for scale.
Disclaimer: The information in this article reflects the latest details available at the time of publication and may change as technologies and products evolve.
FAQs
1. How do I enable real-time monitoring for Apache without restarting the server?
You can enable mod_status with the ExtendedStatus On directive and expose /server-status without requiring a full restart. For log-based monitoring, tools like CubeAPM ingest logs continuously, so changes in pipelines don’t interrupt the server.
2. What security risks should I watch when exposing Apache monitoring endpoints?
If /server-status is exposed publicly, attackers can see active connections and server load. Always restrict access with IP whitelists, authentication, or by proxying the endpoint through a secure monitoring agent.
3. Can CubeAPM monitor Apache running inside Docker or Kubernetes?
Yes, CubeAPM integrates with containerized environments. By deploying its OpenTelemetry collectors, you can capture Apache logs, metrics, and traces directly from pods or Docker containers.
4. How frequently should I check Apache logs for anomalies?
In high-traffic environments, logs should be monitored continuously. Tools like CubeAPM parse logs in real time and trigger alerts for spikes in 4xx/5xx errors, suspicious IPs, or unusual traffic patterns.
5. What’s the difference between monitoring Apache with native tools vs. an observability platform?
Native tools like mod_status provide basic stats (requests/sec, workers). An observability platform like CubeAPM correlates these with infrastructure metrics, distributed traces, and application logs, giving context on whether issues originate in Apache, the network, or an upstream service.


