Nginx monitoring tools are more crucial than ever: as of March 2025, Nginx added 5.1 million new sites in a single month, boosting its overall web server share to 20.5% and making it one of the fastest-growing platforms in the space.
The challenge is that most monitoring vendors bring unpredictable costs and fragmented coverage. By late 2025, teams cite steep per-host and per-GB fees, hidden charges for retention, and limited correlation between Nginx logs, traces, and infra health—making tool selection complex and risky.
CubeAPM is the best Nginx monitoring tool provider, offering OpenTelemetry-native tracing, smart sampling, unified observability, and self-hosting options at predictable pricing. In this article, we’ll break down the top Nginx monitoring tools, their features, pricing, and best use cases.
Top 8 Nginx Monitoring Tools in 2025
- CubeAPM
- Datadog
- New Relic
- Dynatrace
- NGINX Amplify
- Sematext
- ManageEngine Applications Manager
- AppDynamics
What is an Nginx Monitoring Tool?
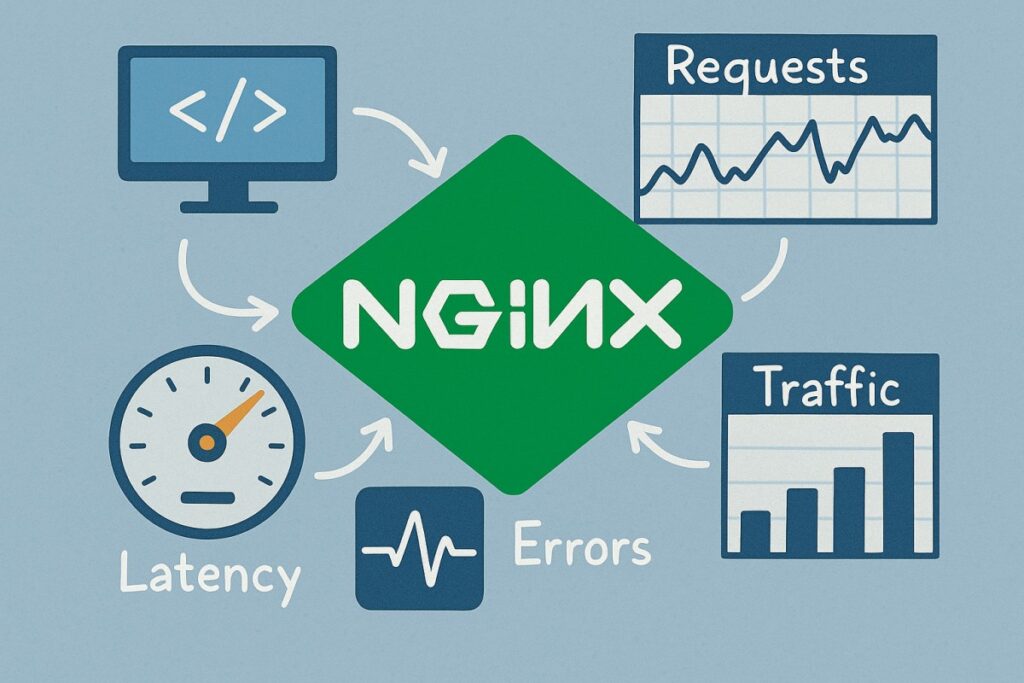
An Nginx monitoring tool is a platform that collects, analyzes, and correlates data from Nginx access logs, error logs, and performance metrics to provide real-time visibility into how the web server behaves under load. Instead of simply reporting whether Nginx is up or down, these tools surface deeper insights like latency patterns, SSL handshake errors, upstream response times, and 5xx failure rates—enabling teams to trace performance bottlenecks back to their root causes.
For modern businesses, Nginx monitoring is vital because it ensures faster detection of errors, reduces mean time to resolution by correlating Nginx data with backend traces, optimizes load-balancing efficiency across upstream servers, and maintains compliance-ready observability in regulated workloads. In practice, this translates into higher uptime, smoother customer experiences, and cost savings from proactive incident management.
Example: Streaming interruptions in media platforms with CubeAPM
Take a video streaming service where users begin experiencing buffering and playback failures during live sports events. With CubeAPM, operators can correlate spikes in Nginx errors (eg, 504 gateway errors) with CPU saturation on specific edge servers via its infrastructure monitoring module.
Real User Monitoring highlights that stream quality dropped in certain geographies, while synthetic monitoring replicates the buffering issue across test devices. Using smart sampling, CubeAPM preserves the problematic error traces, showing that traffic was unevenly distributed to a single overloaded edge node. Engineers rebalance the load and resolve the interruptions in real time, restoring seamless playback for viewers.
Why Teams Choose Different Nginx Monitoring Tools
Cost Predictability with High-Volume Nginx Logs
Nginx generates massive volumes of access and error logs, which can make costs spiral. Legacy vendors often bill separately for hosts, log ingestion, indexing, and retention, creating unpredictable monthly spend. Reviews on G2 and reports like the Signoz pricing analysis show how Nginx-heavy workloads often trigger bill shock at scale.
OpenTelemetry-First Instrumentation for Nginx
Nginx provides an official OpenTelemetry module that exports spans, metrics, and logs using W3C trace context. By 2025, many teams prefer tools that natively ingest OTel data for flexibility and vendor neutrality. This ensures Nginx telemetry can move seamlessly across observability backends.
Deep Correlation Between Logs, Metrics, and Traces
Diagnosing Nginx issues depends on variables like $upstream_response_time and $request_time. Modern tools that link these fields to infrastructure metrics and distributed traces offer faster root-cause analysis. Alerting on 502/504 surges or TLS handshake failures helps teams catch problems early.
Kubernetes & Multi-Cloud Readiness
Nginx is the default ingress controller in Kubernetes, handling traffic across AWS, Azure, and GCP. Teams want monitoring that auto-discovers ingress pods, scrapes /metrics, and maps requests to services. Official Ingress-NGINX and AKS docs recommend Prometheus exporters, but enterprises prefer tools that provide this natively.
Data Residency & Compliance Needs
Because Nginx logs often include IPs, headers, and session data, regulated industries demand strict data control. Finance, healthcare, and public-sector teams favor tools deployable in their own cloud or on-prem. This ensures compliance with GDPR, HIPAA, and India DPDP while keeping telemetry in-region.
Top 8 Nginx Monitoring Tools in 2025
1. CubeAPM
Overview
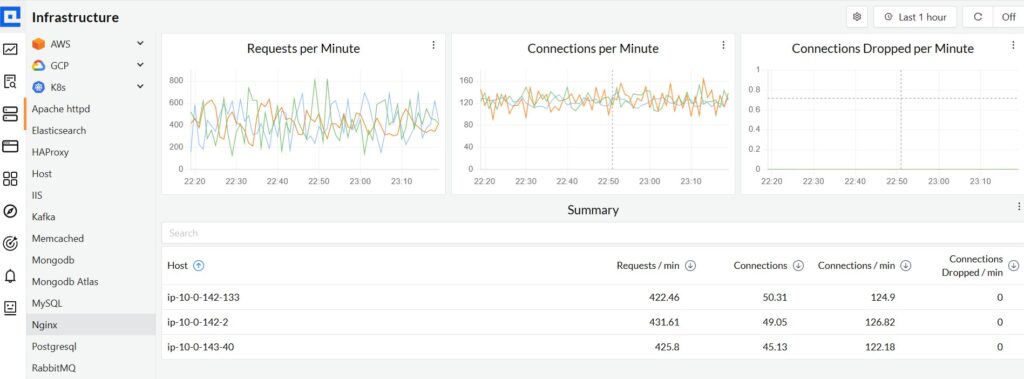
CubeAPM is positioned as a modern observability platform designed for teams that run high-traffic workloads on Nginx. Known for its strong OpenTelemetry-first design and cost efficiency, it offers a single place to monitor Nginx logs, upstream performance, request latency, and error rates. With 800+ integrations and on-premise deployment options, CubeAPM appeals to enterprises that demand deep visibility into Nginx while staying compliant with data residency and governance requirements.
Key Advantage
Smart Sampling technology that prioritizes error and latency-heavy Nginx traces, helping teams capture the most critical data without ballooning storage costs.
Key Features
- Nginx Log Monitoring: Collects, parses, and correlates access and error logs with upstream and application context.
- Upstream Latency Tracking: Captures $upstream_response_time and $request_time to pinpoint slow backends.
- Error Spike Detection: Alerts on surges in 502/504 gateway errors, TLS failures, or timeouts.
- Real User Monitoring: Connects Nginx behavior to end-user experience across geographies.
- Synthetic Monitoring: Continuously tests Nginx endpoints for performance, SSL validity, and uptime.
Pros
- Predictable pricing with no hidden fees
- Unified logs, metrics, and traces for faster Nginx troubleshooting
- Strong support for OpenTelemetry and Prometheus
- Quick time-to-value with 1-hour setup
Cons
- Less ideal for teams that prefer purely off-prem deployments
- Focused on observability only, without built-in cloud security management
CubeAPM Pricing at Scale
CubeAPM uses a transparent pricing model of $0.15 per GB ingested. For a mid-sized business generating 45 TB (~45,000 GB) of data per month, the monthly cost would be ~$7,200/month*.
*All pricing comparisons are calculated using standardized Small/Medium/Large team profiles defined in our internal benchmarking sheet, based on fixed log, metrics, trace, and retention assumptions. Actual pricing may vary by usage, region, and plan structure. Please confirm current pricing with each vendor.
Tech Fit
CubeAPM is strong for Nginx workloads running in Kubernetes, multi-cloud, and on-prem environments. It integrates seamlessly with Java, .NET, Node.js, Python, Go, PHP, and Ruby applications behind Nginx, ensuring both edge traffic and backend services are monitored together.
2. Datadog
Overview
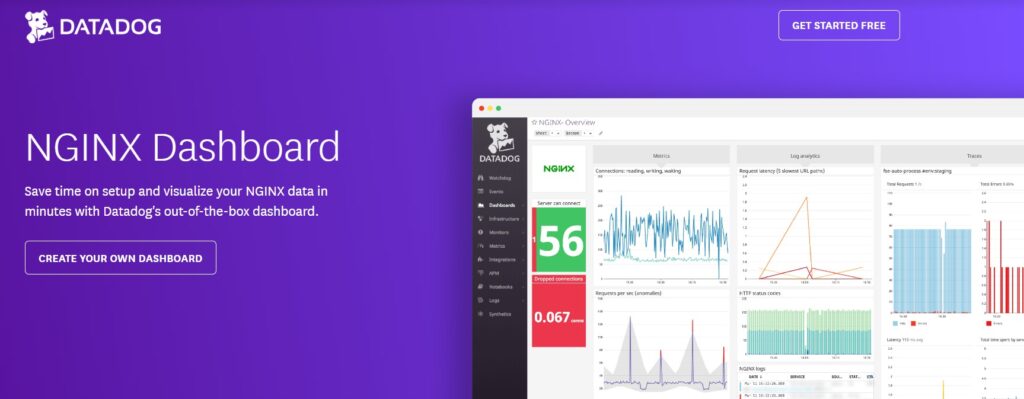
Datadog is a popular all-in-one observability platform with a mature Nginx integration: it pulls core Nginx/NGINX Plus metrics, parses access and error logs, ships an opinionated NGINX dashboard, and can trace requests through Nginx via the Datadog NGINX module—plus first-class coverage for the Kubernetes NGINX Ingress Controller. That end-to-end path (metrics → logs → traces) is why many teams shortlist Datadog for Nginx-centric stacks.
Key Advantage
Integrated, Nginx-specific coverage—from status metrics and curated dashboards to ingress controller monitoring and Nginx request tracing—so you can move from a 5xx spike to the exact upstream or code path in one workflow.
Key Features
- Nginx & NGINX Plus metrics: Collects connections, requests, states, and (with Plus) upstream/caching internals for performance and capacity views.
- Kubernetes Ingress monitoring: Built-in check for the NGINX Ingress Controller with autodiscovery and Prometheus-sourced metrics.
- Nginx request tracing: ngx_http_datadog_module adds distributed traces at the proxy layer and supports App & API Protection.
- Log collection & pipelines: Parses access/error logs and routes them into dashboards and alerts for real-time troubleshooting.
- Prebuilt NGINX dashboard: Opinionated graphs for Writing/Waiting states, throughput, errors, and latency, ready in minutes.
Pros
- Mature Nginx integration with out-of-the-box dashboards and guides
- Strong Kubernetes ingress coverage and service correlation
- Broad ecosystem to pivot across infra, APM, logs, and security
- Granular log pipelines and controls for high-volume traffic
Cons
- Pricing can become complex with hosts, log ingestion, indexing, and APM components
- SaaS-only platform; no self-hosting
Datadog Pricing at Scale
Datadog charges differently for different capabilities. APM starts at $31/month; infra starts at $15/month; logs start at $0.10/GB, and so on. For a mid-sized business ingesting around 45 TB (~45,000 GB) of data per month, the cost would come around $27,475/month.
Tech Fit
Best for Nginx fronting microservices on Kubernetes and multi-cloud. Strong with NGINX Ingress Controller, NGINX Plus estates, and stacks that want proxy-layer tracing; pairs well with app tiers in Java, .NET, Node.js, Python, Go, PHP, and Ruby behind Nginx.
3. New Relic
Overview
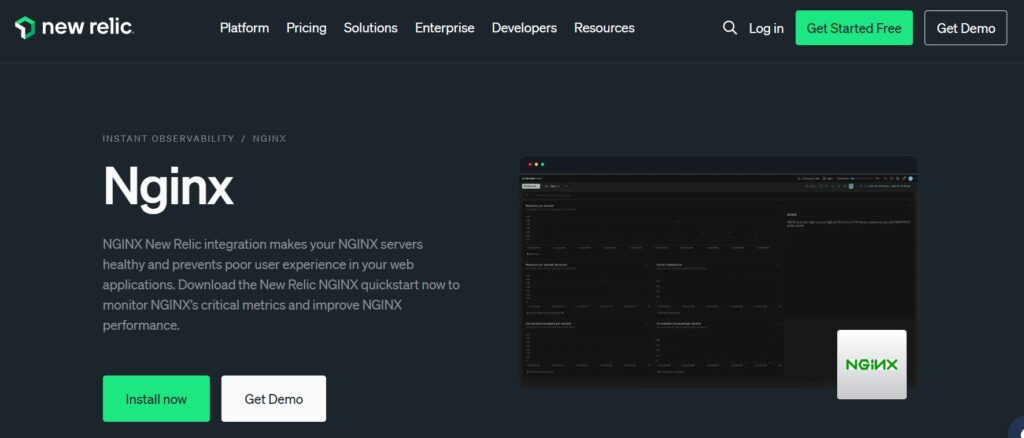
New Relic is a well-known observability platform with a mature Nginx integration that pulls metrics from stub_status/NGINX Plus APIs, parses access and error logs, and ships an opinionated Nginx dashboard and quickstart. It also covers the Kubernetes NGINX Ingress Controller via Prometheus, giving teams a clear path from a spike in 5xx to the ingress, route, or upstream at fault.
Key Advantage
An end-to-end Nginx view—metrics, logs, and ingress signals—already wired into New Relic’s dashboards and alerting, so you can pivot quickly from symptoms to the exact misbehaving upstream, certificate, or config change.
Key Features
- Nginx metrics & inventory: Collects active/idle connections, requests/sec, reading/writing/waiting states, and NGINX Plus SSL handshake stats with config inventory.
- Nginx log ingestion: Parses access/error logs to correlate error surges and latency with server state for faster RCA.
- Ingress controller monitoring: Prometheus-backed quickstart with dashboards and alerts for config reload errors, throughput, payload size, and latency.
- Prebuilt Nginx dashboard: Ready-made visualization for connections, dropped/accepted connections, and request rates to start monitoring in minutes.
- Cross-environment support: Works with Nginx on VMs/containers, Kubernetes, and NGINX Plus estates.
Pros
- Mature, documented Nginx integration with open-source nri-nginx
- Quickstart dashboard and curated queries for Nginx and NGINX Plus
- Native coverage for NGINX Ingress Controller via Prometheus
- Strong ecosystem to pivot into APM, RUM, synthetics, and alerts
Cons
- Data ingest plus per-user pricing can add up at higher log volumes
- SaaS-only deployment; no option for self-hosting or on-prem
New Relic Pricing at Scale
New Relic’s billing is based on data ingested, user licenses, and optional add-ons. The free tier offers 100 GB of ingest per month, then it costs $0.40 per GB after that. For a business ingesting 45 TB of logs per month, the cost would come around $25,990/month.
Tech Fit
A strong fit for teams running Nginx or NGINX Plus across Kubernetes and multi-cloud—especially where Prometheus is already present for ingress metrics—and for stacks that want to tie Nginx signals to app traces, RUM, and synthetics in one place.
4. Dynatrace
Overview
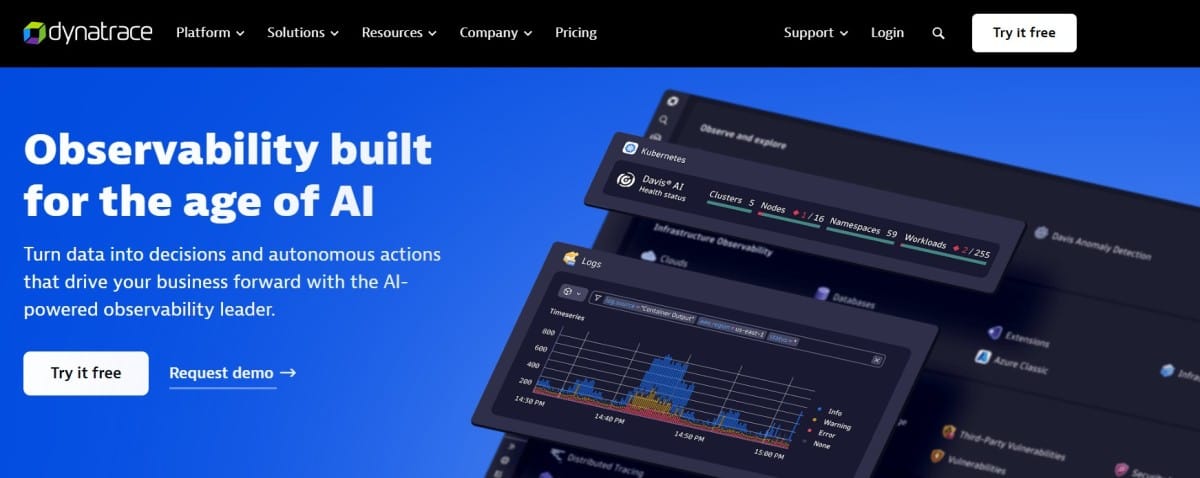
Dynatrace is an enterprise observability platform that goes deep on Nginx and NGINX Plus: the OneAgent Nginx code module surfaces request/connection metrics, response-size trends, and even Plus-specific internals like server zones, upstream health, and cache usage—then ties them to cross-tier dependencies using Davis AI. It also documents instrumentation for the Kubernetes NGINX Ingress Controller and runtime options for patched Nginx builds, making it a frequent shortlist pick for complex estates.
Key Advantage
Automatic Nginx/NGINX Plus code-module instrumentation that correlates proxy-layer signals (requests, connections, upstreams, caches) with downstream services for rapid, Davis-assisted root cause.
Key Features
- Nginx HTTP & Plus metrics: Requests/response sizes, connection states, server zones, upstream health, cache performance, and usage.
- Ingress-NGINX instrumentation: Guide to load the Nginx module via ConfigMap; Operator-based deployment and auto-discovery in K8s.
- Process hotspots: Module-level response-time analysis to pinpoint where time is spent inside Nginx.
- Runtime instrumentation (patched builds): Option to force runtime instrumentation for custom/third-party Nginx (e.g., Kong), with guardrails.
- Version coverage & limits: Current Nginx/Plus versions called out, with note that deep monitoring isn’t supported on Windows.
Pros
- Deep Nginx and NGINX Plus telemetry, including upstreams, server zones, and caches
- Davis AI for automatic problem detection and cross-tier correlation
- Strong Kubernetes story with Operator and documented ingress-nginx setup
- Flexible Grail pricing choices for log retention and query behavior
Cons
- Pricing model mixes ingest, retain, query, and host monitoring, which can be complex
- Steep learning curve, especially for beginners
Dynatrace Pricing at Scale
- Full stack: $0.01/8 GiB hour/month or $58/month/8GiB host
- Log Ingest & process: $0.20 per GiB
For a similar 45 TB (~45,000 GB/month) volume, the cost would be $21,850/month.
Tech Fit
Best for large Nginx/NGINX Plus estates in Kubernetes and multi-cloud that need Davis-assisted correlation and detailed upstream/cache insights; pairs well with services in Java, .NET, Node.js, Python, Go, PHP, and Ruby behind Nginx, and with environments that can run OneAgent for module-level visibility.
5. NGINX Amplify
Overview
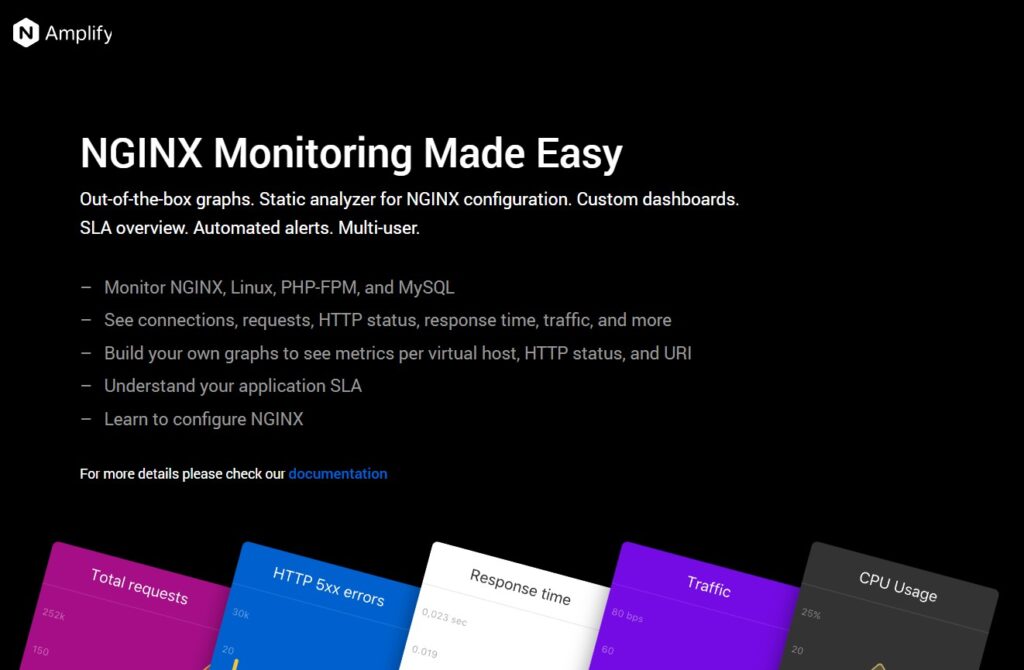
NGINX Amplify is a lightweight, Nginx-specific monitoring SaaS from F5/NGINX that installs an agent, auto-detects Nginx instances on a host, and streams server health, connection states, and configuration insights to a hosted console—useful when you want a narrowly focused Nginx view without a full APM stack.
Key Advantage
Nginx-first telemetry and config analysis out of the box—so you get meaningful Nginx metrics and “is my config sane?” checks without wiring up a broader observability platform.
Key Features
- Auto-discovery of Nginx instances: The agent detects all unique Nginx processes per host and tracks each separately.
- Nginx metrics inventory: Requests, connections, reading/writing/waiting states, upstream/cache-related metrics (where available).
- Config & log format guidance: Prompts to add fields in access logs to unlock richer graphs and alerts.
- System context: Host CPU, memory, filesystem, and package metadata alongside Nginx metrics for quick triage.
- Hosted UI & quick graphs: Web console with predefined graphs and simple alerting flows.
Pros
- Purpose-built for Nginx with minimal setup
- Agent auto-discovers multiple instances per host
- Helpful config hygiene checks and log-format tips
- Zero heavy pipeline work to get basic Nginx visibility
Cons
- Nginx-centric only; not a full logs-metrics-traces platform
- Roadmap and enterprise-grade features are lean versus broader observability tools
NGINX Amplify Pricing at Scale
Amplify itself is offered as a free SaaS for monitoring Nginx, so there’s no per-GB ingest fee from Amplify for your telemetry. If you run NGINXaaS for Azure, Azure bills the management traffic used to ship metrics and logs: roughly $0.03/month for metrics and about $0.005 per GB of logs generated. Also, the support ends on 31st January, 2026.
Tech Fit
Well-suited to Linux VMs and containers running Nginx OSS or NGINX Plus, where you want quick visibility, basic alerts, and config sanity checks without deploying a full observability platform. Commonly paired with Prometheus/Grafana or a log backend if you later need long-term search, tracing, or broader app/infrastructure correlation.
6. Sematext
Overview
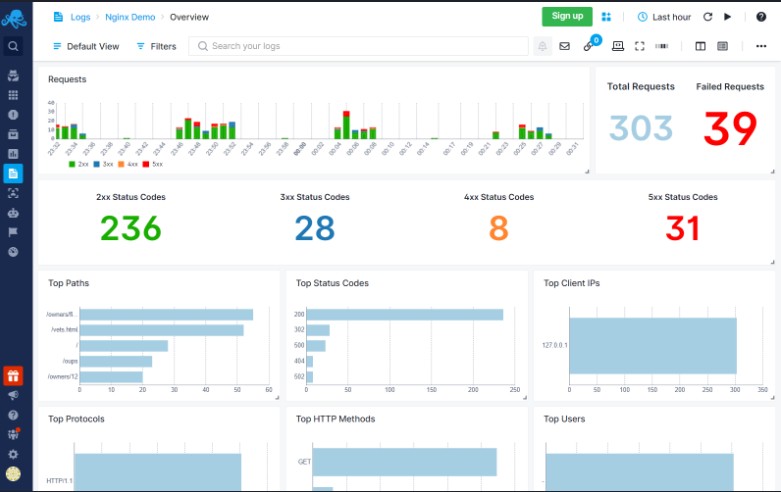
Sematext combines Nginx metrics, logs, and alerting in one SaaS, with an agent that auto-discovers Nginx services and ships access/error logs plus stub_status/NGINX Plus metrics into ready-made dashboards. It’s popular with teams that want quick, clean Nginx visibility and log search without standing up their own ELK or Prometheus stack.
Key Advantage
Easy Nginx onboarding and correlation—agent discovery, prebuilt Nginx dashboards, and log search in minutes, so you can move from a spike in 5xx to the exact URI, upstream, or pod fast.
Key Features
- Nginx metrics via stub_status/Plus: Active/idle connections, reading/writing/waiting, requests/sec, upstream/cache insights for NGINX Plus.
- Nginx log parsing: Ingests access and error logs with field extraction for fast search, charts, and alerts.
- Ingress-NGINX & containers: Auto-discovery on Kubernetes/Docker; streamlined shipping for NGINX Ingress logs.
- Out-of-the-box dashboards & alerts: Curated Nginx views and anomaly/threshold alerts to catch regressions quickly.
- Logs ↔ metrics correlation: Jump between spikes in error/latency and the underlying Nginx/server signals.
Pros
- Simple setup with service auto-discovery
- Solid Nginx dashboards and alerting out of the box
- Good log search and pipelines for cost trimming
- No per-host fees for logs; volume-based billing
Cons
- SaaS only; on-prem/self-hosted option not available for Sematext Cloud
- Stored-data pricing can dominate costs at long retention
Sematext Pricing at Scale
Sematext bills logs received at $0.10/GB, so 45 TB/month ≈ $4,500 just for ingestion. Stored-data cost depends on plan and retention: at roughly $1.56–$1.90 per GB. For long-term retention, the costs are substantial.
Tech Fit
Great fit for teams running Nginx/NGINX Plus on Kubernetes or VMs who want fast time-to-value, strong log search, and practical Nginx dashboards without operating their own observability stack. Works well alongside app tiers behind Nginx (Java, .NET, Node.js, Python, Go, PHP, Ruby) and common container/orchestrator setups.
7. ManageEngine Applications Manager
Overview
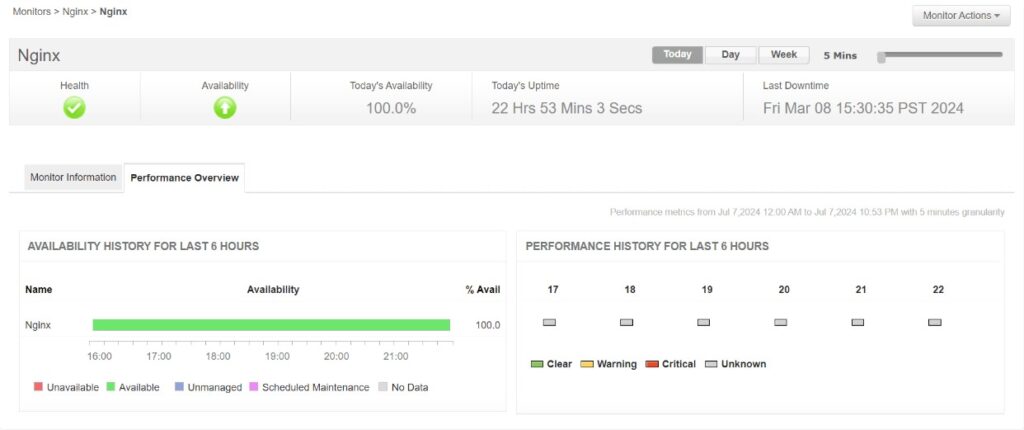
ManageEngine Applications Manager (APM) provides a purpose-built Nginx monitor that tracks request/connection rates, reading/writing/waiting states, and—when you run NGINX Plus—upstreams, server zones, cache behavior, and SSL/TCP stats. It fits teams that want Nginx and NGINX Plus performance metrics tied into broader server/app monitoring, with options to visualize Prometheus-scraped Nginx metrics inside APM.
Key Advantage
Deep Nginx/NGINX Plus metrics (including upstreams, server zones, and cache stats) in a single monitor, with threshold-based alerting and reports that slot into the wider Applications Manager stack.
Key Features
- Core Nginx metrics: Active/idle connections, requests/sec, reading/writing/waiting states for quick capacity and health checks.
- NGINX Plus internals: Upstream health, server zones, cache hits/misses, SSL/TCP session views for deeper troubleshooting.
- Alerting & reports: Thresholds on request/connection spikes and status-code patterns, with historical reports for trend analysis.
- Prometheus integration: Ingest Nginx metrics already scraped by Prometheus and visualize them in APM.
Pros
- Strong coverage for Nginx and NGINX Plus metrics
- Works alongside server, DB, and application monitors in one tool
- Option to view Prometheus-scraped Nginx metrics inside the platform
- On-premises deployment and enterprise-style administration
Cons
- Limited features and customization
- Can be complex to set up for new users
Applications Manager Pricing at Scale
ManageEngine lists Applications Manager pricing as quote-based on its official site. Costs vary by edition (Professional or Enterprise), the number of monitors you license (each Nginx server counts as one), and whether you add APM Insight agents for language-specific visibility. There is no per-GB pricing model for logs. If you need to manage large-scale log ingestion, you’d typically pair it with a separate backend.
Tech Fit
Best for teams running Nginx or NGINX Plus on VMs or Kubernetes that want metric-centric visibility, alerting, and reporting inside an on-prem/enterprise monitoring suite. Works well if you already use Applications Manager for servers, databases, and application availability, and want to add Nginx/NGINX Plus without adopting a new platform.
8. AppDynamics
Overview
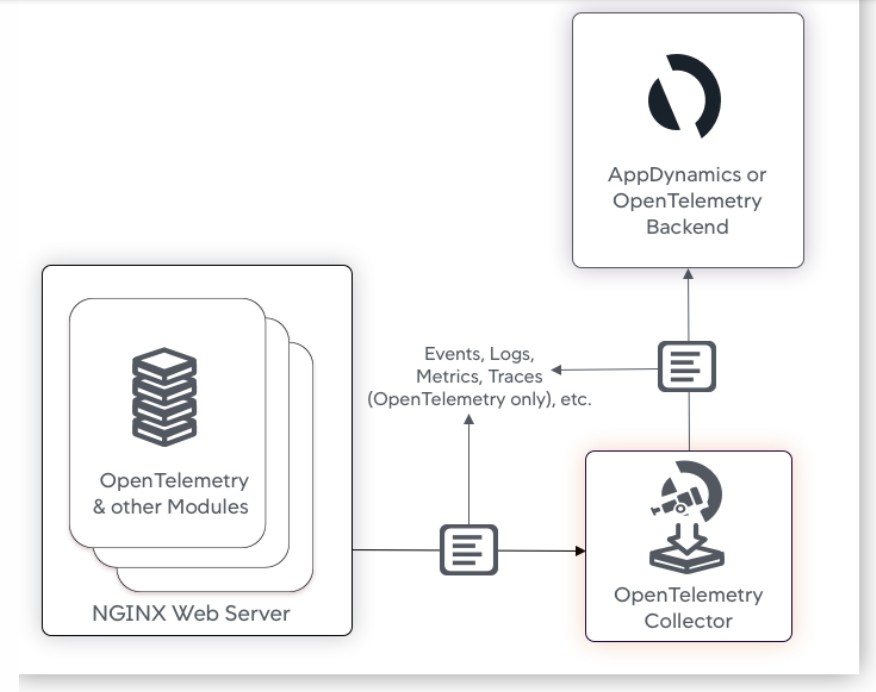
AppDynamics provides a dedicated NGINX Web Server Agent that instruments Nginx and reverse-proxy tiers, capturing request and connection telemetry at the edge and linking it to downstream services. The agent is based on the OpenTelemetry web-server module, so you can propagate W3C trace context through Nginx and pivot from a 5xx spike at the proxy to the exact service or database call behind it—useful in Nginx-heavy, microservices environments.
Key Advantage
Proxy-layer visibility with OTel-based edge tracing—so Nginx traffic, errors, and slow routes tie directly into AppDynamics’ service maps, baselines, and troubleshooting workflows.
Key Features
- Nginx status metrics: Active/accepted/handled connections, requests per second, and reading/writing/waiting states for capacity and health tracking.
- Edge tracing via OTel module: Injects and forwards W3C trace context at the proxy, enabling end-to-end traces that include Nginx spans.
- Upstream/error visibility: Surface upstream response anomalies and 4xx/5xx patterns to isolate bad backends and misconfigurations.
- Kubernetes & containers support: Run the Nginx agent alongside AppDynamics agents to correlate ingress/proxy tiers with services in K8s.
- Log analytics add-on: Optional ingestion of Nginx access/error logs for search, alerting, and investigations within AppDynamics Analytics.
Pros
- Strong proxy-layer tracing that links Nginx to downstream services
- Familiar AppDynamics service maps, baselines, and health rules
- Works across VMs, containers, and Kubernetes estates
- OpenTelemetry-aligned approach for edge instrumentation
Cons
- Licensing and module mix can be complex to size for large estates
AppDynamics Pricing at Scale
AppDynamics licenses core APM capabilities by environment resources (for example, CPU cores) and offers Analytics as an add-on. Pricing isn’t per-GB of logs, so handling 10 TB/month of Nginx data hinges on your Analytics capacity and retention. A common entitlement includes 100 GB/day of Analytics data with short default retention.
Tech Fit
A good match for Nginx-fronted microservices where you already standardize on AppDynamics for APM and want proxy-layer traces tied into the same service maps and health rules. Works well across multi-cloud and Kubernetes estates that can deploy the Nginx agent alongside application agents for full path visibility.
How to choose the right Nginx Monitoring Tool
Deployment & Edge Integration
Look for tools that auto-discover Nginx instances or ingress controllers and capture key metrics like connections, waiting states, and upstream response times without heavy manual setup.
Trace & Request Correlation
The right solution should tie Nginx status codes, TLS failures, or $upstream_response_time directly to backend traces, so you can diagnose 5xx errors in context.
Log + Metrics + Alerts
Nginx problems often show up in both logs and metrics. Unified ingestion with anomaly detection and noise-reduced alerting is critical for rapid triage.
Cost Model for High Throughput
Because Nginx can generate massive traffic logs, pick a tool with transparent, predictable pricing that scales without punishing traffic spikes.
Kubernetes & Multi-Cloud Support
Enterprises running Nginx ingress in Kubernetes or multi-cloud should choose tools that support dynamic discovery, controller metrics, and cluster context mapping.
Compliance & Data Residency
If your logs contain sensitive request headers or IP data, make sure the platform supports self-hosted or region-restricted deployments to meet compliance needs.
Conclusion
Enterprises evaluating Nginx monitoring tools often face the same hurdles—pricing models that spiral with traffic spikes, platforms that separate logs and metrics, and solutions that fall short in multi-cloud or Kubernetes ingress scenarios. These gaps make it difficult to achieve reliable, cost-efficient observability at scale.
CubeAPM addresses these pain points with an OpenTelemetry-native design, $0.15/GB transparent pricing, and full coverage of Nginx metrics, logs, traces, and alerts in one place. Whether you’re monitoring Nginx OSS or NGINX Plus, CubeAPM simplifies correlation and keeps costs predictable.
Get a free demo to explore CubeAPM.
Disclaimer: The information in this article reflects the latest details available at the time of publication and may change as technologies and products evolve.
FAQs
1. What are the most common issues Nginx monitoring tools help detect?
They help identify spikes in 4xx/5xx errors, upstream timeouts, SSL handshake failures, slow response times, and sudden drops in throughput.
2. Do Nginx monitoring tools also support real-time alerting?
Yes, most tools provide threshold-based and anomaly-based alerts. CubeAPM, for example, detects sudden 502/504 surges and notifies teams instantly.
3. Can Nginx monitoring tools capture user experience directly?
Some can. Tools with real user monitoring (RUM) and synthetic tests link Nginx behavior to actual end-user impact. CubeAPM includes both features out of the box.
4. Is it possible to run Nginx monitoring on-premises for compliance reasons?
Yes, several vendors support on-prem deployments or BYOC models. CubeAPM offers self-hosted and region-specific deployments to meet data residency requirements.
5. How do Nginx monitoring tools integrate with modern CI/CD pipelines?
They plug into deployment workflows, offering dashboards and alerts during rollouts. This helps teams catch misconfigurations or regressions in Nginx before they reach production.


