










OpenTelemetry and Prometheus are both open-source CNCF projects used in observability stacks, but they operate at completely different layers. OpenTelemetry is an instrumentation and collection framework. Prometheus is a metrics storage and alerting system. The confusion is understandable because they overlap in one area (metrics collection), but that overlap does not make them alternatives. Most production teams use both.
The relationship has also changed significantly with Prometheus 3.0 (November 2024, now at v3.11.3 as of April 27, 2026). Prometheus can now natively ingest OTLP metrics, accept UTF-8 metric names matching OTel semantic conventions without translation, and store native histograms as a stable feature from v3.8.0 (November 28, 2025). The boundary between the two tools is narrower than it was two years ago. This guide compares OpenTelemetry vs Prometheus and what each tool actually does, where they still differ, and how to use them together.
Key Takeaways
- OpenTelemetry is an instrumentation framework: it generates, collects, and exports traces, metrics, and logs. It does not store or query anything
- Prometheus is a time-series database with a pull-based collector, a query language (PromQL), and a built-in alerting system. It handles metrics only
- The fundamental architectural difference is direction: OpenTelemetry pushes data to backends via OTLP. Prometheus pulls data by scraping HTTP endpoints
- Prometheus 3.0 introduced native OTLP ingestion at /api/v1/otlp/v1/metrics, UTF-8 metric name support (OTel dots no longer convert to underscores), native histograms (stable from v3.8.0, must be enabled per scrape config via scrape_native_histograms: true), and Remote Write 2.0. These changes make OTel-to-Prometheus pipelines significantly simpler
- OpenTelemetry replaces Prometheus client libraries for instrumentation but does not replace the Prometheus server for storage and querying
- The standard production pattern is: instrument with OTel SDKs, route through the OTel Collector, and send metrics to Prometheus for storage and alerting while sending traces and logs to their respective backends
What Each Tool Does
OpenTelemetry
OpenTelemetry provides APIs, SDKs, and the Collector. It handles the instrumentation layer (what goes into your application code) and the transport layer (how data moves from applications to backends). It covers all three signals: traces, metrics, and logs.
What OpenTelemetry does not do: it has no storage engine, no query language, no alerting system, and no dashboard. It is a pipeline, not a platform.
Prometheus
Prometheus is a time-series database with its own collection mechanism. It scrapes metrics from HTTP endpoints (your application, exporters, or the OTel Collector) at a configured interval, stores them in its local TSDB, and evaluates alerting rules via PromQL. Grafana queries Prometheus via PromQL to build dashboards.
What Prometheus does not do: it handles only metrics. It has no concept of traces or logs. It cannot instrument application code.
The Core Differences
| OpenTelemetry | Prometheus | |
| What it is | Instrumentation and collection framework | Time-series database with collector and alerting |
| Signals supported | Traces, metrics, logs, profiling (beta) | Metrics only |
| Data direction | Push (application pushes OTLP to Collector or backend) | Pull (Prometheus scrapes HTTP endpoints on a schedule) |
| Storage | None (requires an external backend) | Built-in TSDB (local, not designed for long-term at scale) |
| Query language | None | PromQL |
| Alerting | None (requires an external system) | Built-in via Alertmanager |
| Instrumentation | Yes (APIs and SDKs for 11+ languages) | Via client libraries (separate from Prometheus server) |
| Vendor lock-in | None (vendor-neutral by design) | None (open source, but ecosystem is Prometheus-centric) |
| Latest version | SDK per language (all stable as of 2026) | v3.11.3 (April 27, 2026) |
The Key Architectural Difference: Push vs Pull
This is the most practically significant difference when wiring up a monitoring stack.
Prometheus pull model: Prometheus scrapes your application’s /metrics endpoint on a schedule. Your application must expose an HTTP endpoint in the Prometheus text format. Prometheus needs to know where every target is, via service discovery or static configuration.
scrape_configs:

  - job_name: my-app

    static_configs:

- targets: ['my-app:8080']OpenTelemetry push model: Your application SDK pushes telemetry data to the OTel Collector or directly to a backend via OTLP. The application initiates the connection. No endpoint needs to be exposed on the application side.
OTEL_EXPORTER_OTLP_ENDPOINT=http://collector:4317 \

OTEL_SERVICE_NAME=my-app \

java -javaagent:opentelemetry-javaagent.jar -jar app.jarNeither model is universally better. Pull works well for infrastructure monitoring where targets are stable and long-lived. Push works better for short-lived processes, serverless functions, and ephemeral Kubernetes pods that may not be alive long enough for Prometheus to scrape them.
The Metrics Overlap Zone
Both tools can collect metrics. This is where most of the confusion comes from.
- When you use a Prometheus client library (e.g., prometheus/client_java or prometheus/client_python), you are instrumenting your application for Prometheus specifically. The library exposes a /metrics endpoint in Prometheus text format.
- When you use the OTel SDK for metrics, you are instrumenting your application in a vendor-neutral way. The OTel SDK can export to Prometheus (via a Prometheus exporter that exposes a scrape endpoint) or push via OTLP to any compatible backend.
The OTel SDK is now the recommended approach for new instrumentation because it gives you metrics and traces from the same SDK, vendor-neutral export, and the ability to route to Prometheus, Datadog, or any other backend without re-instrumenting.
Prometheus client libraries are not going away. A large amount of existing instrumentation uses them, and they work well for metrics-only use cases. The OTel SDK is the better starting point for greenfield projects.
How Prometheus 3.x Changed the Picture
Before Prometheus 3.0, routing OTel metrics to Prometheus required the OTel Collector’s Prometheus exporter, which translated OTLP metric names by converting dots to underscores. An OTel metric named http.server.request.duration became http_server_request_duration in Prometheus, breaking the connection to OTel semantic conventions and making dashboards inconsistent.
Prometheus 3.0 (November 2024, now at v3.11.3) addressed this with three changes:
Native OTLP ingestion. Prometheus now accepts OTLP metrics directly at /api/v1/otlp/v1/metrics without the Collector as an intermediary. Enable it with the feature flag:
prometheus --enable-feature=otlp-write-receiverThen point your OTel SDK directly at Prometheus:
OTEL_EXPORTER_OTLP_PROTOCOL=http/protobuf \

OTEL_EXPORTER_OTLP_ENDPOINT=http://prometheus:9090The OTLP receiver is off by default because Prometheus has no authentication layer. Enabling it means any host that can reach Prometheus can write metrics. Secure it at the network layer before enabling in production.
UTF-8 metric names. Prometheus 3.0 added full UTF-8 support for metric and label names. OTel metrics with dots (e.g. http.server.request.duration) can now be stored and queried in Prometheus without name translation. This means OTel semantic conventions and Prometheus queries finally align.
Native histograms (stable from v3.8.0, released November 28, 2025). Native histogram scraping must be explicitly enabled per scrape config:
scrape_configs:

  - job_name: my-app

    scrape_native_histograms: true

    static_configs:

- targets: ['my-app:8080']From v3.9.0 onward (January 6, 2026), the old –enable-feature=native-histograms flag is a complete no-op. Use the scrape_native_histograms config setting instead. OTel histograms map to Prometheus native histograms, which are more space-efficient and do not require predefined bucket boundaries, removing one of the significant data fidelity gaps between the two systems.
How to Use Both Together
The standard production pattern as of 2026:
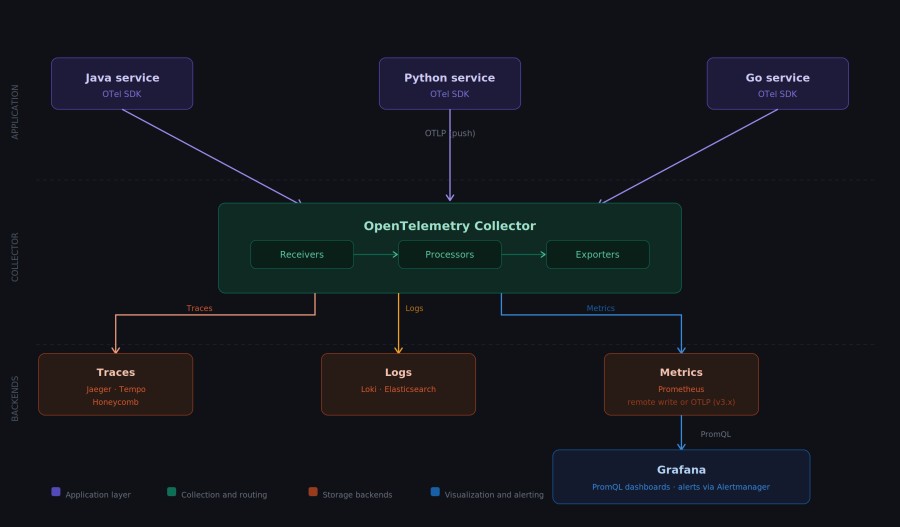
The Collector’s Prometheus remote write exporter pushes metrics to Prometheus. Alternatively, in Prometheus 3.x, the Collector can export via OTLP directly to Prometheus’s OTLP endpoint, preserving metric names without translation.
This gives you the best of both tools: OTel handles instrumentation across all signals and all languages, Prometheus handles metrics storage, PromQL, and alerting. Grafana queries Prometheus for metrics and queries Tempo or Jaeger for traces, with correlation via trace exemplars embedded in Prometheus metrics.
When to Use One vs the Other
| Situation | Recommendation |
| Greenfield project, new instrumentation | Start with OTel SDK. Route metrics to Prometheus, traces to Jaeger or Tempo |
| Existing Prometheus instrumentation working well | No need to migrate. The OTel Collector can scrape your existing Prometheus endpoints and forward to other backends |
| Need distributed tracing | OTel only. Prometheus has no tracing capability |
| Need log correlation with traces | OTel only. Prometheus has no logging capability |
| Metrics-only monitoring for infrastructure (nodes, exporters) | Prometheus pull model works well and has a large exporter ecosystem (Node Exporter, cAdvisor, etc.) |
| Short-lived processes or serverless | OTel push model. Prometheus pull may not scrape before the process exits |
| Need PromQL for alerting or dashboards | Keep Prometheus. PromQL is powerful and Grafana’s Prometheus integration is mature |
| Want to avoid re-instrumenting to switch backends | OTel. Write once, route anywhere |
Common Setup Problems When Using Both Together
| Problem | Cause | Fix |
| OTel metric names have dots but Prometheus shows underscores | Using Prometheus 2.x or the Prometheus exporter with default name translation | Upgrade to Prometheus 3.x and enable the OTLP receiver, or configure the Prometheus remote write exporter in the Collector to preserve UTF-8 names |
| OTLP receiver not accepting connections | Feature flag not enabled | Add –enable-feature=otlp-write-receiver to your Prometheus startup flags |
| Metrics appear in OTel Collector but not in Prometheus | Remote write exporter misconfigured, or Prometheus TSDB retention too short | Check the Collector exporter config and confirm –storage.tsdb.retention.time is set appropriately |
| Native histograms not appearing even after upgrading to v3.8+ | scrape_native_histograms not set in scrape config | Add scrape_native_histograms: true to each relevant scrape job. The old feature flag is a no-op from v3.9.0 onward |
| Duplicate metrics when running both OTel Collector scraper and Prometheus scraper on the same target | Both are scraping the same endpoint | Disable the Prometheus scrape job for targets already being scraped by the Collector, or consolidate scraping through the Collector only |
The Missing Layer: Correlating Metrics Alerts with Traces and Logs
Using OTel for instrumentation and Prometheus for metrics storage is a well-established pattern that many teams run successfully. The remaining gap is correlation: Prometheus holds your metrics, a separate backend holds your traces, and connecting a firing alert to the specific request trace that caused it requires jumping between tools.
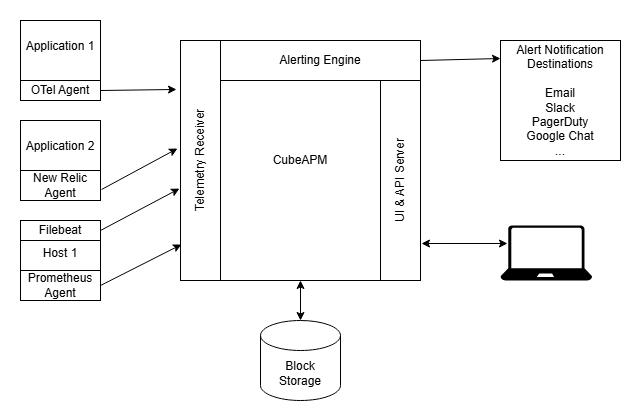
CubeAPM accepts OTLP directly from your existing OTel SDK or Collector and stores traces, metrics, and logs in one place. When an alert condition is met, you can move from the metric to the trace to the logs from the same request without switching tools. The shared context that OTel trace IDs provide across signals is what makes this possible. CubeAPM runs self-hosted inside your own infrastructure at $0.15/GB ingestion pricing, so no data leaves your environment.
Summary
OpenTelemetry and Prometheus solve different problems. OpenTelemetry handles instrumentation and transport across all three signals. Prometheus handles metrics storage, querying, and alerting. They are complementary, not competing. Prometheus 3.x has made the integration between them significantly cleaner through native OTLP ingestion, UTF-8 metric names, and native histograms that must be explicitly enabled per scrape job from v3.8.0 onward.
| OpenTelemetry | Prometheus | |
| Primary role | Instrumentation and collection | Metrics storage and alerting |
| Signals | Traces, metrics, logs | Metrics only |
| Data direction | Push (OTLP) | Pull (HTTP scrape) |
| Storage | None | Built-in TSDB |
| Query language | None | PromQL |
| Alerting | None | Yes, via Alertmanager |
| Latest version | Stable across all major languages (2026) | v3.11.3 (April 27, 2026) |
| Instrumentation | Yes, 11+ languages | Via separate client libraries |
| Use together | Yes. OTel for instrumentation, Prometheus for metrics storage and alerting | Yes. Accepts OTel metrics via OTLP receiver (Prometheus 3.x) or remote write |
Disclaimer: Version numbers, feature flags, and integration details are verified against Prometheus 3.x release notes (prometheus.io/blog/2024/11/14/prometheus-3-0), the Prometheus GitHub releases page (latest v3.11.3, April 27, 2026), the Prometheus native histograms documentation (prometheus.io/docs/specs/native_histograms), and OpenTelemetry official documentation (opentelemetry.io, last modified April 2026) as of May 2026.
Also read:
What Is OpenTelemetry and How Does It Work?
What RabbitMQ Monitoring Tools Work with Prometheus and Grafana?
How to Monitor ActiveMQ with Prometheus