The main difference between Amazon CloudWatch, Sentry, and CubeAPM is that CloudWatch is an AWS-native monitoring service focused on infrastructure and service telemetry, Sentry centers on application error tracking and performance debugging, and CubeAPM is an OpenTelemetry-native platform providing unified MELT coverage with predictable ingestion-based pricing.
Amazon CloudWatch is best suited for teams running production workloads primarily inside AWS that need tight integration with AWS services. Sentry is best suited for engineering teams that prioritize fast error detection, stack trace analysis, and developer-centric workflows. CubeAPM is best suited for organizations that require unified full-stack observability across cloud, hybrid, or on-prem environments, under a consistent telemetry model.
This guide compares Amazon CloudWatch vs Sentry vs CubeAPM across architecture, real user monitoring capabilities, sampling strategies, retention policies, deployment models, support response times, and cost behavior at production scale.
Amazon CloudWatch vs Sentry vs CubeAPM: Comparison
The comparison below is based on publicly available documentation and typical production usage patterns. Pricing and limits may vary by region, usage profile, and plan tier.
| Features | CubeAPM | Amazon CloudWatch | Sentry |
| Known for | OpenTelemetry-native observability with predictable costs | AWS-native infrastructure and service monitoring | Developer-first error and performance monitoring |
| Multi-Agent Support | Yes (OTel, New Relic, Datadog, Elastic) | Limited (CloudWatch Agent, AWS SDKs, OpenTelemetry, AWS X-Ray) | Limited (OTel, Prometheus) |
| MELT Support | Full MELT | Full MELT | Full MELT |
| Setup | Self-hosted but vendor-managed | SaaS (Fully managed AWS service) | SaaS & Self-hosted |
| Pricing | Ingestion-based pricing of $0.15/GB | Logs: $0.50/GB Traces(Over 30TB): $0.15/GB | Team: $26/month Business: $80/month |
| Sampling Strategy | Smart sampling (95% compression) | Tail + Adaptive | Head + Dynamic |
| Log Retention | Unlimited Retention | Logs: Indefinite retention | 30 days |
| Support TAT | < 10 minutes | Business Plan: 15 minutes | No details |
Amazon CloudWatch vs Sentry vs CubeAPM: Feature-by-Feature Breakdown
Known For
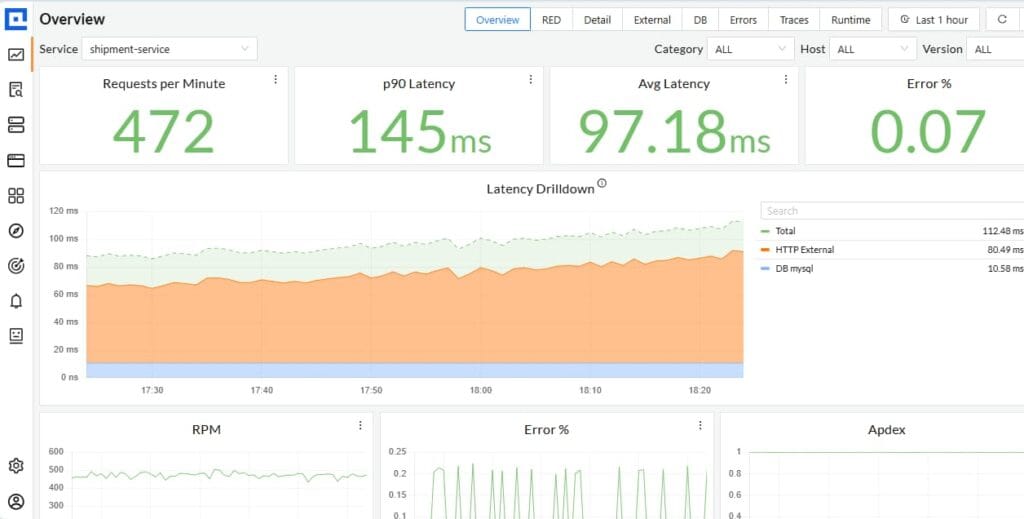
CubeAPM: Known for OpenTelemetry-native full-stack observability with predictable ingestion-based pricing. CubeAPM unifies metrics, events, logs, traces, real user monitoring, synthetic monitoring, and infrastructure telemetry under a single data model. It is designed for teams that need cross-cloud and hybrid consistency, vendor-managed self-hosting, and cost control as telemetry volume scales.
Amazon CloudWatch: Known as AWS’s native monitoring and observability service. CloudWatch provides infrastructure metrics, logs, alarms, application signals, and tracing through AWS X-Ray, tightly integrated with AWS services, IAM, and regional infrastructure. It is optimized for organizations running production workloads primarily inside AWS.
Sentry: Known for developer-first error tracking and performance monitoring. Sentry focuses on capturing application exceptions, stack traces, release health, and frontend performance data. It is widely adopted by engineering teams that prioritize fast debugging workflows and visibility into application-level issues.
Multi-Agent Support
CubeAPM: Supports OpenTelemetry collectors and SDKs across major programming languages and frameworks. Telemetry can be ingested using OpenTelemetry-native instrumentation as well as through integrations with Prometheus exporters and compatible third-party telemetry pipelines. This allows teams to standardize on OpenTelemetry while forwarding telemetry from existing environments.
Amazon CloudWatch: Telemetry can be collected using the CloudWatch Agent for host-level metrics and logs, AWS service-generated metrics and logs (such as from EC2, Lambda, ECS, and RDS), and AWS X-Ray for distributed tracing. AWS Distro for OpenTelemetry (ADOT) enables applications and infrastructure to send OpenTelemetry-formatted metrics and traces to CloudWatch and X-Ray.
Sentry: Uses language-specific SDKs installed in applications to capture errors, performance transactions, logs, and session data. Sentry also supports OpenTelemetry for distributed tracing ingestion and provides SDKs for backend services, frontend frameworks, and mobile applications.
MELT Coverage (Metrics, Events, Logs, Traces)
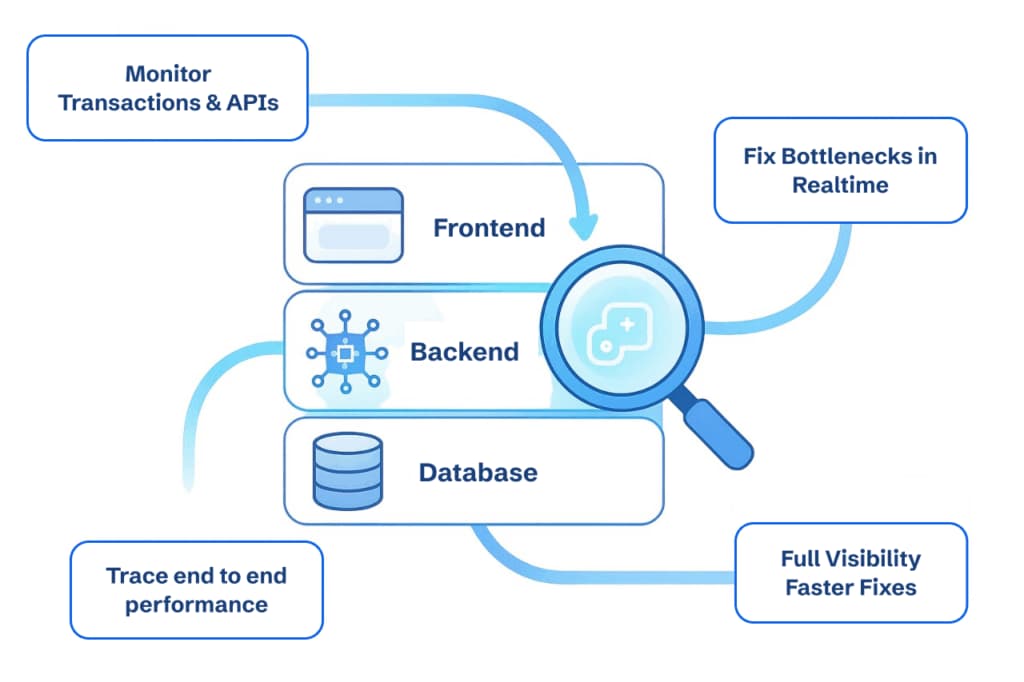
CubeAPM: Provides full MELT coverage using an OpenTelemetry-based data model. Metrics, events, logs, and traces share consistent resource attributes and context propagation, enabling cross-signal correlation across infrastructure, backend services, and frontend sessions within a single platform.
Amazon CloudWatch: Supports metrics, logs, and events through CloudWatch Metrics, CloudWatch Logs, and CloudWatch Events / EventBridge. Distributed tracing is delivered through AWS X-Ray, which integrates with CloudWatch for analysis. CloudWatch collects AWS service metrics by default and supports custom metrics published via APIs or agents.
Sentry: Supports error events, distributed tracing, structured logs, performance transactions, and release health monitoring. Metrics are generated from performance monitoring and transaction instrumentation. Sentry provides logs, traces, and error event visibility within its application monitoring platform.
Real User Monitoring (RUM)
CubeAPM: Provides Real User Monitoring that captures browser-level performance and user interaction data, including page load metrics, frontend errors, user sessions, and HTTP request performance. RUM data is collected through lightweight browser instrumentation and is part of CubeAPM’s unified observability platform. Frontend telemetry can be correlated with backend traces using shared context attributes, enabling end-to-end visibility from user interaction to service execution within the same telemetry model.
Amazon CloudWatch RUM: Enables real-user monitoring to collect and view client-side performance data from actual user sessions in near real time. It captures page load times, client-side errors, and user behavior, and provides aggregated metrics broken down by browser and device. RUM data is retained for 30 days unless exported to CloudWatch Logs for extended retention. Integration is done through an app monitor that generates a JavaScript snippet for instrumentation.
Sentry: Offers Real User Monitoring to understand how real users experience web applications. Sentry RUM collects frontend performance metrics such as First Paint, Largest Contentful Paint, and interaction timings, tracks HTTP request performance, and surfaces client-side errors. It also ties real user performance data back to error and transaction contexts within Sentry, helping teams identify performance regressions visible to users and correlate them with application trace data. Session Replay can be used alongside RUM to visually reproduce user interactions leading up to performance issues.
Deployment Model
CubeAPM: Provides a self-hosted or BYOC deployment model that is vendor-managed. Telemetry storage and processing run inside the customer’s cloud account or infrastructure, while the CubeAPM team handles upgrades, scaling operations, maintenance, and platform management. This model keeps data within the customer’s environment while reducing the operational burden typically associated with running an observability backend.
Amazon CloudWatch: Delivered exclusively as a fully managed SaaS service within AWS. There is no self-hosted deployment option. Telemetry ingestion, storage, scaling, and service availability are managed entirely by AWS as part of the AWS platform.
Sentry: Offers both SaaS and self-hosted deployment options. The SaaS version is fully managed by Sentry. The self-hosted option allows organizations to run Sentry within their own infrastructure, but operational responsibilities such as provisioning, scaling, storage management, upgrades, monitoring, and performance tuning are handled by the organization running the deployment.
Pricing: Approximate Cost for Small, Mid-Sized & Large Teams
*All pricing comparisons are calculated using standardized Small/Medium/Large team profiles defined in our internal benchmarking sheet, based on fixed log, metrics, trace, and retention assumptions. Actual pricing may vary by usage, region, and plan structure. Please confirm current pricing with each vendor.
*An APM host is a host that is actively generating trace data, and an Infra host is any physical or virtual OS instance that you monitor with any observability tool.
Below is a cost comparison for small, mid-sized, and large teams.
| Approx. Cost for Teams | Small (~30 APM Hosts) | Mid-sized (~125 APM Hosts) | Large (~250 APM Hosts) |
| CubeAPM | $2,080 | $7,200 | $15,200 |
| Amazon CloudWatch | $5,343.50 | $15,637 | $30,018 |
| Sentry | $3,560 | $12,100 | $32,400 |
What This Comparison Reveals at Scale
At small team size, cost differences exist but are rarely decisive. Most platforms fall within a manageable range, and selection is often driven by ecosystem alignment, developer workflow, or deployment preference rather than pricing structure.
At mid-sized scale, pricing architecture starts to matter more than entry cost. As telemetry volume increases across logs, traces, and frontend sessions, differences between ingestion-based, event-based, and multi-dimensional billing models become more visible. Monthly spend begins to reflect how each platform measures and meters telemetry.
At large scale, the pricing model becomes a structural decision. Telemetry growth, sampling configuration, retention settings, and signal correlation patterns directly influence long-term cost behavior. At this stage, observability is not only about features. It becomes an operational and financial design choice tied to how telemetry is collected, stored, and billed over time.
CubeAPM: Cost for Small, Medium, and Large Teams
CubeAPM uses a pure ingestion-based pricing model. Observability spend scales with the volume of telemetry processed rather than the number of hosts, user seats, or feature tiers. This structure ties cost directly to data volume generated by the system.
Pricing:
- $0.15 per GB ingested
Using standardized workload assumptions across comparable production environments, estimated monthly costs typically scale in proportion to telemetry growth:
- Small teams (~30 APM hosts): approximately $2,080
- Mid-sized teams (~125 APM hosts): approximately $7,200
- Large teams (~250 APM hosts): approximately $15,200
As environments expand, cost is influenced by telemetry patterns such as log volume, trace collection rates, and retention policies. Because pricing is tied to ingestion rather than infrastructure count, forecasting aligns more closely with data growth and traffic behavior.
Amazon CloudWatch: Cost for Small, Medium, and Large Teams
Amazon CloudWatch follows a multi-dimensional pricing model. Charges are applied separately across logs, metrics, traces, API requests, and optional capabilities such as CloudWatch Insights and Synthetics. Cost is influenced by ingestion volume, custom metric usage, trace recording through AWS X-Ray, and storage retention settings.
Pricing typically includes:
- Logs: $0.50 per GB ingested
- Traces (AWS X-Ray): $0.15 per GB
Using aligned workload assumptions across comparable production environments, estimated monthly costs typically scale with telemetry growth:
- Small teams (~30 APM hosts): $5,343.50
- Mid-sized teams (~125 APM hosts): $15,637
- Large teams (~250 APM hosts): $30,018
As systems scale, cost variability is influenced by log verbosity, metric cardinality, trace sampling rates, and retention configuration. Because billing spans multiple telemetry dimensions, forecasting requires monitoring usage patterns across each billed component.
Sentry: Cost for Small, Medium, and Large Teams
Sentry has ingestion-based pricing and also pricing is based on tiers, e,g Team, Business. Charges are primarily determined by the number of error events, transactions, replays, and logs processed within a billing period. Pricing tiers define monthly event quotas, with overages billed based on usage.
Core pricing drivers typically include:
- Team: $26/month
- Business: $80/month
Using comparable workload assumptions across similar production environments, estimated monthly costs scale with event volume:
- Small teams (~30 APM hosts): approximately $3,560
- Mid-sized teams (~125 APM hosts): approximately $12,100
- Large teams (~250 APM hosts): approximately $32,400
As application traffic increases, event volume grows proportionally with user activity, transaction throughput, and error frequency. Cost behavior closely follows application usage patterns and frontend session volume.
Sampling Strategy
CubeAPM: Uses smart sampling, a context-aware mechanism that evaluates trace attributes and execution context before retention. Sampling decisions are based on request characteristics and system signals rather than a fixed percentage, helping manage ingestion volume while preserving higher-value traces.
Amazon CloudWatch: Distributed tracing through AWS X-Ray supports adaptive sampling, which automatically adjusts sampling rates based on traffic volume to maintain consistent trace capture targets per service. Through AWS Distro for OpenTelemetry (ADOT), tail-based sampling is supported, allowing sampling decisions to be made after a trace is completed so selection can be based on full request characteristics.
Sentry: Supports head-based sampling configured at the SDK level, where a percentage of transactions are sampled at the start of execution. Sentry also provides dynamic sampling, enabling rules that adjust sampling decisions based on attributes such as environment, release version, transaction name, or other event metadata.
Data Retention
CubeAPM: Supports unlimited retention across metrics, logs, and traces. Telemetry can be stored long-term without predefined expiration windows, allowing teams to retain historical trace context, perform multi-quarter investigations, and meet compliance or audit requirements without exporting data to secondary storage systems.
Amazon CloudWatch: Log retention is configurable per log group and can be set from 1 day up to 10 years. If no retention policy is configured, logs are retained indefinitely. Metric retention follows AWS-defined resolution tiers: 1-minute metrics are retained for 15 days, 5-minute metrics for 63 days, and 1-hour aggregated metrics for approximately 455 days (about 15 months). Trace data retention in AWS X-Ray follows AWS service-defined limits and is managed separately from logs and metrics.
Sentry: Retention depends on the subscription plan. For example, error events are typically retained for 30 days on Developer plans and up to 90 days on Team and Business plans. Logs and spans are commonly retained for 30 days across plans, while session replays and uptime data may extend to 90 days on higher tiers. Some aggregated performance data can be retained for longer periods depending on plan level.
Support Channel and Response Time (TAT)
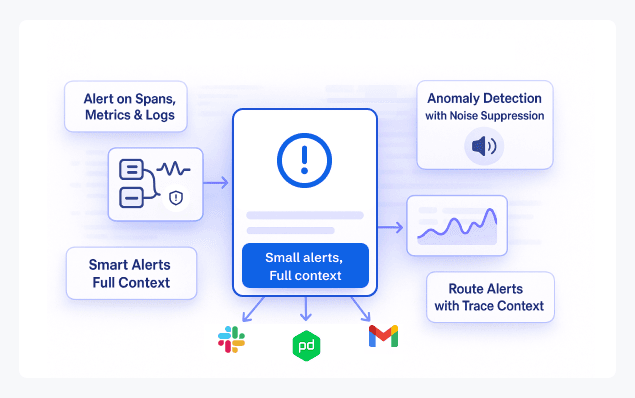
CubeAPM: Provides direct support through Slack and email, with typical response times under 10 minutes for active production issues. During live incidents, rapid engineering engagement is critical because observability systems are often used to diagnose outages in real time. Fast response reduces investigation delays, shortens mean time to resolution (MTTR), and ensures telemetry pipelines remain operational when they are needed most.
Amazon CloudWatch: Support is delivered through AWS Support plans rather than as a CloudWatch-specific service. Customers can open cases through the AWS Support Center, with access to web, chat, and phone channels depending on the selected plan. Under AWS Enterprise Support, critical (Severity 1) production issues target a 15-minute response time. Under AWS Business Support, critical cases target approximately a 1-hour response. Response targets vary by severity and plan level.
Sentry: Offers support via email and Slack for eligible plans. Documentation and a public community forum are also available, especially relevant for organizations running the self-hosted deployment. Publicly available documentation does not specify formal response time guarantees, and response timelines may vary depending on plan tier.
How Teams Evaluate These Platforms at Scale
As observability deployments mature, evaluation moves beyond feature lists and focuses on how each platform behaves under sustained production load. Engineering leaders assess how systems handle increasing telemetry volume, distributed tracing growth, frontend monitoring expansion, and rising service complexity.
Pricing architecture becomes a central consideration at scale. Ingestion-based, event-based, and multi-dimensional billing models respond differently to traffic spikes, incident-driven telemetry surges, and log verbosity increases. Cost predictability and transparency become measurable factors in long-term planning.
Retention and sampling strategy also influence platform choice. Teams evaluate how sampling mechanisms preserve meaningful traces during incidents and whether retention policies support historical analysis, compliance requirements, and post-incident investigations.
Deployment model and support responsiveness complete the evaluation. Organizations consider whether they require SaaS simplicity, infrastructure control, or vendor-managed self-hosting, and how quickly they can access engineering support during critical outages. At scale, observability decisions impact operational resilience as much as visibility.
Amazon CloudWatch vs Sentry vs CubeAPM: Use Cases
Choose CubeAPM if:
- You need unified metrics, events, logs, traces, RUM, and synthetics under a single OpenTelemetry-native model.
- You operate across cloud, hybrid, or on-prem environments and require telemetry standardization.
- You want predictable ingestion-based pricing aligned with telemetry volume.
- You require vendor-managed self-hosting with data residing inside your infrastructure.
- You need rapid engineering support during production incidents.
Choose Amazon CloudWatch if:
- Your workloads primarily run inside AWS and require deep integration with AWS services.
- You need native visibility into AWS infrastructure and managed services.
- You prefer a fully managed monitoring service operated entirely within the AWS platform.
- You rely on AWS-native tracing through X-Ray and service-level metrics.
Choose Sentry if:
- Your priority is application error tracking and stack trace visibility.
- You need performance monitoring tied closely to code-level instrumentation.
- You require frontend monitoring with session replay.
- You want SDK-based instrumentation embedded directly into applications.
Conclusion
Amazon CloudWatch, Sentry, and CubeAPM address observability from different architectural starting points. CloudWatch is tightly integrated with AWS infrastructure and services, Sentry centers on application error tracking and performance debugging, and CubeAPM provides unified full-stack observability built on OpenTelemetry.
At production scale, the distinction is less about feature availability and more about pricing structure, deployment control, retention flexibility, and sampling strategy. Each platform aligns with different operational models and infrastructure footprints.
The right choice depends on where your workloads run, how your teams instrument applications, and how you want telemetry cost and control to behave as systems grow.
Disclaimer: The information in this article reflects the latest details available at the time of publication and may change as technologies and products evolve.
FAQs
1. Which platform is better for multi-cloud environments?
Amazon CloudWatch is designed primarily for AWS workloads. Sentry supports multi-environment application instrumentation through SDKs. CubeAPM is built on OpenTelemetry and can operate across multi-cloud, hybrid, and on-prem environments using standardized telemetry collection.
2. How do these platforms differ in pricing models?
Amazon CloudWatch uses a multi-dimensional pricing structure covering logs, metrics, traces, and API usage. Sentry primarily uses an event-based pricing model tied to error events and transactions. CubeAPM uses predictable ingestion-based pricing tied directly to telemetry volume.
3. Do all three platforms support distributed tracing?
Yes. Amazon CloudWatch provides distributed tracing through AWS X-Ray. Sentry supports distributed tracing with head-based and dynamic sampling. CubeAPM supports distributed tracing natively using OpenTelemetry with smart sampling capabilities.
4. How do deployment options differ between these platforms?
Amazon CloudWatch is offered exclusively as a managed AWS service. Sentry provides both SaaS and self-hosted deployment options. CubeAPM offers a vendor-managed self-hosted or BYOC model where telemetry runs inside the customer’s infrastructure without worrying about management.
5. Which platform supports frontend monitoring?
Sentry provides browser SDKs and session replay for frontend performance and error tracking. Amazon CloudWatch offers CloudWatch RUM for client-side web performance monitoring. CubeAPM includes Real User Monitoring that correlates browser sessions with backend traces using OpenTelemetry context.


