Modern systems generate massive volumes of distributed telemetry, and teams are increasingly depending on distributed tracing to understand it. Nearly two-thirds of organizations include traces in their observability stack, with financial services reporting trace usage at 65 % in production environments.
Distributed tracing is a causal model of how a request travels through interconnected services, and its real value is revealed when systems fail or behave unexpectedly. Too often, teams adopt tracing without understanding what it is meant to show, why traces vanish during incidents, or how tracing fits within a broader observability strategy.
This article explains how distributed tracing works in production, why traces break under stress, and where tracing fits in an observability strategy.
What is Distributed Tracing and What Does it Actually Mean to Show?
Distributed tracing is a technique in observability that explains how a single request executes in a distributed system. It records the chain of work triggered by that request as it crosses service boundaries, threads, queues, and external dependencies. Each trace reconstructs the order in which operations occurred and the dependencies that shaped the outcome.
Example: E-commerce checkout flow

Consider a typical e-commerce checkout request. A user submits an order after adding items to their cart. That single action triggers a chain of operations across multiple services.
- The checkout service validates the request and creates the order.
- Inventory is checked to confirm availability.
- A payment service authorizes the transaction through an external provider.
- Analytics events are recorded, and a notification service sends confirmation to the user.
Each of these steps may involve database queries, internal service calls, and outbound requests to third-party APIs.
From the user’s perspective, this is a single interaction. From the system’s perspective, it is a distributed workflow that spans services, dependencies, and execution boundaries. Latency or failure in any one step can impact the overall checkout experience.
Components of Distributed Tracing
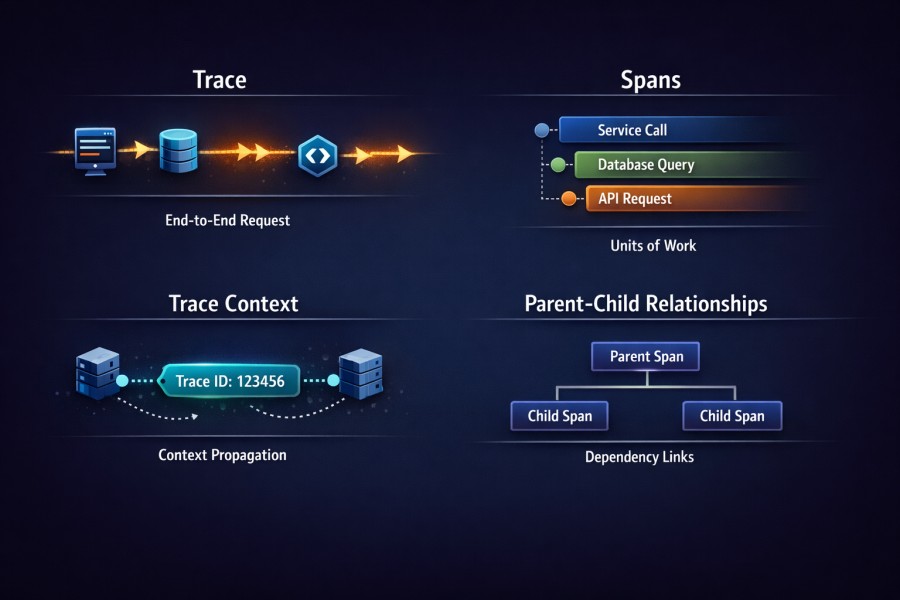
Distributed tracing represents a request using a small set of core components that model execution and dependency:
- Trace: a single end-to-end request as it moves through the system
- Span: an individual unit of work within that request, such as a database query, an internal service call, or an outbound API request
- Trace context: the identifier propagated across services that allows spans from different systems to be linked together
- Parent-child relationships: the dependency structure that shows which operations triggered others
In the checkout flow example below, the incoming request to the checkout service creates the root span. Calls to inventory validation, payment authorization, and notification services appear as child spans, each with their own internal work.
If the payment service retries an authorization or inventory checks are conditional, those branches are captured explicitly in the trace, reflecting the exact path taken by that order rather than a generalized workflow.
The core purpose of distributed tracing
At its best, distributed tracing answers one class of questions:
Why did this request behave the way it did?
To answer that, a trace must show:
- The execution path taken by the request
- Which operations blocked others
- Where waiting occurred versus actual computation
- Which downstream dependencies influenced the result
This is why tracing is most valuable when failures are non-obvious. It surfaces causal structure, not aggregate behavior.
What distributed tracing does not attempt to measure
Tracing is often judged by the wrong criteria. It is not designed to:
- Describe system-wide health
- Summarize performance across traffic
- Explain how frequently an issue occurs
- Replace saturation or capacity signals
Those are statistical questions. But traces are not statistical, but concrete. This distinction becomes critical during incidents. Teams that expect traces to behave like metrics often conclude that tracing is unreliable.
Traces model causality (not performance)
A distributed trace is a causal graph. Each span exists because some prior operation was completed. Parent and child relationships encode dependency, not just timing. Duration alone is insufficient without context. This explains many common failure patterns:
- A fast service that consistently blocks requests due to downstream waits
- Low CPU usage alongside high end-to-end latency
- Failures that only appear when specific call paths are exercised
Tracing does not tell you whether a service is slow in general. It tells you whether it slowed this request and why.
In the checkout example above, a trace would show which downstream step blocked the order flow, even if overall service metrics still look healthy.
A trace is one execution (not a representative sample)
A trace captures exactly one outcome. In modern systems, a single request may:
- Fan out to multiple services
- Retry only on specific error paths
- Trigger asynchronous background work
- Partially fail and recover
In the checkout example, a single trace may include a payment retry or a conditional inventory check that only applies to that order.
The trace reflects the path that was executed, not the paths that could have executed. This is where experienced teams are careful. A trace is evidence, never a conclusion on its own. Metrics provide frequency and impact. But traces provide an explanation. When these roles are not clear, teams either over-trust individual traces or dismiss tracing entirely.
Execution latency and observability latency diverge under stress
Execution latency describes how long the request took to run. Observability latency describes how long it takes for the execution to be seen and reasoned about. Under normal conditions, these timelines feel aligned. During incidents, they separate sharply.
As systems come under pressure:
- Ingestion pipelines saturate
- Sampling decisions become more aggressive
- Traces arrive late or partially
- Some traces never materialize
This is not a tooling failure, but a predictable outcome of how tracing systems operate under load. Understanding this distinction prevents a common mistake of assuming that missing traces indicate broken instrumentation. More often, they indicate that visibility is lagging behind reality.
Why this matters even if metrics already exist
Metrics tell you something is wrong. Distributed tracing explains how the failure unfolded.
When tracing is treated as a causal model (not just a performance dashboard), it improves investigation. That shift in expectation is necessary before you can rely on tracing in production environments.
How a Single Request Becomes a Distributed Trace
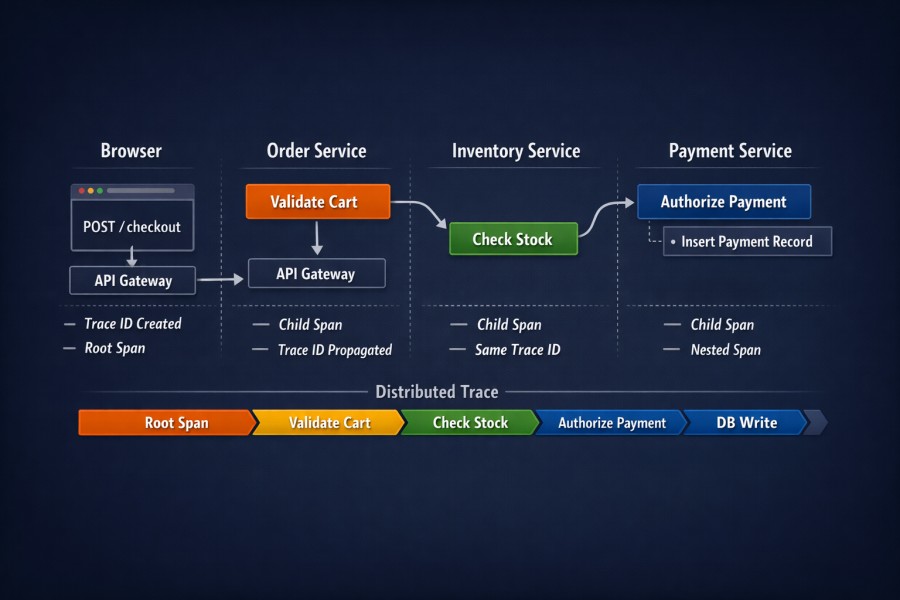
A distributed trace does not appear automatically just because tracing is enabled. It is constructed step by step as a request moves through the system. Every gap in that construction weakens the final picture.
Understanding this process is essential. Without it, trace loss looks random, broken traces look like bugs, and instrumentation problems get misdiagnosed as tooling failures.
The foundational model
A distributed trace is built incrementally as execution progresses. Each service that participates in handling a request contributes a fragment of the overall story. Those fragments are stitched together using shared context, not by time alone. In the checkout flow, these fragments come from the order service, inventory checks, payment authorization, analytics writes, and notification delivery.
At a high level, this requires three things to happen consistently:
- The request must carry a trace context when it enters a service
- That context must be preserved as work moves through the service
- Downstream calls must reuse the same context
If any of these steps fail, the trace fragments. Nothing downstream can repair that loss.
Spans, relationships, and context propagation
Spans are the basic units of work in a trace. Each span represents a specific operation. A database query. An HTTP call. What makes spans useful is how they relate to each other, not necessarily their duration.
A correct trace depends on:
- Parent–child relationships that reflect execution order
- Context propagation that carries trace identifiers across boundaries
- Consistent trace IDs reused across services
Parent–child relationships encode dependency. They answer which work could not begin until the other work is completed. Without these relationships, traces degrade into disconnected timing events.
Context propagation is the fragile part. It relies on headers, metadata, or execution-local storage surviving every hop the request takes.
Why async boundaries matter
Asynchronous execution is where most traces quietly break. Queues, callbacks, thread pools, and event loops introduce boundaries where execution continues without an obvious call stack. If trace context is not explicitly preserved, the next span starts a new trace instead of continuing the existing one.
This commonly happens when:
- Messages are enqueued without trace headers
- Background workers start new execution contexts
- Callbacks lose access to request-scoped state
- Thread or task pools reuse execution environments
In the checkout flow, this often occurs when payment retries or notification dispatches run asynchronously without preserving trace context. This is why distributed tracing often looks fine in synchronous request paths and unreliable everywhere else.
What breaks trace continuity in real systems
In production environments, trace continuity fails for structural reasons, not just coding mistakes. Common causes include:
- Missing or dropped context during retries and redirects
- Partial instrumentation across services
- Libraries or frameworks that do not propagate context correctly
- Sampling decisions that drop spans mid-trace
- Short-lived processes that exit before spans are flushed
Once continuity is broken, the trace cannot be reconstructed after the fact. Downstream spans have no way to attach themselves to the original request. This is the key realization many teams miss. Distributed tracing is not a passive recording. It is an active coordination problem that must succeed at every boundary. When that mental model is clear, trace loss stops looking mysterious. It becomes predictable.
Example: How a Checkout Request Becomes a Trace
To make this concrete, consider a user completing a checkout flow in a microservices-based e-commerce system. When the user clicks “Place Order,” a single logical request begins. What distributed tracing does is capture how that request moves across services, databases, and asynchronous components.
Step-by-step, this is what happens:
- The request enters the system: The browser sends a POST /checkout request to the API gateway. A root span is created at this boundary. A unique trace ID is generated and attached to the request headers.
- The order service processes the request: The API gateway forwards the request to the order service. The service extracts the trace context from headers and creates a child span, for example, validate_cart. The trace ID remains the same.
- The inventory service is called: The order service makes an HTTP call to the inventory service. A new child span is created, such as check_stock. Context propagation ensures the same trace ID travels with this call.
- The payment service authorizes payment: Another downstream call is made to the payment service. A child span like authorize_payment is created. Inside that service, a nested span may represent a database write, such as insert_payment_record.
At this point, the trace forms a tree. Every span shares the same trace ID. Parent–child relationships reflect real execution dependencies. The full checkout path is visible as one connected structure.
Now consider what happens at an asynchronous boundary:
- A notification message is published to a queue: After payment succeeds, the system publishes a message to trigger order confirmation emails. If trace context is injected into the message metadata, the background worker continues the same trace.
If context is not preserved, the worker starts a new trace. From the tracing system’s perspective, the checkout flow ends prematurely. This is where most real-world trace fragmentation occurs.
Where Distributed Tracing Breaks Down in Production
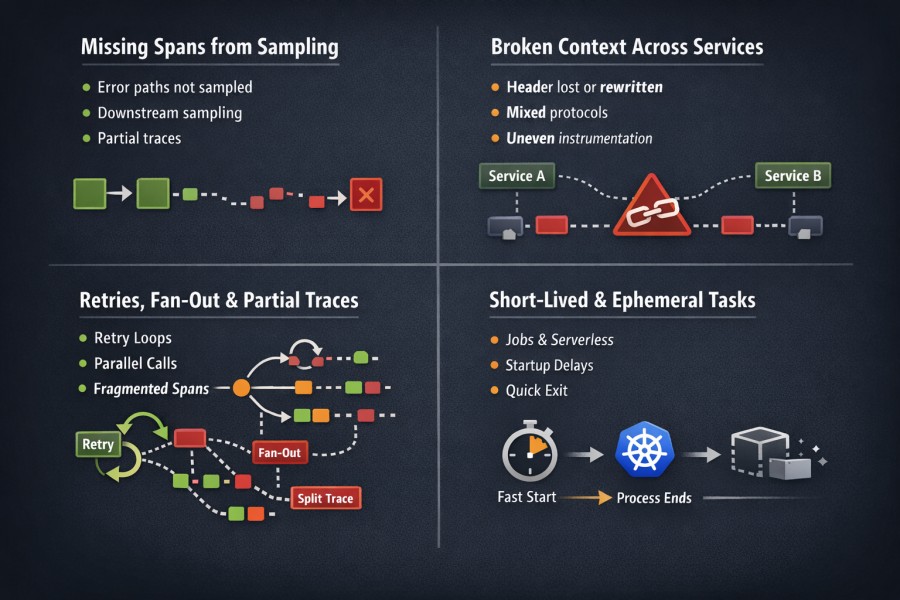
Distributed tracing rarely fails because teams misunderstand the theory. It fails because production systems behave differently under real load, real failures, and real constraints.
In controlled environments, traces look clean and complete. In production, they fragment. Not randomly, but predictably. The same failure patterns appear across companies, stacks, and tracing tools.
Missing spans due to sampling
Sampling decides which spans are recorded and which are dropped. That decision often happens early, before the system knows whether a request will succeed or fail. This leads to a few consistent problems:
- Critical error paths are dropped because they were not sampled at the start
- Long traces lose internal spans when downstream systems apply independent sampling
- Partial traces appear complete at first glance, but hide missing work
During checkout spikes, failed payment attempts are often less visible than successful orders because they are sampled out early.
Broken context across services
Distributed tracing only works when the trace context survives every hop. In real systems, that assumption often breaks. Context gets lost when:
- Services use different propagation formats or versions
- Gateways and proxies drop or rewrite headers
- Internal services are instrumented unevenly
- Legacy components do not forward trace metadata
Once context is lost, downstream spans form a new trace. The original request is now split into multiple, disconnected fragments. In a checkout flow, this appears as the trace ending at the order service while downstream payment or notification work is missing.
Retries, fan-out, and partial traces
Modern systems rarely execute requests in a straight line. A single request may trigger:
- Parallel downstream calls across multiple services
- Retries that only occur on specific failures
- Conditional execution paths based on runtime state
Tracing systems record what actually happened, not what was intended to happen. That distinction matters. Retries often create confusing traces. Some attempts appear. Others do not. Fan-out can amplify trace volume, increasing the likelihood that internal spans are sampled out even when the root span survives.
The result is a trace that is technically correct but operationally misleading. It shows part of the execution, not the full decision tree that led to the outcome.
Short-lived workloads and ephemeral execution
Short-lived workloads are hostile to tracing. Jobs, init containers, serverless functions, and batch tasks often start, do work, and exit quickly. In those windows:
- Spans may not flush before the process terminates
- Trace exporters may not initialize fully
- Context may never propagate beyond the first boundary
These workloads are common in Kubernetes environments, especially during deployments and autoscaling events. Ironically, they often execute at the exact moments engineers most need visibility.
When traces are missing from these paths, it is not because tracing was forgotten. It is because the execution model itself leaves little room for observability to attach.
Why these failures are systemic
None of these breakdowns are edge case. They emerge from fundamental properties of distributed systems:
- Independent failure domains
- Asynchronous execution
- Load-dependent behavior
- Resource and cost constraints
Distributed tracing breaks because production systems evolve faster than visibility assumptions. Recognizing these limits is what separates effective tracing from false confidence.
Example: How a Production Checkout Trace Degrades Under Load
Consider a distributed checkout system during a high-traffic promotion. Instrumentation is correct, and traces look complete in staging. Under real production load, fragmentation becomes structural. The tracing model remains intact. The execution environment changes.
- Traffic surge: Head-based sampling at the API boundary drops a portion of requests before failure conditions emerge, reducing visibility into high-latency and error-heavy paths.
- Retry behavior: Intermittent payment failures trigger automatic retries, creating multiple execution attempts where only some spans are retained due to sampling or exporter limits.
- Context propagation loss: A gateway, proxy, or service mesh component fails to forward trace headers, causing downstream services to generate new trace IDs and split the original request.
- Parallel fan-out: The order service calls inventory, fraud detection, and analytics concurrently, increasing span volume and raising the probability of mid-trace sampling.
- Autoscaling churn: Rapid pod startup and termination in Kubernetes prevents spans from flushing reliably, especially during peak load or scaling events.
The observable impact:
- Traces that end prematurely
- Missing retry attempts during failures
- Downstream work is detached from the original request
- Execution trees that appear complete but hide causal gaps
These reflect structural constraints:
- Early sampling decisions: Visibility is determined before request severity is known.
- Fragile metadata boundaries: Trace continuity depends on headers surviving every hop.
- Asynchronous execution paths: Retries and parallel calls increase fragmentation risk.
- Ephemeral infrastructure: Short-lived workloads reduce exporter reliability.
In production systems, distributed tracing degrades along architectural boundaries. Understanding those boundaries is what turns fragmented traces into actionable insight rather than false confidence.
Tracing vs Metrics vs Logs: Why Traces Alone Are Not Enough
Distributed tracing is powerful, but it was never meant to stand on its own. Many teams run into trouble when they treat traces as a replacement for metrics or logs instead of as a complement. When incidents become hard to debug, the issue is usually a missing alignment between signals, not missing data.
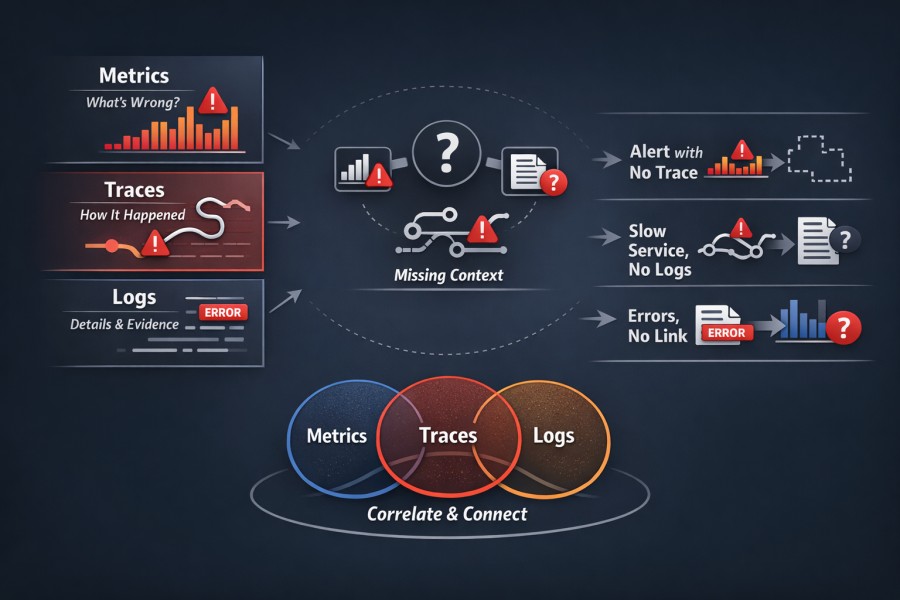
Metrics show patterns
Metrics describe how a system behaves over time. They answer questions like:
- Is latency increasing across traffic
- Are error rates trending upward
- Is saturation building in a specific component
Metrics are statistical by design. They smooth individual events into trends and distributions. That makes them ideal for detection and alerting. What metrics do not explain is why a specific request failed. They tell you something is wrong, not how it happened.
Logs show evidence
Logs capture discrete events. They record what a service observed at a specific moment. Errors, warnings, state transitions, and diagnostic messages all live here. Logs are strongest when you already have a hypothesis. They provide confirmation. Stack traces. Error codes. Input values. Branch decisions.
What logs do not provide is structure. Without context, logs are fragments. During incidents, volume increases, noise rises, and relevant entries become harder to isolate.
Traces show causality
Traces connect work across boundaries. They show how one operation led to another, across services, threads, queues, and retries. This makes tracing uniquely suited to explaining complex failures in distributed systems. Traces answer questions like:
- Which dependency blocked this request
- Where execution stalled versus progressed
- How parallel downstream calls and fan-out influenced latency
What traces do not show well is frequency or impact. A trace explains one outcome. It does not tell you how often that outcome occurs.
Why debugging fails without correlation
Each signal answers a different class of question.
- Metrics detect that something is wrong
- Traces explain how a specific failure unfolded
- Logs provide evidence to confirm or refute hypotheses
When these signals are isolated, debugging becomes guesswork. Common failure modes include:
- Metrics alert on a spike, but traces are sampled out
- Traces identify a slow dependency, but logs lack context
- Logs show errors, but there is no trace to connect them to upstream requests
In these situations, teams bounce between dashboards, trace views, and log searches without a coherent narrative. Time is lost because signals cannot be joined, not because data is missing.
Correlation is the real requirement
Effective observability depends less on collecting signals and more on correlating them. Correlation means:
- Metrics link to representative traces
- Traces reference relevant logs
- Logs carry identifiers that tie back to requests
When this alignment exists, investigation flows naturally. Detection leads to explanation. Explanation leads to evidence. Tracing becomes most valuable not as a standalone tool, but as part of a system where metrics, logs, and traces reinforce each other. That is the difference between having observability data and having observability.
Distributed Tracing During Incidents: What Changes
Incidents change how systems behave, and they also change how tracing behaves. Teams that trust tracing in a steady state are often surprised by how unreliable it feels once things start breaking. This is because incidents push tracing systems into modes they rarely operate in during normal conditions.
Ingestion spikes
Incidents generate more telemetry, not less. Error paths produce additional spans. Retries increase request volume. Timeouts extend execution paths. Together, these effects cause a sudden surge in trace data. This leads to:
- Higher span volume per request
- Bursty ingestion instead of smooth traffic
- Backpressure in collectors and pipelines
Tracing systems are typically sized for average load, not worst-case failure amplification. When ingestion spikes, something has to give.
Sampling kicks in
Sampling becomes more aggressive during incidents. As ingestion pressure rises, tracing systems drop more data to protect themselves. These decisions often happen early, before the system knows whether a request will fail. The result is predictable:
- Successful requests are overrepresented
- Rare or complex failure paths are underrepresented
- Long traces lose internal detail
This is why engineers often feel that tracing works best before and after incidents, but not during them.
Traces arrive late or partially
During incidents, traces do not just disappear. Many arrive too late to be useful. Backpressure, batching, and retry behavior in telemetry pipelines increase observability latency. Engineers investigate in real time, while traces trickle in seconds or minutes later. Even when traces arrive, they are often incomplete:
- Some spans are missing
- Downstream work appears disconnected
- Timing relationships are distorted
At that point, the trace explains what happened eventually, not what is happening now.
Engineers query broader scopes under stress
Human behavior changes during incidents. Engineers widen time ranges. They search across services. They relax filters. These actions are reasonable, but they increase query cost and reduce signal density. Under stress:
- Queries scan more data
- Sampling effects become more visible
- Noise increases faster than insight
Tracing systems that feel responsive during focused exploration can feel slow and unhelpful when queries become broad and urgent.
Example: Tracing Behavior During a Live Payment Outage
Consider a live payment outage during peak business hours. The checkout system begins returning intermittent 500 errors. Engineers rely on tracing to understand what is failing. Tracing behaves differently under stress.
- Error amplification: Payment timeouts trigger retries with exponential backoff, increasing the number of spans generated per request.
- Ingestion surge: Retry storms and extended execution paths create bursty telemetry, overwhelming collectors sized for average load.
- Protective sampling: As ingestion pressure rises, adaptive or rate-based sampling drops more spans to protect the pipeline, often before error severity is known.
- Exporter backpressure: Collectors queue spans under load, delaying delivery to the backend and increasing trace latency.
- Partial trace assembly: Some spans are dropped mid-trace, making downstream work appear disconnected or incomplete.
What engineers observe:
- Fewer visible failure traces than expected
- Delayed trace availability during active debugging
- Traces missing internal retry attempts
- Increased noise when broad queries are issued under stress
During incidents, tracing reflects the stress of the system it observes. Understanding this shift prevents teams from mistaking protective behavior for tracing failure.
Head-Based vs Tail-Based Sampling
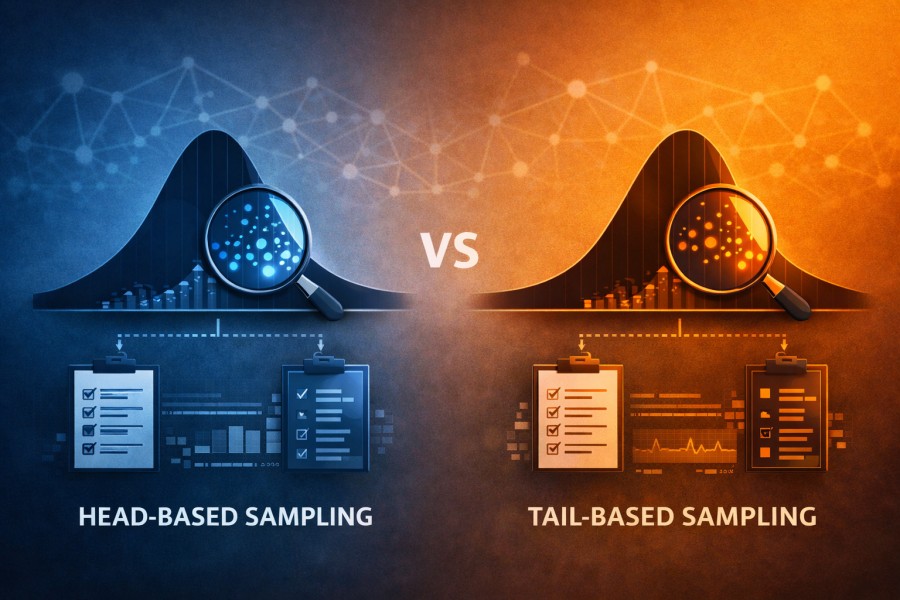
Sampling determines which traces are kept and which are dropped. That decision shapes what engineers can see during normal operation and during incidents.
There is no universally correct sampling strategy. Head-based and tail-based sampling optimize for different goals, and each introduces its own failure modes. Understanding those trade-offs matters more than choosing a default.
What head-based sampling optimizes for
Head-based sampling makes a decision at the start of a request. Before most work has been executed, the system decides whether to record the trace. That decision is simple and cheap. It requires no buffering and no coordination across services.
Head-based sampling optimizes for:
- Low overhead at high traffic volumes
- Predictable ingestion rates
- Simple deployment and scaling
This is why head-based sampling is common. It protects tracing infrastructure and keeps costs stable under load. What it does not optimize for is outcome awareness.
Why head-based sampling loses rare failures
Head-based sampling has no knowledge of how a request will end. At the moment the sampling decision is made, the system does not know whether the request will fail, retry, or trigger complex downstream behavior. Rare failures look identical to successful requests at the start. As a result:
- Low-frequency errors are sampled out disproportionately
- Complex failure paths disappear during high traffic
- Incident-specific behavior is underrepresented
This is why traces often look clean when systems are healthy and incomplete when things break. The sampling decision happened before the system knew the request mattered.
What tail-based sampling optimizes for
Tail-based sampling makes decisions after a request completes. The system observes latency, errors, and structure before deciding whether to keep the trace. This allows it to preferentially retain slow requests, failures, and unusual execution paths.
Tail-based sampling optimizes for:
- Retaining rare and high-value traces
- Better visibility into failure modes
- Outcome-aware trace selection
This aligns well with how engineers debug incidents. The traces that matter most are the ones least likely to be sampled out.
Why tail-based sampling increases infrastructure cost
Tail-based sampling is not free. To make a decision after execution, the system must temporarily store spans, coordinate across services, and process higher data volumes before dropping anything. This leads to:
- Increased memory and storage requirements
- Higher network and coordination overhead
- More complex failure modes in the sampling pipeline
Under load, tail-based systems must handle peak traffic even if most traces are eventually discarded. That shifts cost and complexity earlier in the pipeline.
Why sampling decisions are architectural
Sampling is not a tuning knob. It is an architectural choice. The sampling strategy determines:
- Which failures are visible by default
- How tracing behaves during incidents
- Where cost and complexity are absorbed
Changing sampling later often requires changes to pipelines, collectors, and operational assumptions. That is why teams struggle when sampling is treated as a configuration detail rather than a design decision.
Head-based and tail-based sampling reflect different priorities. One favors infrastructure protection. The other favors diagnostic fidelity. Understanding that trade-off is essential before choosing either.
Distributed Tracing in Kubernetes Environments
Kubernetes changes the assumptions that distributed tracing relies on. Requests no longer move through a small, stable set of services. They move through dynamic infrastructure that is constantly starting, stopping, and reshaping execution paths.
Tracing still works in Kubernetes, but only if these conditions are understood. Without that context, trace gaps look random and difficult to explain.
Service meshes, sidecars, and context loss
Kubernetes environments often introduce additional network layers. Service meshes, ingress controllers, and sidecar proxies intercept traffic before it reaches application code. Each hop becomes another place where the trace context must survive. Context loss commonly occurs when:
- Proxies rewrite or drop headers
- Different components use incompatible propagation formats
- Application and mesh instrumentation are not aligned
- Sidecars emit spans without linking them correctly to application traces
When this happens, traces fragment silently. Requests still succeed. Metrics still look reasonable. Only the trace graph breaks. This is why teams often see partial traces that end at the edge of the cluster or restart unexpectedly inside it.
Tracing across pods, nodes, and reschedules
Kubernetes schedules work dynamically. A single service may handle requests across many pods. Those pods may be rescheduled to different nodes at any time. From a tracing perspective, this introduces discontinuity. Tracing must handle:
- Requests jumping between pods without shared process state
- Spans emitted from different nodes with no direct coordination
- Execution paths that cross ephemeral infrastructure boundaries
When context propagation is correct, this works. When it is not, traces split at pod or node boundaries with no obvious error. This is why tracing issues often surface only after deployments or cluster changes.
Why traces fail during autoscaling and restarts
Autoscaling and restarts amplify every tracing weakness. As new pods start, instrumentation initializes. As old pods terminate, spans must flush before processes exit. Under load, both of these steps become unreliable. During autoscaling and restarts:
- Short-lived pods exit before spans are exported
- New pods handle traffic before tracing is fully initialized
- Context is lost during rapid connection churn
These events often coincide with traffic spikes or failures, which increase trace volume and sampling pressure at the same time. The result is predictable. Traces are least complete during the exact moments engineers most need them.
Understanding how Kubernetes affects tracing behavior is necessary before diagnosing trace loss or tuning sampling. In containerized environments, tracing failures are usually a consequence of orchestration dynamics, not instrumentation mistakes.
What “Good” Distributed Tracing Looks Like in Practice
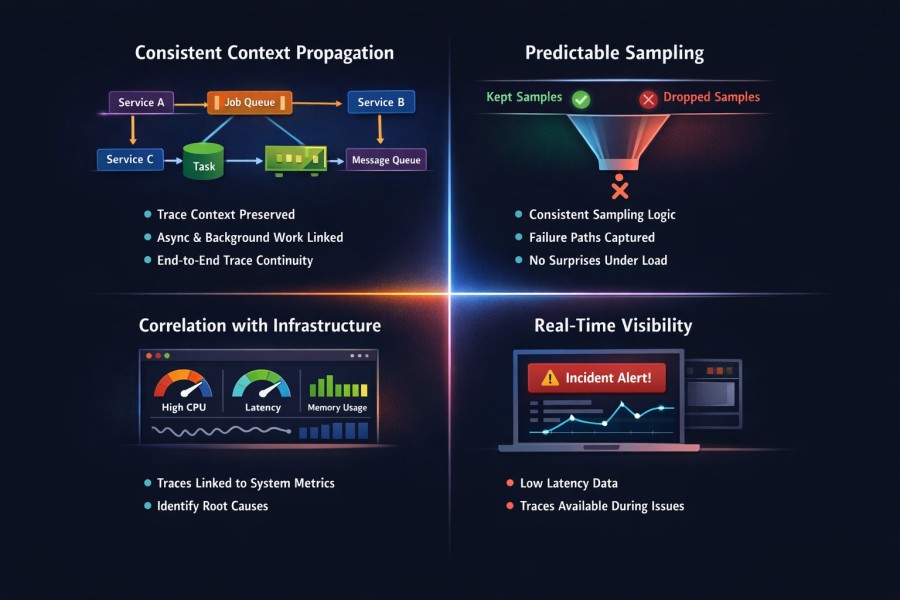
Good distributed tracing is defined by how reliably traces explain failures in production, especially under stress. This is a capability problem, not a tooling problem. The same instrumentation can feel powerful or useless depending on how these capabilities are implemented.
Consistent context propagation
Good tracing preserves context everywhere a request goes. That includes synchronous calls, asynchronous work, retries, background jobs, and message queues. Context does not stop at service boundaries or execution models. This means:
- Trace context survives every network hop
- Async execution does not reset trace identity
- Downstream work always attaches to the original request
When context propagation is consistent, traces form a coherent narrative. When it is not, traces are fragmented in ways that cannot be repaired later.
Predictable sampling behavior
Good tracing behaves consistently under load. Sampling decisions should be understandable and repeatable. Engineers should be able to predict which classes of requests will be kept and which will be dropped. Predictable sampling means:
- Similar requests are sampled in similar ways
- Failure paths are not disproportionately lost
- Sampling behavior does not change unexpectedly during incidents
When sampling feels random, trust erodes. Engineers stop relying on traces because they cannot tell whether missing data is meaningful or incidental.
Correlation with infrastructure signals
Traces should align naturally with infrastructure signals such as CPU pressure, memory usage, network latency, and saturation indicators. This alignment allows engineers to connect causal paths to system conditions. Effective correlation enables:
- Linking slow traces to overloaded nodes or pods
- Understanding whether latency comes from contention or dependency waits
- Validating trace behavior against known infrastructure events
Without this correlation, traces explain execution paths but not operating conditions.
Traces available during incidents, not after
During incidents, engineers need traces in real time. Traces that arrive minutes later are useful for postmortems, not for mitigation. This requires:
- Low observability latency under load
- Graceful degradation instead of total trace loss
- Sampling strategies that preserve critical paths during failures
This is the hardest requirement to meet. It is also the one that separates usable tracing from decorative tracing. Good distributed tracing does not promise perfect visibility. It provides dependable visibility. When these capabilities are present, traces become a reliable tool for understanding failures rather than a source of uncertainty.
Example: What Good Tracing Looks Like During a Checkout Failure
Consider a checkout latency incident in a production Kubernetes environment. Payment requests begin slowing down under load. Engineers open tracing immediately. In a well-implemented tracing system, the behavior is predictable and dependable.
- End-to-end continuity: The trace begins at the API gateway and remains intact across order validation, inventory checks, payment authorization, and asynchronous notification dispatch.
- Stable trace identity: Even when payment retries are triggered, all retry attempts remain attached to the same trace ID rather than forming disconnected fragments.
- Predictable sampling: Error-heavy and high-latency requests are retained consistently, ensuring that failure paths remain visible during peak stress.
- Infrastructure alignment: Slow payment spans correlate directly with node-level CPU saturation and elevated network latency on specific pods.
- Low observability latency: Traces appear in near real time, allowing engineers to diagnose contention before the incident escalates.
This is what “good” distributed tracing looks like in practice. Not perfect coverage, but dependable continuity and consistent behavior under load.
Platforms designed around OpenTelemetry-native ingestion, consistent context propagation, and predictable sampling strategies make this outcome achievable. In environments such as CubeAPM deployments, tracing continuity is preserved across synchronous and asynchronous boundaries, sampling remains transparent under load, and infrastructure signals align naturally with span data. The result is tracing that remains usable when systems are under stress.
Where Distributed Tracing Fits in an Observability Strategy
Distributed tracing plays a specific role in an observability strategy. It is not a general monitoring system and it is not a substitute for metrics or alerts. Treating it as either leads to disappointment. Tracing is most effective when it is positioned correctly. It amplifies understanding after a problem is detected.
Tracing is a diagnostic amplifier, not a replacement for monitoring
Monitoring detects that something is wrong. Metrics surface changes in latency, error rates, throughput, and saturation. Alerts trigger a response. Dashboards show scope and impact. Tracing does not replace any of that. It comes into play after detection. Once an issue is identified, tracing helps answer:
- Which execution paths are affected
- Which dependencies are involved
- Where requests block, retry, or fail
This is why tracing works best during investigation, not detection. It accelerates root cause analysis by narrowing attention to the paths that matter.
Tracing is most valuable when infrastructure and application signals align
Tracing alone explains execution, not operating conditions. Its value increases when it is viewed alongside infrastructure and runtime signals. CPU pressure, memory contention, network latency, and queue depth provide the context needed to interpret traces correctly. Alignment enables engineers to:
- Connect slow traces to saturated resources
- Distinguish dependency latency from resource contention
- Validate whether a trace reflects a systemic issue or an isolated case
When infrastructure and application signals are aligned, tracing turns from a visualization tool into an explanatory one. In a mature observability strategy, tracing sits between detection and diagnosis. It does not replace other signals. It sharpens them.
Distributed Tracing with CubeAPM
The screenshot below shows a single checkout request traced across multiple services in CubeAPM.
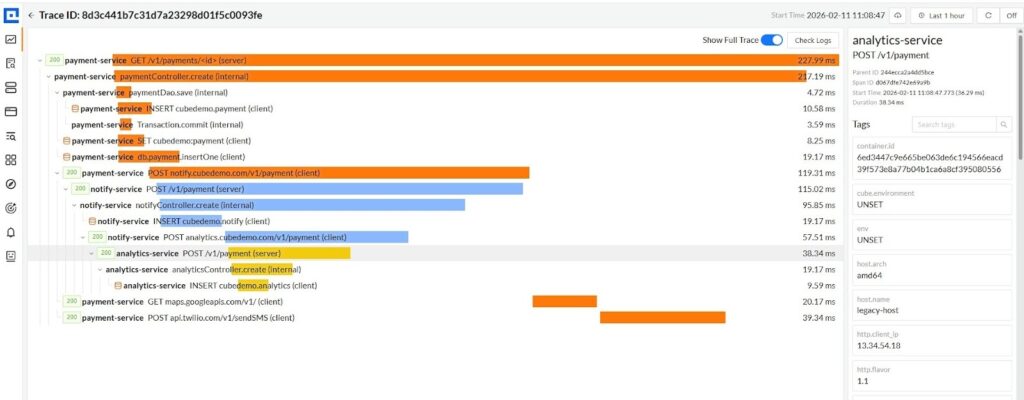
The screenshot above shows a single payment request traced end-to-end across payment-service, notify-service, and analytics-service. From the root span in payment-service, the trace expands into:
- Internal controller and DAO execution
- Database writes (INSERT cubedemo.payment, insertOne)
- Outbound calls to notify-service and analytics-service
- External dependencies such as Google Maps and Twilio
All spans share the same trace ID and are connected through preserved context propagation. The parent-child tree makes execution dependencies explicit across service boundaries. Where most systems fail is not visualization, but sampling strategy.
Head-based sampling limitation
In head-based sampling, the decision to retain or drop a trace is made at the root span. If the request is not selected at ingress, the entire distributed trace is lost, even if a downstream service later throws an exception. You keep complete traces, but often the wrong ones.
Tail-based sampling limitation
Tail-based sampling attempts to retain traces after detecting abnormal behavior. In distributed systems, spans originate from different machines and services.
By the time a downstream failure is detected, earlier spans may not be available consistently, especially under load. Retention becomes infrastructure-sensitive and complex.
CubeAPM Smart Sampling Approach: Overcoming Limitations of Head/Tail-Based Sampling
CubeAPM does not perform sampling at the application boundary.
- All spans from all services are sent to CubeAPM
- Sampling decisions are made centrally
- Decisions are made with full visibility of the entire trace
Because CubeAPM is self-hosted or deployed inside the customer’s cloud, spans from payment-service, notify-service, and analytics-service arrive with minimal transfer overhead. Once the full trace context is available, CubeAPM can evaluate it holistically.
If an exception occurs in notify-service (blue), CubeAPM already has spans from payment-service (orange) and analytics-service (yellow). The system can retain the entire distributed trace consistently. This eliminates two common distributed tracing failure modes:
- Losing critical traces due to early sampling
- Fragmented traces caused by independent sampling across services
What you see in the screenshot is a coherent execution narrative across multiple services and external dependencies. That coherence is the result of centralized sampling with full-system awareness. In distributed architectures, sampling location determines trace reliability. CubeAPM’s Smart Sampling keeps the decision point where complete context exists, not where context is incomplete.
Conclusion: Traces Explain Failures Only If the System Can See Them
Distributed tracing fails most often for systemic reasons, not because teams configured it incorrectly. In production environments, trace loss usually reflects architectural constraints, load behavior, and infrastructure dynamics rather than missing instrumentation.
Visibility depends on where tracing lives in the system. Sampling strategy, proximity to workloads, pipeline capacity, and failure handling all shape what can be seen during normal operation and during incidents. When these factors are not designed intentionally, traces arrive late, arrive partially, or do not arrive at all.
Distributed tracing works best when it is treated as a first-class signal. That means designing for it, operating it close to the systems it observes, and accounting for how it behaves under stress. When tracing is added as an afterthought, it becomes unreliable at the exact moments it is needed most. When systems can see clearly under failure, traces become explanations instead of artifacts.
Disclaimer: The information in this article reflects the latest details available at the time of publication and may change as technologies and products evolve.
FAQs
1. Is distributed tracing useful for low-traffic or internal services?
Yes. Distributed tracing is often more useful in low-traffic or internal systems because individual requests matter more. In these environments, a single slow or failed request can block workflows, pipelines, or operators. Tracing helps explain exactly how that request was executed, even when aggregate metrics look normal.
2. How does distributed tracing differ from request logging?
Request logging records events observed by a service. Distributed tracing reconstructs how a request flowed across multiple services and dependencies. Logs answer what a component saw. Distributed tracing explains how components interact. In observability, tracing provides a structural context that logs alone cannot infer.
3. Can distributed tracing work without full instrumentation across all services?
Partially. Distributed tracing still provides value with incomplete instrumentation, but gaps reduce its reliability. Missing services, libraries, or async boundaries break context propagation and fragment traces. For distributed tracing in observability, consistency matters more than coverage depth. Partial traces explain less and mislead more.
4. Does distributed tracing increase production overhead?
Yes, but predictably. Distributed tracing adds CPU, memory, and network overhead proportional to span volume, sampling strategy, and export frequency. Overhead becomes significant when traces are collected indiscriminately or when sampling decisions are poorly aligned with traffic patterns. Well-designed tracing systems trade completeness for controlled overhead.
5. When should teams invest in distributed tracing as part of observability?
Teams should invest in distributed tracing once systems become distributed enough that request behavior cannot be explained by metrics alone. This typically happens when services depend on multiple downstream components, async workflows increase, or failures become non-obvious. Distributed tracing in observability is most valuable when diagnosing why failures happen, not just detecting that they happened.
6. How does distributed tracing work with Kubernetes?
Distributed tracing in Kubernetes works by propagating a trace ID across services running in different pods. Each service records spans as the request moves through the cluster, and those spans are exported via OpenTelemetry collectors or agents. Kubernetes metadata like pod name, namespace, and node are attached to spans, making it easier to correlate request behavior with dynamic infrastructure changes such as scaling or rolling deployments.


