PHP application monitoring tools empower teams to keep their PHP applications running optimally, especially when PHP still powers a staggering 73.5% of all websites with a known server-side language. With WordPress and PHP ecosystem growing exponentially, monitoring performance, pinpointing errors, and ensuring smooth user experiences are non-negotiable.
Yet, choosing the right PHP application monitoring tool isn’t easy due to overwhelming pricing models, low deployment flexibility, fragmented insights across logs, traces, and metrics, and limited troubleshooting support. Many APM solutions either lock businesses into closed ecosystems or charge exorbitantly as data volume grows.
CubeAPM is the best PHP application monitoring tool provider designed with modern PHP ecosystems in mind. It delivers full-stack observability with native OpenTelemetry support, real-time traces, actionable alerts, self-hosted and SaaS deployment options, and responsive support. In this article, we’re going to cover the top PHP application monitoring tools.
Top 8 PHP Application Monitoring Tools
- CubeAPM
- Datadog
- New Relic
- Dynatrace
- BetterStack
- Atatus
- Instana
- ManageEngine Applications Manager
What Is a PHP Application Monitoring Tool?
A PHP application monitoring tool is software that continuously tracks how PHP applications perform in real time. It captures application traces, database queries, error events, infrastructure health, and even frontend user interactions. The goal is to provide full visibility into how requests flow through the stack, where bottlenecks appear, and how users are experiencing the application.
For businesses, the benefits are clear: higher uptime, reduced mean time to resolution (MTTR), optimized resource costs, and better customer experiences. Teams can identify slow endpoints, misconfigured databases, or memory leaks before they impact end users. This proactive approach prevents revenue loss and strengthens user trust.
Example: Real-Time PHP Performance Insights with CubeAPM
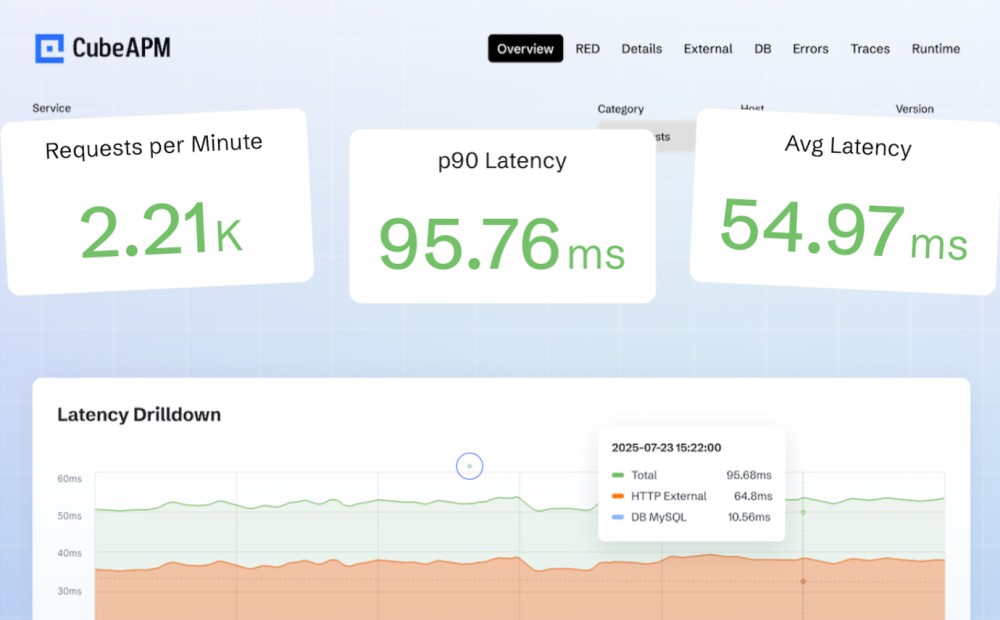
CubeAPM makes PHP monitoring seamless by giving developers real-time visibility into application performance. When a PHP app is instrumented with OpenTelemetry, CubeAPM automatically displays latency, error rates, and throughput in live dashboards.
Teams can dive into distributed traces to quickly locate slow SQL queries, failed API calls, or memory bottlenecks, and then correlate these issues with logs, infrastructure metrics, and real user sessions. With integrated error tracking, RUM, and synthetic monitoring, CubeAPM unifies critical signals in one place—helping DevOps teams resolve problems faster while keeping costs predictable with flexible deployment options.
Why Teams Choose Different PHP Application Monitoring Tools
Cost predictability (and avoiding “bill shock”)
PHP teams often start with a popular APM and later discover layered charges: per-host APM licenses, per-GB logs, separate fees to index logs, high-water-mark billing, synthetic/RUM add-ons, and long-term retention surcharges. Engineers on Reddit repeatedly call out unpredictable, fast-rising bills when traffic or telemetry volume spikes, prompting evaluations of alternatives with simpler, usage-based pricing.
Independent guides and newsletters echo the same: Datadog’s pricing stacks across modules (APM, infra, logs, synthetics), with APM starting per-host and additional metering for data features—costs that can escalate for microservices and PHP apps with chatty logs.
OpenTelemetry-first instrumentation for PHP
Many teams want an open, vendor-neutral path for PHP instrumentation so they can switch tools without reinstrumenting. OpenTelemetry’s PHP client and stability guidance have matured steadily; buyers now weigh how well a vendor accepts native OTEL traces/metrics/logs and whether it imposes an “OTEL tax” or requires proprietary agents (G2 Reviews).
Deep data correlation
PHP bottlenecks are rarely one-dimensional: a slow Laravel controller might hinge on a MySQL query, Redis miss, or third-party API. Teams look for first-class correlation—clicking from a slow PHP span to related logs, host/container metrics, and even real-user sessions—to cut MTTR. Practitioner reviews emphasize that platforms differ widely in how seamlessly they link these signals.
PHP agent reliability & ecosystem fit (FPM, Apache/Nginx, Laravel)
Pragmatic concerns matter: PHP-FPM compatibility, extension stability, and ease of installing/upgrading agents at scale. Community threads document agent install/upgrade friction and edge-case behaviors (e.g., PHP-FPM child restarts, noisy error floods after agent updates). Teams balancing zero-downtime deploys with blue/green or containerized PHP often shortlist tools proven with Laravel/Symfony pipelines
Kubernetes & multi-cloud readiness for PHP backends
As PHP services move behind Ingress + PHP-FPM pods, buyers want automatic service discovery, container-level context, and support for ephemeral workloads across AWS/GCP/Azure. Independent reviews position certain platforms as stronger for large, distributed estates (auto-discovery, topology maps, AI-driven RCA), while cautioning about learning curves and enterprise-grade pricing (Gartner APM Magic Quadrant 2025).
Deployment and compliance options (SaaS, self-hosted, hybrid)
Regulated teams (finserv, healthcare, gov) frequently require data residency and self-hosting to meet policy or localization laws—this alone can disqualify cloud-only APMs. Vendor materials that highlight on-prem/hybrid deployment and keeping telemetry inside your cloud are often the deciding factor for PHP platforms processing PII or payments.
Noise control, sampling, and cardinality management
High-throughput PHP apps (checkout, search, CMS at scale) can generate massive events. Teams compare how vendors handle dynamic sampling, cardinality guardrails (labels/tags), and alert tuning to reduce false positives without losing critical context. Community advice often includes moving to OTEL pipelines to cut volume and cost while preserving actionable data.
Usability and time-to-value for PHP teams
Even feature-rich tools can slow teams if dashboards and query languages are hard to learn. Reviews note steep learning curves and the need for careful alert hygiene; buyers therefore test for fast onboarding (e.g., PHP auto-instrumentation, Laravel presets), good defaults, and dev-friendly troubleshooting.
End-user experience coverage (RUM + Synthetic) for PHP sites
APM alone isn’t enough: high-traffic PHP sites also need RUM to see Core Web Vitals and synthetic checks for uptime/flows. Pricing and retention for these add-ons vary widely across vendors, so teams evaluate whether RUM/synthetics are first-class and affordable or siloed behind separate SKUs.
Top 8 PHP Application Monitoring Tools
1. CubeAPM
Overview
CubeAPM is an OpenTelemetry-native observability platform designed to give PHP teams full visibility into application performance with seamless tracing, logging, and error tracking. It is widely recognized for its predictable pricing model, on-prem deployment option, and ability to unify multiple monitoring signals—making it a strong fit for PHP teams handling large-scale, high-traffic applications.
Key Advantage
Smart sampling and cost-predictable pricing make CubeAPM stand out for PHP teams needing reliable insights without runaway bills.
Key Features
- OpenTelemetry support: Collects PHP traces and metrics directly through OTel instrumentation.
- Distributed tracing: Tracks PHP request flows, database queries, and external API calls in detail.

- RED dashboards: Built-in latency, error rate, and throughput views highlight slow transactions instantly.
- Cross-signal correlation: Links traces with logs, infrastructure metrics, and user sessions for faster root cause analysis.
- Error tracking: Captures exceptions and stack traces from PHP services in real time.
Pros
- OpenTelemetry-native and compatible with Prometheus, New Relic, Datadog agents
- Self-host option with data residency and zero egress costs
- Unified MELT coverage: APM, logs, infra, RUM, synthetics, errors
- 800+ integrations across DevOps, cloud, and monitoring ecosystems
- Built-in dashboards with fast trace-to-root-cause analysis
Cons
- Less suited for teams seeking a pure SaaS/off-prem solution
- Focused on observability only, without built-in cloud security management features
CubeAPM Pricing at Scale
CubeAPM uses a transparent pricing model of $0.15 per GB ingested. For a mid-sized business generating 45 TB (~45,000 GB) of data per month, the monthly cost would be ~$7,200/month.
*All pricing comparisons are calculated using standardized Small/Medium/Large team profiles defined in our internal benchmarking sheet, based on fixed log, metrics, trace, and retention assumptions. Actual pricing may vary by usage, region, and plan structure. Please confirm current pricing with each vendor.
Tech Fit
Best for PHP applications running on frameworks like Laravel, Symfony, Magento, and WordPress, especially in containerized or hybrid environments. Strong integration with OpenTelemetry, Kubernetes, MySQL, Redis, and Nginx/Apache makes it a fit for modern PHP stacks.
2. Datadog
Overview
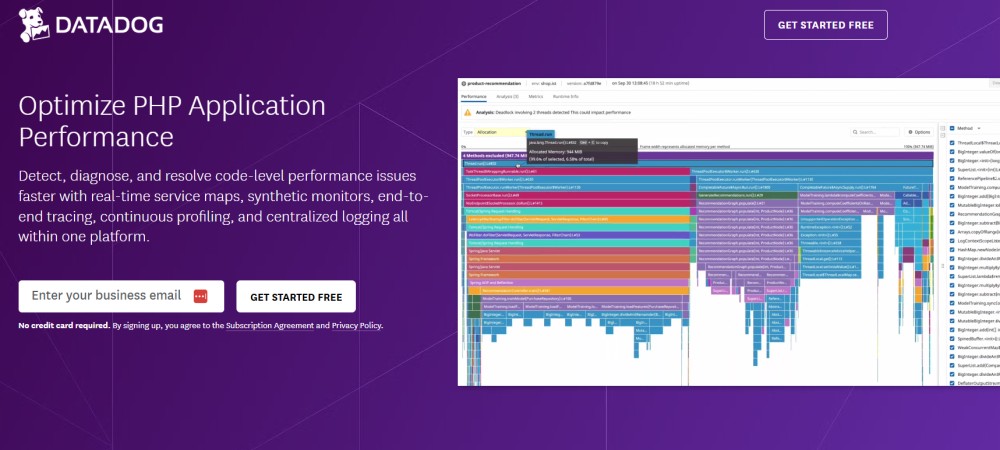
Datadog is one of the most widely used application monitoring platforms and offers a mature PHP agent with automatic instrumentation for frameworks like Laravel, Symfony, and CodeIgniter. It is known for its deep ecosystem of integrations, strong dashboards, and the ability to correlate PHP application performance with infrastructure, logs, and security insights. For PHP teams, Datadog provides comprehensive visibility into requests, errors, and system resources.
Key Advantage
Comprehensive ecosystem and out-of-the-box integrations, making it easy for PHP teams to monitor applications alongside infrastructure and security signals in one platform.
Key Features
- Automatic PHP instrumentation: Captures requests, database queries, and external calls with minimal setup.
- PHP-FPM monitoring: Provides metrics for request throughput, latency, and errors in PHP-FPM environments.
- Code-level visibility: Tracks transaction traces to identify slow functions, queries, and external API dependencies.
- Security monitoring for PHP: Detects common vulnerabilities and threats in real-time with AppSec integration.
- Unified platform: Combines APM with logs, infrastructure metrics, and synthetics in a single dashboard.
Pros
- Mature PHP agent with automatic tracing and rich documentation
- Huge integration ecosystem (600+ tools, cloud services, and databases)
- Strong visualization and custom dashboarding for PHP teams
- Combines APM with security, RUM, logs, and infra in one product
Cons
- Pricing complexity with separate charges for hosts, traces, errors, synthetics, and log volumes
- Self-hosting is not available
Datadog Pricing at Scale
Datadog charges differently for different capabilities. APM starts at $31/month; infra starts at $15/month; logs start at $0.10/GB, and so on.
For a mid-sized business ingesting around 45 TB (~45,000 GB) of data per month, the cost would come around $27,475/month.
Tech Fit
Best suited for PHP teams running large-scale, cloud-native environments that want APM tightly coupled with infrastructure, security monitoring, and log analytics. Strong for organizations with complex multi-service deployments, but often overkill and expensive for smaller PHP shops.
3. New Relic

Overview
New Relic is a widely adopted APM platform with a mature PHP agent that auto-instruments popular frameworks and surfaces application performance, errors, databases, and external dependencies in unified views. It pairs PHP APM with dashboards, logs-in-context, browser monitoring, and “Instant Observability” quickstarts for faster setup.
Key Advantage
A polished PHP agent plus a large ecosystem of quickstarts/integrations that accelerate troubleshooting and onboarding for PHP teams.
Key Features
- Automatic PHP instrumentation: Captures transactions, database calls, and external requests with minimal code changes.
- PHP-FPM & runtime visibility: Monitors throughput/latency/errors for PHP-FPM and correlates with backend dependencies.
- Logs in context: Forwards PHP logs with trace context to speed up root-cause analysis.
- Browser/RUM integration: Injects browser scripts from the PHP agent for end-user performance tracking.
- Instant Observability: Ready-made PHP quickstarts and dashboards to jump-start monitoring.
Pros
- Mature PHP agent with automatic tracing and a deep docs ecosystem
- 780+ quickstarts/integrations to cover common stacks and services
- Unified platform for APM, logs, browser monitoring, synthetics, and infra
- Flexible agent API for custom instrumentation in PHP
Cons
- Multi-factor pricing (data ingest, users, optional compute tiers) can be complex to forecast
- No self-hosting
New Relic Pricing at Scale
New Relic’s billing is based on data ingested, user licenses, and optional add-ons. The free tier offers 100 GB of ingest per month, then it costs $0.40 per GB after that. For a business ingesting 45 TB of logs per month, the cost would come around $25,990/month.
Tech Fit
Well-suited for PHP teams that want a feature-rich, all-in-one platform with quickstarts and strong ecosystem coverage, particularly when pairing PHP with browser monitoring, logs-in-context, and cloud infrastructure views. Ideal for organizations that value polished workflows and broad capabilities, and are comfortable with usage-based, multi-component pricing.
4. Dynatrace
Overview
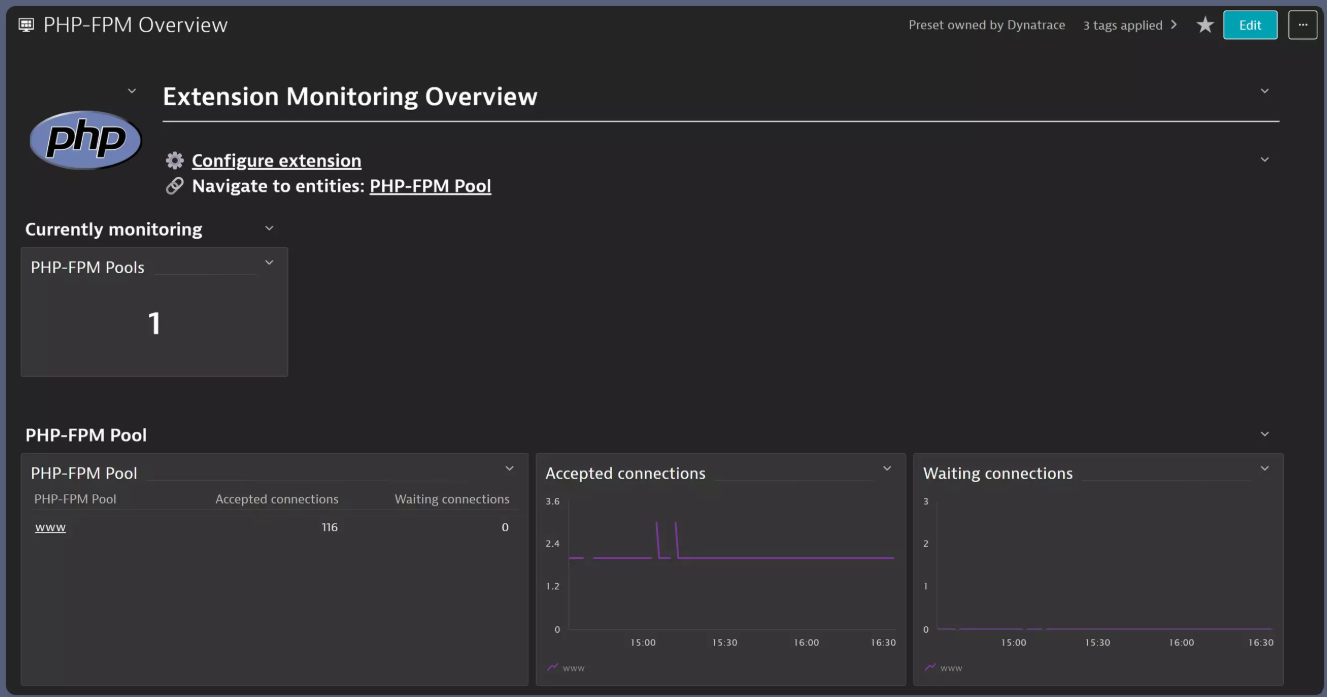
Dynatrace offers enterprise-grade PHP monitoring via OneAgent with automatic instrumentation across Linux and Windows (Apache mod_php, PHP-FPM, PHP-CGI), pairing code-level visibility with infrastructure and Kubernetes context. Its PurePath® tracing stitches end-to-end PHP requests and works alongside OpenTelemetry when needed.
Key Advantage
High-fidelity PurePath® tracing plus automatic discovery give PHP teams deep, end-to-end insight with minimal manual setup.
Key Features
- Automatic PHP instrumentation: OneAgent auto-instruments PHP on Apache/Nginx, Windows, and Linux for transactions, services, and dependencies.
- PHP-FPM visibility: Tracks connections, slow requests, worker processes, and health via the PHP-FPM status endpoint.
- PurePath distributed tracing: Captures end-to-end traces and can merge OpenTelemetry spans for full request context.
- Database & cache insight: Surfaces SQL statements/metrics and common caching tech (Redis, Memcached) in PHP flows.
- Profiling & diagnostics: Full-stack mode includes CPU/memory profiling and detects restarts, crashes, and deployments.
Pros
- Automatic discovery and tracing reduce manual instrumentation
- Strong fit for Kubernetes and hybrid/multi-cloud environments
- Real-time, high-granularity telemetry with mature dashboards
- Broad ecosystem with RUM, synthetics, logs, metrics, and AppSec in one platform
Cons
- Pricing can add up as you combine traces, logs, RUM, synthetics, and host monitoring
- Requires OneAgent deployment and can have a learning curve for new teams
Dynatrace Pricing at Scale
Dynatrace charges:
- Full stack: $0.01/8 GiB hour/month or $58/month/8GiB host
- Log Ingest & process: $0.20 per GiB
For a 45 TB (~45,000 GB/month) volume, the cost would be $21,850/month.
Tech Fit
Well-suited to PHP teams running containerized or hybrid estates that need automatic discovery, deep tracing, PHP-FPM health, and tight correlation across infra, logs, RUM, and synthetics—especially in complex, high-traffic environments.
5. Better Stack
Overview
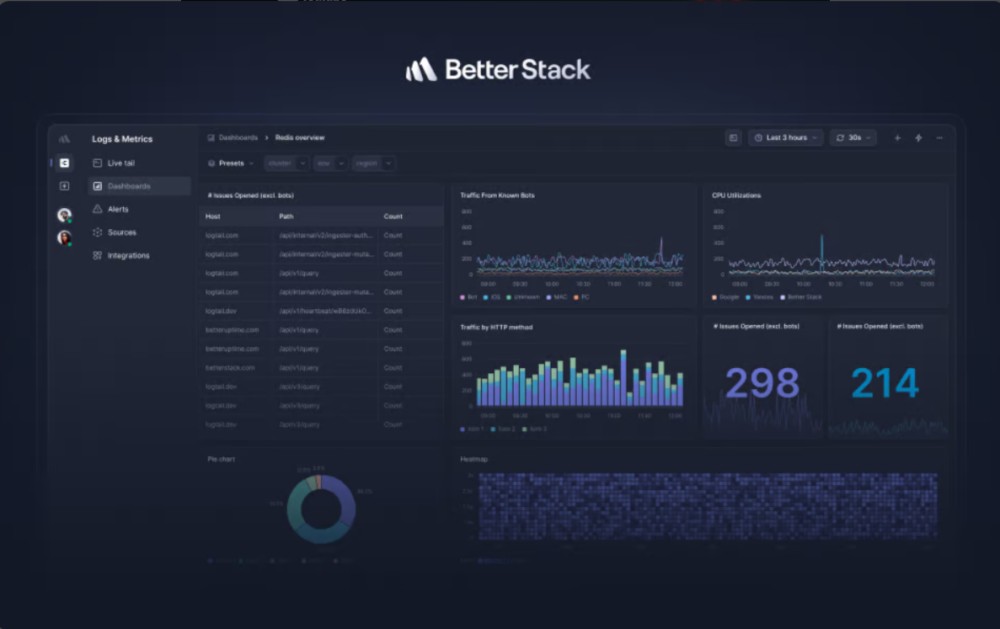
Better Stack combines log/trace/metric ingest with uptime & incident management, giving PHP teams a log-centric path to observability plus OpenTelemetry-based metrics/traces and clean dashboards. It offers quick Laravel/Symfony setup via a Monolog handler and OTel guides tailored to PHP.
Key Advantage
Fast PHP onboarding (Monolog/Logtail + OTel) with unified logs, traces, metrics, uptime checks, and incidents in one workspace.
Key Features
- PHP logging via Monolog/Logtail: Add the Logtail handler and start shipping structured PHP logs (Laravel/Symfony supported).
- OpenTelemetry metrics for PHP: Step-by-step Laravel guide to emit counters, gauges, histograms and visualize them.
- Traces & correlation: Ingest traces alongside logs and pivot with drag-and-drop filtering/SQL/PromQL.
- Uptime & transaction monitoring: Synthetic checks, heartbeats, and incident routing tie production issues to telemetry.
- Dashboards & querying: Live tail, schema-less storage, VRL/JS transforms, SQL queries for PHP troubleshooting.
Pros
- Quick PHP setup with Laravel/Symfony docs and examples
- OTel-native metrics/traces plus strong log UX
- Integrated uptime, status pages, and incident management
- Clean dashboards with SQL/PromQL and live tail
- Good entry bundles with included log retention
Cons
- No self-hosting
- Steep cost spike from free to paid
Better Stack Pricing at Scale
- Free tier: Includes 10 monitors, 1 static page, 3 GB logs (3-day), 2B metrics points (30-day), 1 or more responders using Slack/phone/SMS.
- Paid plans: Start at $29/user/month, including one responder license and unlimited users, with bundles for telemetry and incident capabilities.
Teams ingesting 42 TB of data monthly can end up paying $20,550/month.
Tech Fit
Best for PHP teams that want log-centric observability with OTel metrics/traces, fast Laravel/Symfony onboarding, and built-in uptime/incident workflows—ideal for small to mid-sized teams or startups that prefer one workspace for logs + checks + incidents, and don’t need deep, code-level APM profiling.
6. Atatus
Overview
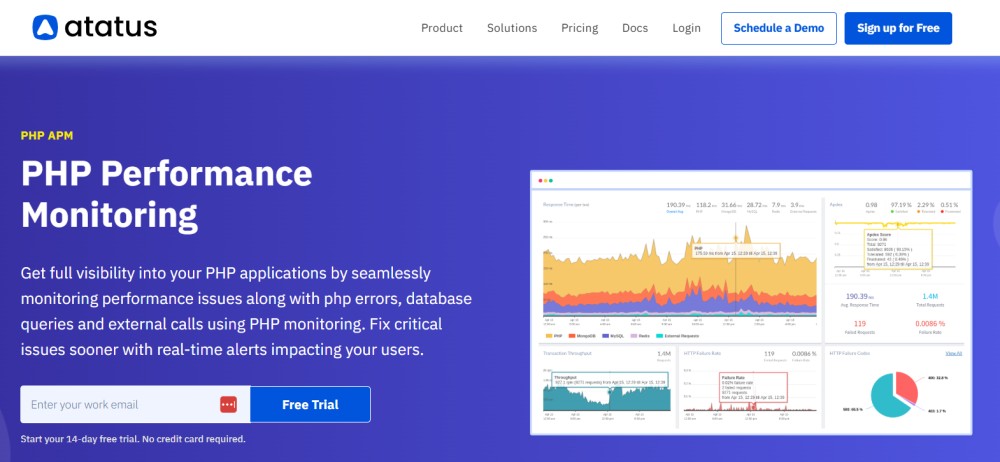
Atatus is a PHP-focused APM and observability platform that auto-instruments popular frameworks (Laravel, Symfony, WordPress) and surfaces transactions, slow queries, external calls, and errors with minimal code changes. It complements APM with logs, alerting, synthetics, and RUM in one workspace.
Key Advantage
Fast PHP onboarding with no-code agent installs and clear, drill-down traces that tie requests to database calls, external services, and errors.
Key Features
- Automatic PHP instrumentation: Captures transactions, DB calls, and external requests without changing source code.
- Distributed tracing: Follows PHP request lifecycles to pinpoint slow functions and network dependencies.
- Database monitoring: Highlights slow SQL statements and time-consuming queries for tuning.
- Logs in context: Correlates PHP logs with traces/transactions to accelerate root-cause analysis.
- Error tracking & alerting: Captures exceptions with stack traces and sends smart, real-time alerts.
Pros
- Quick Laravel/Symfony/WordPress setup and clear agent docs
- Unified APM, logs, RUM, synthetics, infra in one platform
- Logs-in-context and service maps improve PHP debugging speed
- No per-user limits; multiple products available à la carte
Cons
- Host-hour APM plus $/GB log ingestion can get pricey at high volume c
- SaaS-centric; lacks a self-host/on-prem option for strict data-residency needs
Atatus Pricing at Scale
Atatus pricing is listed as $0.07 per host-hour (annual) / $0.096 (monthly) for APM and $2/GB (annual) / $2.5/GB (monthly) for logs. With a mid-sized company ingesting 10 TB/month (10,000 GB) of PHP logs/traces, the log ingestion cost alone would be $20,000/month on annual pricing (or $25,000/month on monthly billing). APM host-hour charges would add on top depending on the number of servers monitored.
Tech Fit
A strong fit for PHP product teams that want fast agent setup, clear request/DB visibility, and logs-in-context—plus optional RUM, synthetics, and infra—without stitching multiple tools together. Works well for Laravel/Symfony/WordPress apps that need straightforward APM and operational simplicity.
7. IBM Instana
Overview
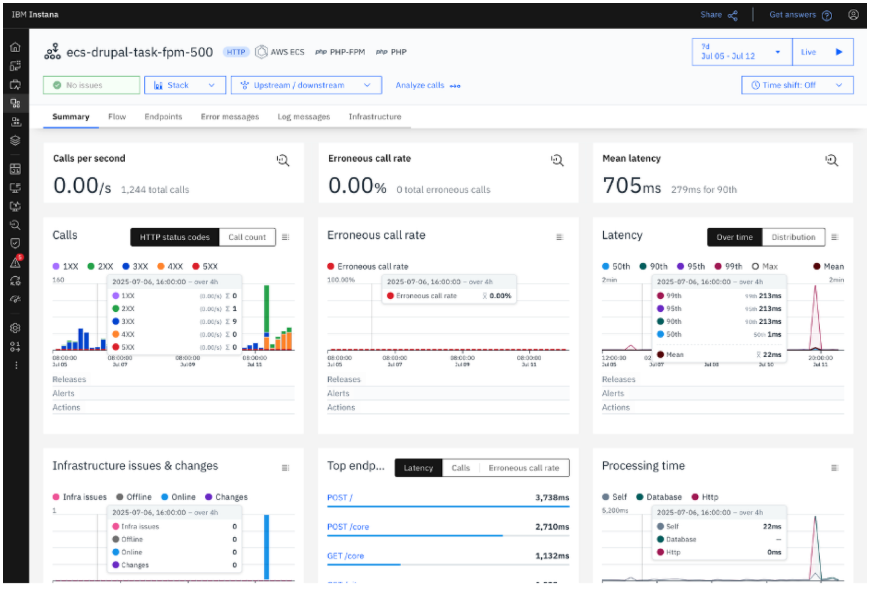
IBM Instana provides automated PHP monitoring with end-to-end tracing, real-time metrics (latency, error rate, RPS), and automatic discovery across Linux and Windows (including recent Windows Server support) plus container/serverless targets like AWS Fargate.
Key Advantage
Automatic discovery and high-fidelity, near-real-time telemetry give PHP teams immediate visibility from web entry points through PHP-FPM/CGI to backend services—without heavy manual setup.
Key Features
- Automatic PHP detection: Instana discovers PHP services and begins capturing latency, error rate, and requests per second.
- Distributed tracing: End-to-end traces across PHP, databases, caches, and external calls; merges seamlessly into Instana’s dependency map.
- PHP-FPM & runtime visibility: Observes worker pools, accepted connections, and slow requests for PHP-FPM workloads.
- Windows & Fargate support: Newer releases add Windows Server support for PHP and first-class monitoring on AWS Fargate.
- Constraints documented: Clear notes on unsupported edge scenarios (e.g., aarch64 Windows, multiple tracers simultaneously).
Pros
- Fast auto-discovery and topology mapping for complex PHP estates
- Strong fit for Kubernetes, containers, and hybrid/multi-cloud
- Near-real-time metrics with mature dashboards and dependency views
- Broad platform coverage, including browser, infra, and services
Cons
- Pricing/licensing can be complex (per-host plus possible per-GB components)
- Learning curve for smaller teams
Instana Pricing at Scale
IBM Instana uses a Managed Virtual Server (MVS) licensing model, with published tiers for Essentials, Standard plans, and on-demand plans:
- Essentials: $20/MVS/month (infra)
- Standard: $75/MVS/month (full-stack monitoring)
- On-demand: $20/MVS/month (extra for logs and retention); pay-per-use: $0.03/MVS hour/month
For 45 TB of ingestion, an organization may pay $17,375/month.
Tech Fit
A strong fit for enterprise PHP stacks running in containers or hybrid environments that benefit from automatic discovery, rich dependency maps, and near-real-time telemetry—especially where Windows or Fargate support matters.
8. ManageEngine Applications Manager
Overview
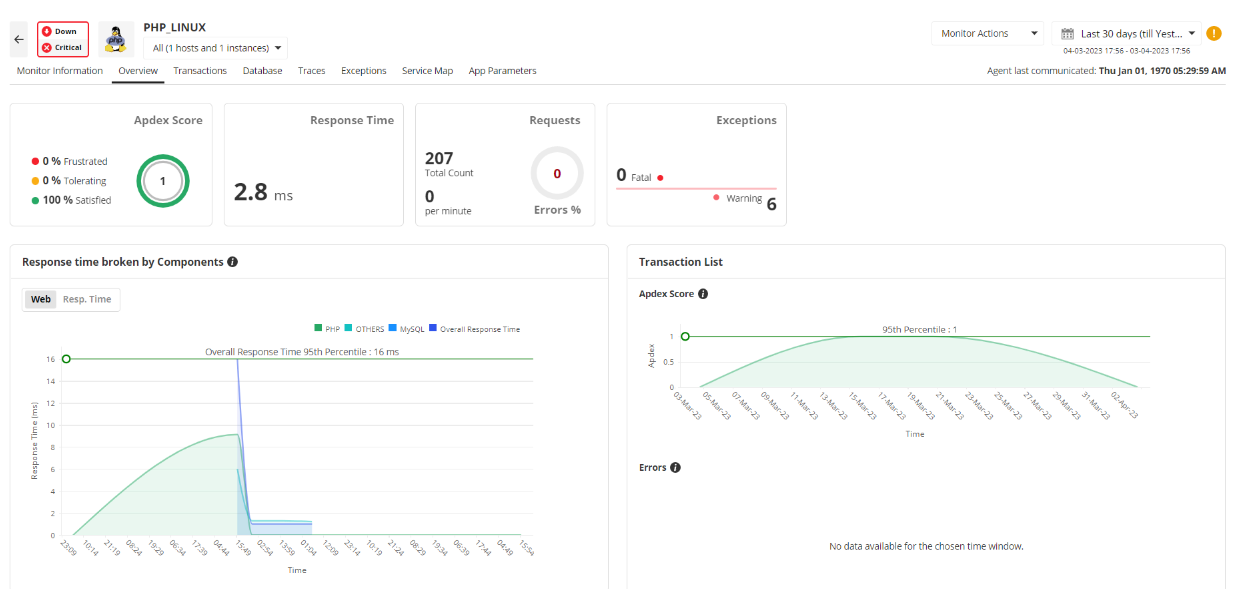
ManageEngine Applications Manager (APM Insight for PHP) provides agent-based PHP monitoring that captures transactions, response times, throughput, exceptions, slow queries, and end-user experience (Apdex) while correlating with server and infrastructure health. It supports PHP-FPM and offers guided setup for Linux/Windows web servers.
Key Advantage
Monitor-count licensing with an add-on PHP agent can be cost-effective for teams that prefer fixed, host/monitor-based pricing instead of per-GB ingest, especially when data volumes fluctuate.
Key Features
- APM Insight PHP agent: Deployed on the web server; ships app metrics every 60 seconds for end-to-end web-transaction visibility.
- Transaction & error analytics: Track response time, throughput, exceptions, and Apdex to pinpoint regressions quickly.
- PHP-FPM/server metrics: Observe busy/idle workers, slow requests, bytes transferred, availability, and response time.
- Framework/runtime coverage: Guided setup for adding PHP monitors via UI/REST; supports Linux/Windows deployments.
- Infra & multi-technology view: Combine PHP APM with DB, server, and multi-cloud monitors in one console.
Pros
- Straightforward, guided PHP agent setup and UI
- Fixed licensing by monitors/agents can simplify budgeting
- Combines app, DB, server, and cloud monitoring in one tool
- Useful PHP-FPM and availability metrics out of the box
Cons
- Not usage/GB-priced; scaling breadth (monitors, modules) drives cost
- Limited features and complexity
ManageEngine Pricing at Scale
ManageEngine Applications Manager uses monitor- and agent-based pricing rather than per-GB. Public pricing starts around $1,195/year (Professional) or $1,795/year (Enterprise) for the APM Insight PHP Agent, with 100 monitors priced at approximately $3,195/year (Professional) or $3,995/year (Enterprise).
Example scenario (mid-sized PHP estate):
- 1 × APM Insight PHP Agent (Enterprise): $1,795/year
- 100 monitors (Enterprise tier): $3,995/year
- Approximate total: $5,790/year (~$482/month), before optional add-ons like EUM or extra monitor packs.
Tech Fit
Best for operations-centric PHP teams that want APM plus broad infrastructure/database/cloud monitoring under a single license, value monitor-based pricing, and need PHP-FPM/server insights alongside application transactions and end-user metrics.
How to Choose the Right PHP Application Monitoring Tool
Prioritize OpenTelemetry-first PHP instrumentation
Pick a platform that ingests native OTEL traces/metrics/logs for PHP (not just proprietary agents). This lets you switch vendors without reinstrumenting legacy Laravel/Symfony apps and adopt the new zero-code PHP auto-instrumentation model to cut rollout time.
Demand deep, click-through correlation
Real PHP issues span a slow controller, a chatty MySQL query, and a noisy container. Favor tools where you can jump from a slow PHP span to related logs and host/container metrics, and, when needed, to RUM for Core Web Vitals—without manual stitching.
Validate PHP agent reliability in your runtime (FPM, Nginx/Apache, Laravel)
Shortlist vendors with proven stability for PHP-FPM pools, opcode cache nuances, and Laravel middleware. Check community feedback for agent upgrade friction and FPM child process edge cases before you roll into prod.
Model total cost of ownership, not list price
APM costs often combine per-host APM, per-GB logs, RUM/synthetics add-ons, and retention surcharges. Reviewers and practitioners warn of “bill shock” when traffic/telemetry spikes; pressure-test pricing with your PHP workload (peak traffic, log verbosity, 95/99th percentiles).
Check Kubernetes & multi-cloud readiness for containerized PHP
If you run PHP-FPM behind Ingress on EKS/GKE/AKS, you’ll want auto-discovery, pod-level context, and ephemeral workload support. Favor platforms that emphasize full-stack observability across K8s layers (cluster, pod/container, app) with context-aware alerting.
Require flexible deployment for compliance (SaaS, self-hosted, hybrid)
E-commerce and fintech PHP stacks often face GDPR data-residency or PCI DSS obligations. Choose vendors that support self-hosting or hybrid and offer clear guidance on log/trace retention, data locality, and auditability.
Evaluate noise control: adaptive sampling & cardinality guardrails
High-throughput PHP apps (checkout, CMS, search) flood telemetry. Look for dynamic/tail-based sampling and label/cardinality controls that reduce noise while preserving root-cause context—so SREs can trust alerts without overspending.
Measure time-to-value for PHP teams
Hands-on teams want auto-instrumentation, Laravel presets, trace waterfalls, DB span details, and sensible default dashboards. Scan recent user reviews for learning curve and onboarding friction before committing.
Include end-user experience (RUM) and proactive checks (Synthetics)
PHP powers public websites; your tool should pair server-side insights with RUM for Core Web Vitals and synthetic monitors for uptime and transactional flows. Ensure these aren’t pricey, siloed add-ons.
Conclusion
Choosing the right PHP application monitoring tool can be overwhelming. Teams often face unpredictable pricing, steep learning curves, limited OpenTelemetry support, and tools that don’t unify logs, traces, and metrics. These gaps lead to blind spots, higher costs, and wasted engineering time.
CubeAPM solves these pain points with a transparent pricing model, smart sampling to keep only high-value data, and full-stack coverage from PHP traces to infrastructure, logs, RUM, synthetics, and error tracking. It also offers both SaaS and self-host options, giving teams flexibility and compliance control.
Schedule a free demo with CubeAPM today.
Disclaimer: The information in this article reflects the latest details available at the time of publication and may change as technologies and products evolve.
FAQs
1. What is the difference between a PHP profiler and a PHP application monitoring tool?
A profiler focuses on local code-level analysis (like function calls and memory usage during development), while an application monitoring tool provides continuous, real-time visibility into live PHP applications, including traces, logs, and user experience. CubeAPM, for example, combines profiling-like detail with distributed tracing and logs for end-to-end observability.
2. Can PHP application monitoring tools detect memory leaks or slow queries?
Yes, most modern tools can highlight memory usage, detect long-running SQL queries, and correlate them with specific transactions. CubeAPM makes this easy by linking slow PHP queries directly with traces and logs so teams can spot issues faster.
3. Do PHP monitoring tools support frameworks like Laravel, Symfony, or WordPress?
Yes, leading PHP monitoring tools offer agents or plugins that auto-instrument popular frameworks, making it easy to track transactions, errors, and dependencies without major code changes. CubeAPM is fully compatible with Laravel and Symfony via OpenTelemetry, making onboarding seamless.
4. Are PHP monitoring tools suitable for containerized or Kubernetes environments?
Absolutely. Many APMs support monitoring PHP apps running in Docker, Kubernetes, or hybrid multi-cloud environments, automatically discovering services and correlating metrics with underlying infrastructure.
5. How do PHP monitoring tools help with compliance and data security?
Some platforms provide self-hosting options, data residency controls, and role-based access management, ensuring sensitive PHP application data stays compliant with standards. CubeAPM offers BYOC and on-prem deployment, making it a strong fit for compliance-driven teams.


