Global spend on infrastructure monitoring is projected to reach US$ 6.53 billion in 2025, up from USD 5.91 billion in 2024. It shows how critical visibility into distributed systems has become. With distributed systems, Kubernetes clusters, multi-cloud setups, and microservices powering modern applications, teams need tools that provide real-time visibility into their infrastructure with cost efficiency.
Yet teams face real pain while choosing the right infrastructure monitoring tools due to tool sprawl, fragmented dashboards, alert fatigue, slow mean time to resolution, and unpredictable pricing. These challenges often derail cloud initiatives, overburden MSPs, and strain engineering talent.
CubeAPM is the best infrastructure monitoring tool provider to address these pains. It’s fully OpenTelemetry-native, unifying metrics, logs, and traces (MELT), with smart sampling that tames costs. In this article, we’ll cover top infrastructure monitoring tools based on their features, pricing, pros & cons, tech fit, and more.
Top Infrastructure Monitoring Tools
- CubeAPM
- Datadog
- New Relic
- Dynatrace
- Grafana Cloud
- Splunk Apdynamics
- SigNoz
- Elastic Observability
What Is an Infrastructure Monitoring Tool?
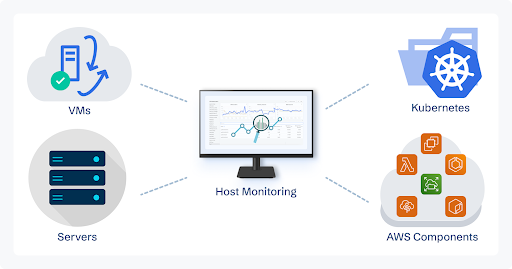
An infrastructure monitoring tool is software that continuously collects, analyzes, and displays telemetry from your IT systems, servers, VMs, containers, networks, databases, and more. Its goal? To give teams a real-time view of performance, anomalies, and system health so they can resolve issues before they escalate. Infrastructure monitoring provides critical visibility to keep your services up and running smoothly.
Example – Preventing Outages and Proactive Problem Solving
Think of an e‑commerce site gearing up for a holiday sale, traffic spikes, and one load balancer node fails. With good infrastructure monitoring, ops teams get an alert before traffic even goes down, enabling fast mitigation and preventing a major outage.
In modern contexts, these tools increasingly include machine learning capabilities to detect unusual patterns (e.g., sudden CPU spikes or dropped database throughput) without requiring a manual rule for every scenario
Why Teams Choose Different Infrastructure Monitoring Tools
Selecting the right infrastructure monitoring solution is far more complex than in years past, and teams are increasingly vocal about the challenges they face. Across forums, buyer’s guides, and industry reports, several key pain points consistently emerge:
1. Cost unpredictability and pricing traps
As infrastructures scale, pricing models based on hosts, data ingest volume, or users often create financial headaches. Many monitoring buyers report seeing costs balloon without warning. One technical blog summarized industry frustration: host‑based pricing becomes “unpredictable behavior and…unfair to both parties”, especially when autoscaling adds hosts dynamically. When alerts spike or logs surge, so does the bill, turning monitoring from a utility into a liability.
2. Tool sprawl, alert fatigue, and operations burnout
Many organizations manage a handful—or even dozens—of monitoring tools, creating fragmented dashboards, overlapping alerts, and confusion. A recent report tells that 60% of MSPs feel heavy burnout, while 44% report reduced productivity—largely due to tool sprawl and insufficient real-time visibility. Amid this chaos, meaningful alerts get lost, engineers dread pager duty, and innovation stalls under the weight of constant firefighting.
3. Legacy architectures colliding with modern infrastructure
Traditional “collect everything” monitoring approaches are crumbling in today’s dynamic environments. Legacy tools were built for static infrastructure and fail to handle today’s containerized, microservices-based systems. A recent TechRadar piece characterized these obsolete strategies as leading to “runaway costs, spiraling complexity, and blind spots that turn small hiccups into full-blown outages”. What once gave peace of mind now overwhelms teams with data landfill, not actionable insights.
4. Siloed telemetry limiting holistic observability
Without seamless correlation between metrics, logs, and traces—or the full “MELT” stack (Metrics, Events, Logs, Traces)—diagnosis becomes slow and manual. Many teams share frustration that unrelated dashboards or data silos turn root cause analysis into hours of inefficient debugging.
5. Vendor lock-in and inflexible instrumentation
Teams embracing cloud-native observability often push for OpenTelemetry-first platforms for vendor neutrality. However, many incumbent tools still require proprietary agents or lock-in, limiting flexibility and complicating future migrations or multi-vendor strategies.
Top 8 Infrastructure Monitoring Tools
1. CubeAPM
Overview
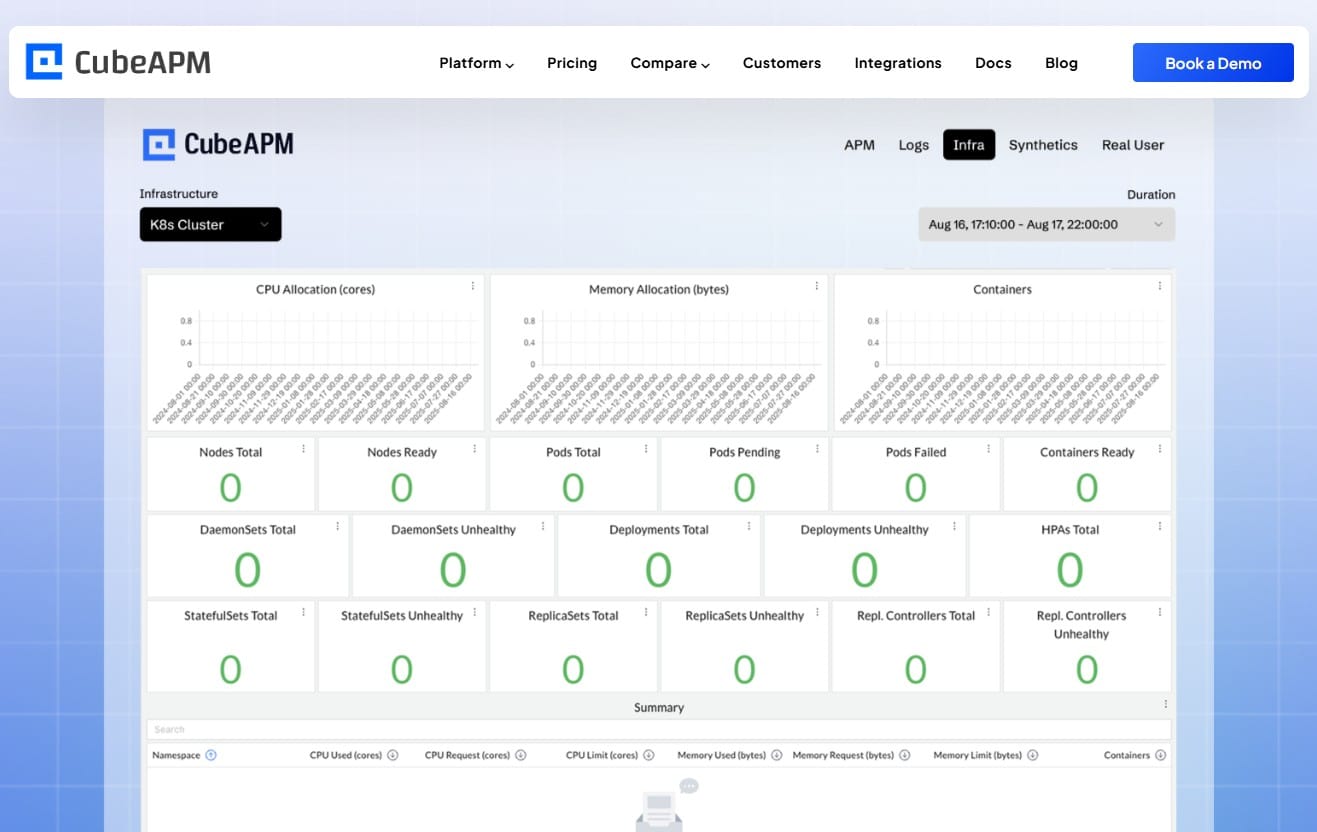
CubeAPM is a modern, OpenTelemetry-native observability platform built for full-stack visibility—from infrastructure to real user monitoring. Its design philosophy centers on efficiency, speed, and clarity. Unlike many vendors that offload telemetry to external cloud servers, CubeAPM processes data locally—resulting in performance that’s 2–4× faster, with infrastructure costs 60–80% lower. The platform offers built-in dashboards, distributed tracing, error tracking, alerts, and SLO monitoring—all under one roof.
Key Advantage
What sets CubeAPM apart is its Smart Sampling engine, which reduces data volume without sacrificing signal. It analyzes context—like deviations in latency or error rates—to selectively retain meaningful telemetry and eliminate noise. This results in higher signal fidelity and dramatically lower processing overhead.
Key Features
- Multiple infra support: Out-of-the-box support for bare-metal/VMs, Kubernetes, AWS CloudWatch, Prometheus metrics, MySQL, MS SQL, Redis, Nginx, Elasticsearch, Kafka, Varnish Cache, and more.
- Distributed Tracing: Visualizes requests across microservices with full context—down to database queries and HTTP response codes with stack traces.
- Built-in Dashboards: Immediately usable charts for latency, error rates, throughput, plus holistic latency breakdowns across dependencies.
- Error management: You can view errors by endpoint and type, trending over time, and understand traces and exception detail as well.
- SLO: You can define SLOs with multi-window and multi-burn-rate alerts (MWMBR) to signal actual risks and with less noise.
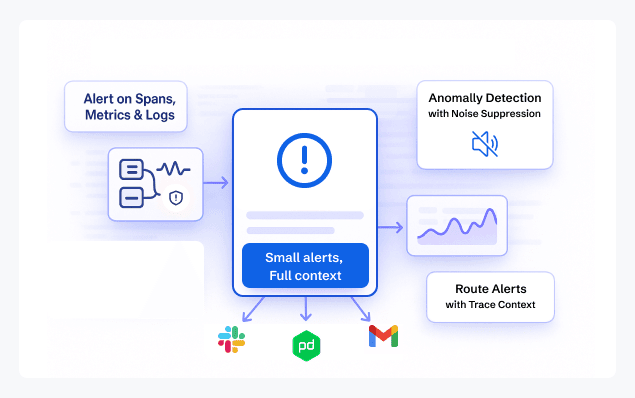
- Rich Alerting: Full-featured alert notifications with trend charts and integrations for Slack, PagerDuty, Google Chat, email, or webhooks.
Pros
- 800+ integration support
- Efficient and cost-effective telemetry processing with Smart Sampling; no egress charges
- Strong OTEL-first compatibility supporting OpenTelemetry, Prometheus, and New Relic agents
- Full-stack visibility with intuitive UX and minimal setup overhead
- Self-hosting capability for compliance, data residency, or performance needs
- Excellent support and responsiveness
Cons
- May not suit teams looking for SaaS-only providers
- No support for cloud security management functionalities; strictly an observability-focused platform
Pricing at Scale
CubeAPM uses a transparent pricing model of $0.15 per GB ingested. For a mid-sized business generating 45 TB (~45,000 GB) of data per month, the monthly cost would be ~$7,200/month.
*All pricing comparisons are calculated using standardized Small/Medium/Large team profiles defined in our internal benchmarking sheet, based on fixed log, metrics, trace, and retention assumptions. Actual pricing may vary by usage, region, and plan structure. Please confirm current pricing with each vendor.
Tech Fit
CubeAPM is ideal for teams leveraging modern infrastructure like Kubernetes, microservices, cloud-native databases, or serverless architectures. Its OpenTelemetry compatibility enables language-agnostic adoption across Java, Python, Node.js, Go, and .NET. With self-hosting available, it also fits perfectly for on-prem, hybrid, or regulated environments where data control and latency are critical.
2. Datadog
Overview
Datadog is a leading SaaS observability platform known for deep coverage across cloud and hybrid environments and an exceptionally broad ecosystem of 900+ built-in integrations. Teams lean on it for unified dashboards, powerful analytics, and a mature feature set that stretches from infrastructure monitoring to logs, APM, security, and user experience. For infrastructure, Datadog emphasizes high-cardinality metrics at scale, historical views, and one-click correlation across signals to speed up troubleshooting.
Key Advantage
Datadog’s defining edge is its breadth + correlation: you can pull in telemetry from virtually any system and pivot between metrics, logs, and traces in a single workflow. That tight linkage—paired with long-retention metrics—helps shorten MTTR on complex incidents where symptoms appear in one layer and root causes live in another.
Key Features
- Infrastructure Monitoring & Historical Metrics: Collects granular system and cloud metrics with 15-month default retention for long-range trend analysis.
- Unified Troubleshooting: One-click pivots to related traces, logs, processes, and security signals.
- Autoscaling & Container Awareness: Native support for Kubernetes, containers, and serverless runtimes.
- Integrations & Extensibility: 900+ integrations plus APIs, custom metrics, and dashboards.
- Cost & Usage Insights: Built-in usage metering and cost views to track spend alongside utilization.
Pros
- Extremely rich ecosystem and integrations
- Strong cross-signal correlation for faster root cause analysis
- Mature dashboards, notebooks, alerting, and collaboration
- Enterprise features span observability and security in one place
Cons
- Pricing can climb quickly as hosts, logs, and add-ons scale
- SaaS-only; no option for self-hosting
Pricing at Scale
Datadog charges differently for different capabilities. APM starts at $31/month; infra starts at $15/month; logs start at $0.10/GB, and so on.
For a mid-sized business ingesting around 45 TB (~45,000 GB) of data per month, the cost would come around $27,475/month.
Tech Fit
Datadog fits best where teams want an out-of-the-box, ecosystem-rich platform that spans infra, apps, and security—especially in multi-cloud, Kubernetes, and serverless setups. It supports common languages and frameworks (Java, .NET, Node.js, Python, Go, and more) and is a strong choice for enterprises that value unified workflows and advanced analytics over running multiple point tools.
3. New Relic
Overview
New Relic offers a unified observability platform that brings infrastructure monitoring, application performance, logs, synthetics, and AI-driven troubleshooting together under one roof. Its infrastructure component enables teams to visualize host, container, and VM metrics right alongside APM data—letting you see system health and app performance with no context-switching required. It’s designed to help teams catch and resolve issues faster by eliminating siloed dashboards and delivering clarity across layers.
Key Advantage
New Relic’s strength lies in its usage-based pricing combined with full-stack access. Instead of per-host billing, you pay for two things: data ingestion and user access. This model means you can monitor unlimited hosts and containers without incremental fees, and only scale costs when you add more users or consume more telemetry.
Key Features
- Unified Infra & APM View: Seamlessly correlate app performance with underlying host and container metrics in one dashboard.
- Change Tracking & Automap: See how deployments or configuration changes impact performance, with relationship mapping of entities.
- Flexible User Access: Supports three user levels—Basic (free), Core (developer-focused tools), and Full Platform (complete observability stack).
- Usage-Based Pricing: Monitor unlimited infrastructure without host fees; you pay for data ingestion and users instead.
- Data Plus Add-On: Offers longer retention, advanced querying (faster and deeper), and enhanced compliance capabilities like HIPAA or FedRAMP.
Pros
- Unified visibility across infrastructure, apps, logs, and monitoring tools
- Flexible user tiers let you assign access based on role
- Advanced compliance and retention with Data Plus options for regulated teams
Cons
- The user-tier model adds some complexity to predicting the cost
- No self-hosting; SaaS-only
Pricing at Scale
New Relic’s billing is based on data ingested, user licenses, and optional add-ons. The free tier offers 100 GB of ingest per month, then it costs $0.40 per GB after that.
For a business ingesting 45 TB of logs per month, the cost would come around $25,990/month.
Tech Fit
New Relic is ideal for teams that want a comprehensive observability solution with flexible pricing, especially those in regulated industries or managing dynamic cloud-native environments. It’s particularly suited for engineering teams that value cross-layer agility and need longer data retention, advanced querying, and role-based access control.
4. Dynatrace
Overview
Dynatrace is an AI-powered observability platform used widely by large, complex enterprises. Its Infrastructure Observability focuses on auto-discovery of dynamic environments (hosts, VMs, containers, networks, cloud services) and explains what’s happening with Davis® AI—so teams get precise, causal answers rather than raw alerts. Under the hood, Grail™ keeps rich context across telemetry, which helps cut through noise and speed up RCA, while AutomationEngine hooks into incident workflows to trigger tickets or remediation steps automatically.
Key Advantage
Dynatrace’s defining edge is AI with deep context. Davis® continuously analyzes topology (dependency mapping), telemetry, and changes, then points to probable root cause and business impact—reducing false positives and shortening MTTR, especially in sprawling, hybrid, or Kubernetes estates.
Key Features
- Continuous discovery & entity mapping: across hosts, virtualization, networks, services, and cloud platforms for an end-to-end picture.
- AI-driven insights (Davis®): to suppress noise, surface causation, and quantify impact—aimed at fewer major incidents and faster recovery.
- Real-time analytics: retains context across logs, metrics, and traces to enable real-time queries without managing schema or index.
- AutomationEngine: integrations for auto-remediation, ticketing, and CMDB updates.
- Extensible platform & Hub: with hundreds of turnkey extensions and APIs to tailor coverage to your stack.
Pros
- Strong AI explanations and causation, not just correlation
- Excellent coverage for hybrid, multi-cloud, and Kubernetes platforms
- Rich context preservation via Grail improves troubleshooting workflows
- Mature automation hooks for remediation and ITSM processes
Cons
- Could be expensive for smaller teams
- Learning curve is steep
Pricing at Scale
Dynatrace log costs break down into three dimensions—ingestion, retention, and querying:
- Full stack: $0.01/8 GiB hour/month or $58/month/8GiB host
- Log Ingest & process: $0.20 per GiB
For a similar 45 TB (~45,000 GB/month) volume, the cost would be $21,850/month.
Tech Fit
Dynatrace is best for organizations running Kubernetes-heavy, hybrid, or multi-cloud estates that need AI-driven answers, automated context, and policy-friendly controls. It works well when you want observability, security analytics, and automation on a single platform and are ready to leverage Davis®, Grail, and AutomationEngine to reduce operational toil.
5. Grafana Cloud
Overview
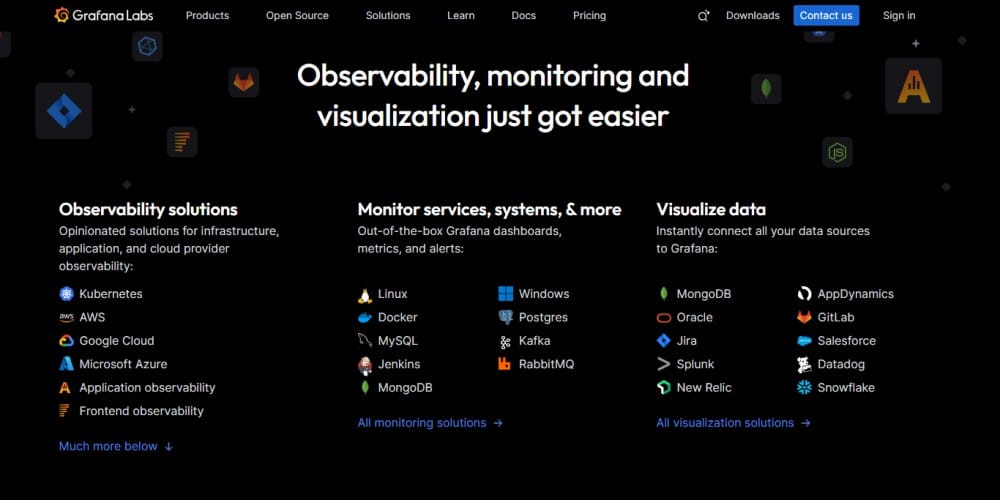
Grafana Cloud is a fully managed observability stack built on the open-source LGTM stack—Loki (logs), Grafana (visualization), Tempo (traces), and Mimir/Prometheus (metrics). It ships with guided workflows, prebuilt dashboards, and opinionated solutions (like Kubernetes Monitoring) so teams can start tracking hosts, containers, databases, and cloud services in minutes—without running their own backends. It also offers built-in cost tools to monitor and reduce telemetry spend.
Key Advantage
Composable, OSS-first observability with a generous free tier and granular, usage-based pricing. You can mix and match metrics, logs, traces, and profiles, then scale each signal independently. For infrastructure, the Kubernetes Monitoring solution provides cluster-to-container visibility with curated dashboards and alerts out of the box.
Key Features
- Kubernetes & Cloud Monitoring: allows you to monitor K8 clusters, nodes, pods/containers, and cloud providers (AWS, Azure, GCP) with clear dashboards and prompt alerts.
- Hundreds of Integrations: Quick starts for popular infra components (MySQL, Postgres, Redis, Kafka, Nginx, etc.) and agents to collect metrics, logs, and traces.
- Cost Management: Built-in usage dashboards, Log Volume Explorer, and a fair-use log query policy to help control spend.
- Open Standards: First-class support for Prometheus and OpenTelemetry pipelines across metrics, logs, traces, and profiles.
- Managed Retention: Free plan includes 14-day retention; Pro expands to 13 months for metrics and 30 days for logs/traces/profiles.
Pros
- Open-source foundations with a managed, scalable backend
- Strong out-of-the-box infra and Kubernetes workflows
- Granular, usage-based pricing with a generous free tier
- Helpful cost-management tooling built into the product
Cons
- Advanced features, such as plugins and longer retention, and support beyond community-level are available only in higher plans
- Learning curve
Pricing at Scale
Grafana Cloud pricing is transparent and usage-based (Pro plan adds a $19/month platform fee). Key list prices: Metrics at $6.50 per 1k active series, Logs/Traces/Profiles at $0.50 per GB ingested; Kubernetes Monitoring beyond the included free usage is $0.015 per host hour and $0.001 per container hour. The free tier includes helpful allowances (e.g., 10k series, 50 GB logs/traces/profiles, 2,232 host hours, 37,944 container hours).
For the mid-sized scenario of 45 TB data ingestion, teams may have to pay $11,875/month.
Tech Fit
Grafana Cloud is a strong fit if you want a managed, OSS-based stack with rich dashboards, Prometheus familiarity, and turnkey Kubernetes monitoring. Teams using Prometheus, Loki, or Tempo can benefit from the tool with minimal friction. They can also scale each signal independently, keeping costs in check.
6. Splunk AppDynamics
Overview
Splunk has expanded beyond log analytics into full observability, pairing its well-known log search capabilities with infrastructure and application monitoring through its AppDynamics-powered offering. Splunk Appdynamics focuses on delivering visibility into hybrid cloud, Kubernetes, and enterprise-scale environments, and emphasizes security, compliance, and business analytics alongside performance monitoring. With its deep log roots, Splunk excels at connecting application and infrastructure signals with operational data—making it a strong option for organizations that already use Splunk’s ecosystem.
Key Advantage
The biggest advantage of Splunk’s infrastructure monitoring suite is its integration of logs and infrastructure performance data in one environment. Enterprises that are already Splunk-heavy can extend their investment by correlating metrics and traces with log data, reducing context-switching between tools and centralizing compliance-sensitive monitoring.
Key Features
- Hybrid Infrastructure Monitoring: Monitors hosts, VMs, Kubernetes clusters, containers, and cloud-native workloads.
- Application Performance Visibility: AppDynamics provides deep transaction traces, code-level diagnostics, and dependency maps.
- Log and Metric Correlation: Native integration with Splunk’s log platform connects infrastructure events with detailed log context.
- Enterprise-Grade Security & Compliance: Built-in compliance features support highly regulated industries.
- Custom Dashboards & Alerts: Flexible dashboards, anomaly detection, and alert routing across ITSM and collaboration tools.
Pros
- Strong synergy between logs and infrastructure monitoring
- Enterprise-grade compliance and governance controls
- Flexible dashboards and alerting integrations
- Deep APM capabilities from AppDynamics add extra visibility
Cons
- Complexity in setup and tuning for hybrid/multi-cloud environments
- Slower updates cycle
Pricing at Scale
AppDynamics pricing is based on CPU cores (vCPUs). The essential “Infrastructure Edition” starts at $6 per vCPU per month, while the “Premium Edition,” which includes log analytics along with app and DB monitoring, begins at $33 per vCPU per month.
For a mid-size organization ingesting 45 TB data, the cost could be: $8,625/month.
Tech Fit
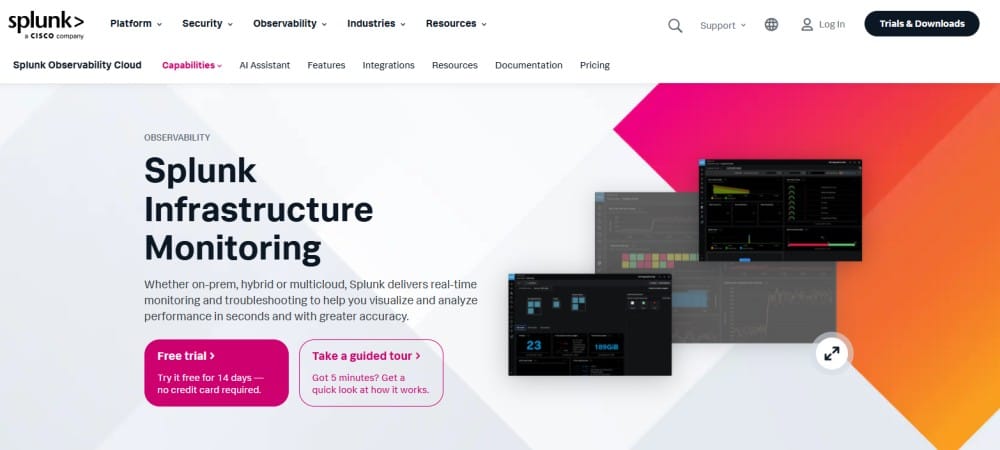
Splunk Infrastructure Monitoring is a strong choice for enterprises already using Splunk for log analytics that want to expand into infrastructure and application monitoring without adding another vendor. It’s especially relevant in regulated industries, hybrid estates, and log-heavy operations. However, for mid-sized businesses with growing log volumes, CubeAPM’s simpler, predictable pricing may be the more cost-efficient choice.
7. SigNoz
Overview
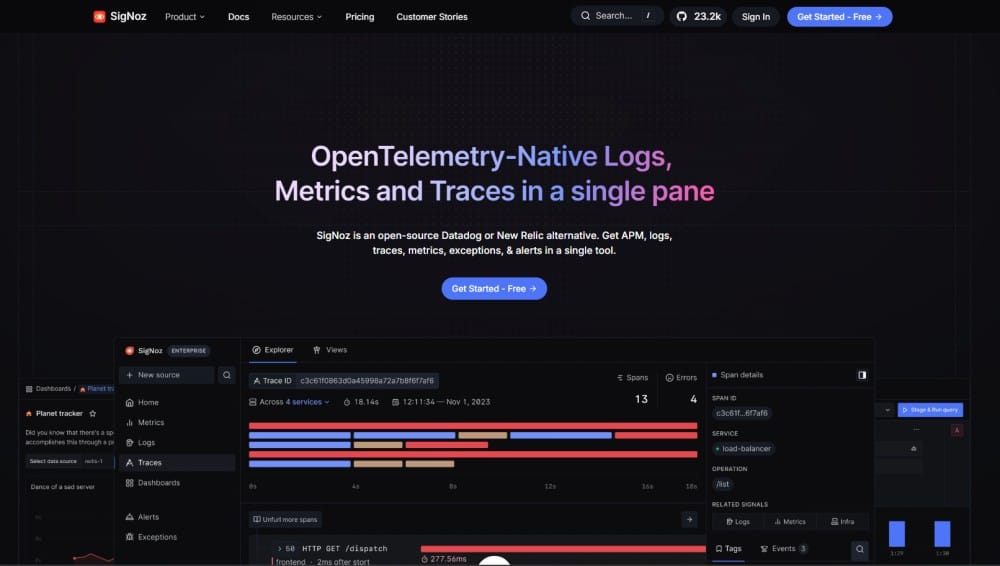
SigNoz is an open-source, OpenTelemetry-native observability platform tailored for developers who want full control over their telemetry stack. It supports infrastructure monitoring, distributed tracing, and log management, all in one place. With guided dashboards and OTel Collector templates, SigNoz makes it easy to observe hosts, Kubernetes clusters, and pods while maintaining flexibility and ownership.
Key Advantage
The standout strength of SigNoz is its OSS-first, vendor-neutral approach. You aren’t locked into a proprietary agent or billing structure—instead, you use standard OpenTelemetry pipelines and have full access to dashboards, alerts, and analysis logic.
Key Features
- Host & Kubernetes Monitoring: Prebuilt dashboards show CPU, memory, I/O, disk, and network metrics per host or pod.
- Traces & Logs: View distributed traces and logs linked directly to infrastructure metrics—within the same UI.
- Guided Setup: Easy onboarding with OTel Collector templates and out-of-the-box visualization workflows.
- Dashboards & Alerts: Customizable dashboards with alerting capabilities via Slack, PagerDuty, and more.
Pros
- Fully open source with the flexibility to self-host or go managed
- Deep OpenTelemetry support without vendor lock-in
- No user, host, or custom metric pricing—just pay for telemetry data
- Transparent and usage-based cloud pricing
Cons
- Self-hosting requires operational effort and infrastructure maintenance
- Pre-built integrations and customizations are only available in paid plans
Pricing at Scale
SigNoz’s cloud edition starts with a $49/month base credit. After that’s used up:
- Logs: $0.30 per GB ingested
- Traces: $0.30 per GB ingested
- Metrics: $0.10 per million samples
SigNoz charges a flat $0.30 per GB ingested. Using our 45 TB, scenario, the cost could be $16,000/month.
Tech Fit
SigNoz suits teams that want full transparency and control—particularly those comfortable self-hosting open-source tools or leveraging OTel-native architecture. But if you’re after enterprise-grade support and predictable all-in-one pricing without complexity, CubeAPM stands out as the more streamlined, cost-effective choice.
8. Elastic Observability
Overview
Elastic Observability monitors infrastructure, logs, traces, and user experience. For infrastructure monitoring, it ships with 200+ integrations and curated dashboards so you can track hosts, VMs, containers, Kubernetes, and cloud services alongside app telemetry. Teams lean on Elastic’s anomaly detection and “search anything” model to jump from an infrastructure spike to the exact log line or trace causing it.
Key Advantage
A search-first, serverless model that lets you ingest any mix of logs, metrics, and traces and then explore it with Elastic’s Search AI Lake and AI Assistant. You pay for ingest and retention, not per-host—handy when your footprint scales dynamically on Kubernetes.
Key Features
- Infra & Host Monitoring: Out-of-the-box views for hosts, containers, and pods; correlate system metrics with logs and traces in one UI.
- Kubernetes & Cloud Coverage: 200+ integrations for AWS, Azure, GCP, and common infra components.
- AIOps & Anomaly Detection: Built-in ML helps surface unusual behavior across high-cardinality telemetry.
- AI Assistant: Natural-language help to decode errors and build queries faster.
- Serverless Pricing: Ingest- and retention-based, with optional add-ons such as synthetic monitoring.
Pros
- Robust search function
- correlates logs, metrics, and traces
- Flexible ingest/retention model instead of per-host fees
- Broad integration catalog and Kubernetes awareness
- Optional add-ons like synthetics without running your own stack
Cons
- Setup complexity
- Learning curve
- Dashboard issues
Pricing at Scale
Elastic’s Serverless Observability pricing starts around $0.15/GB for ingest and $0.02/GB/month for retention. Egress beyond the free tier is $0.05/GB, premium support is an additional 5-15% of monthly spend, and synthetic monitoring is billed separately at $0.10 per 10,000 test runs.
Mid-sized scenario (45 TB/month ingest):
Estimated total: ≈ $17,435/month
Tech Fit
Elastic Observability works well for teams that want deep search and flexible retention options across massive telemetry volumes. It’s especially suited for teams already using Elastic’s ecosystem. But for organizations that prioritize predictable, all-in-one pricing without hidden extras, CubeAPM offers a simpler and far more cost-effective approach.
How to Choose the Right Infrastructure Monitoring Tool
1. Cost Transparency and Predictability
Hidden costs are one of the biggest pain points in 2025. Many vendors charge separately for hosts, vCPUs, log retention, and add-ons like synthetics, making it hard for teams to budget at scale. Teams should choose tools with transparent pricing models (like CubeAPM’s $0.15/GB) to avoid bill shock as they grow.
2. OpenTelemetry-First Support
With OpenTelemetry (OTEL) becoming the industry standard in 2025, vendor lock-in is no longer acceptable. Tools that natively support OTEL allow teams to instrument once and send data to multiple backends if needed. This future-proofs observability investments and makes it easier to switch platforms without ripping out instrumentation code.
3. Logs ↔ Metrics ↔ Traces Correlation (MELT)
Modern outages often require correlating signals across infrastructure, application, and user layers. Choosing a tool that unifies logs, metrics, events, and traces in a single backend enables faster root-cause analysis. Without this correlation, teams waste hours hopping across dashboards, leading to slower incident response and higher MTTR.
4. Kubernetes and Multi-Cloud Readiness
By 2025, over 70% of enterprises will be running workloads in hybrid or multi-cloud setups. Tools need to automatically discover ephemeral workloads, scale with Kubernetes clusters, and provide service-level insights across AWS, GCP, and Azure. Platforms without strong container and multi-cloud visibility struggle to keep up with these dynamic environments.
5. Continuous Profiling & eBPF Support
For advanced engineering teams, profiling CPU, memory, and I/O at runtime is critical to optimize performance. In 2025, many vendors are adopting eBPF to collect low-overhead, kernel-level insights. If your workloads are latency-sensitive or run at scale, prioritize tools with built-in continuous profiling and eBPF-based observability.
6. Database Performance Visibility
Databases remain the #1 bottleneck in production. A strong monitoring tool should track query latencies, deadlocks, replication delays, and cache efficiency alongside application traces. Without this, infrastructure monitoring remains incomplete, as many incidents stem from slow or failing database queries.
7. Self-Hosting and On-Prem Compliance
Not every business wants to host observability data in the cloud. Healthcare, finance, and government agencies often require on-prem or hybrid deployments to meet compliance requirements. Choose a tool that supports flexible deployment modes—cloud SaaS for agility, or on-prem for strict compliance.
Conclusion
Infrastructure monitoring is critical for modern businesses, helping teams maintain performance, security, and reliability across hybrid clouds, Kubernetes, and serverless systems. The challenge lies in choosing the right tool. Many solutions come with unpredictable costs, weak OpenTelemetry support, or limited compliance flexibility, leaving businesses frustrated.
CubeAPM addresses these gaps with simple $0.15/GB pricing, full OTEL support, MELT signal correlation, smart sampling, and self-hosting options for regulated industries. Combined with intuitive dashboards and cost-effective scalability, it delivers everything teams need to monitor infrastructure without complexity or hidden fees.
Take the free demo to explore CubeAPM.
Disclaimer: The information in this article reflects the latest details available at the time of publication and may change as technologies and products evolve.
FAQs
1. What is an infrastructure monitoring tool?
An infrastructure monitoring tool tracks servers, containers, cloud services, and databases in real time. It helps detect bottlenecks, prevent downtime, and ensure applications run smoothly.
2. Why are infrastructure monitoring tools important in 2025?
With hybrid clouds, Kubernetes, and serverless adoption at record highs, businesses need deeper visibility across distributed systems. Monitoring ensures reliability, security, and cost control.
3. What challenges do teams face when choosing a monitoring tool?
The biggest issues are unpredictable pricing, poor OpenTelemetry support, a lack of unified MELT correlation, and limited compliance flexibility for regulated industries.
4. Which infrastructure monitoring tool is most cost-effective?
CubeAPM is the most cost-effective, with flat $0.15/GB pricing that avoids hidden charges. It scales affordably for startups and enterprises alike.
5. What makes CubeAPM the best infrastructure monitoring tool?
CubeAPM offers OTEL-native monitoring, MELT correlation, smart sampling, self-hosting for compliance, and transparent pricing—a combination that few tools provide today.


