Log management is important for modern observability stacks, particularly those running microservices, distributed applications, and Kubernetes clusters across Google Cloud Platform, AWS, and Azure. All of them generate heavy volumes of data, from app servers to firewalls.
According to a 2024 survey, log data volumes on average have grown approximately 250% YoY, and 22% of respondents accepted generating 1TB or more logs daily.
Yet, organizations still don’t have complete visibility into their IT infrastructure. No wonder they struggle to find system issues and their root causes in time. As a consequence, they may face system downtimes, security loopholes turned into fully-blown attacks, and compliance violations under GDPR, HIPAA, or PCI DSS.
As a core pillar of observability alongside metrics and traces, log monitoring captures events with a timestamp for root cause analysis and incident response. Solutions, such as CubeAPM, offer log aggregation, real-time alerting, and Otel-native support. It helps teams to track and analyze system issues and fix them before they escalate.
Key Takeaways:
- Logs, alongside metrics and traces, are a core pillar of observability that provide detailed insights into system behavior.
- Effective log management improves IT visibility, reduces MTTR by up to 30%, strengthens security & compliance (GDPR, HIPAA, PCI DSS), and helps optimize costs.
- Modern platforms like CubeAPM support real-time log monitoring to detect anomalies, prevent downtime, and improve collaboration across DevOps and SRE teams.
- A robust log management system includes ingestion pipelines, scalable storage, query engines, dashboards, alerting, and incident response workflows.
- The future is OpenTelemetry-native log monitoring, enabling standardized data collection and seamless integration across cloud and hybrid environments.
What Is Log Management?

Log management means continuously observing, tracking, analyzing, and managing log data generated from databases, applications, network systems, cloud platforms, and other components in your IT environment.
Development teams start by collecting logs in real-time from different systems and then processing, visualizing, and analyzing them to derive meaningful insights. They use these insights to find and troubleshoot system issues, such as system failures, slowdowns, suspicious activities, and more. It helps them get to the root cause of a problem and resolve it faster to restore performance and security.
Now, if you’re wondering what a log is, it’s a record or information with a timestamp. It can be an error message, user input, system event, output, performance metric, etc. Logs tell everything that happens within a system, software, servers, and so on.
Example of Log Management: Suppose the security team in a fintech company tracks server and API logs in real-time. They record details, such as transaction IDs, status codes, and timestamps.
If more than 10 failed attempts occur from the same IP in 5 minutes, the system alerts the security team and blocks the IP. It also flags API latency for DevOps to fix. This way, log monitoring helps the team stop a possible brute-force attack and resolve database slowdowns before users notice.
Importance of OpenTelemetry in Log Management
OpenTelemetry has become the de facto standard for observability data collection. Modern platforms, such as CubeAPM and SigNoz, offer native OTEL support to reduce vendor lock-in and simplify integration. In contrast, legacy solutions often require proprietary agents or connectors, adding complexity and cost.
Logs vs Metrics vs Traces
Logs, metrics, and traces – all three are important in software observability. Logs alone will not cover everything. But how do they differ?
Logs: They are detailed records of system events, such as app logs, audit logs, and security logs. These capture highly granular details, so teams can use the information to troubleshoot system issues and perform audits and root cause analysis. Logs can be semi-structured or unstructured (eg, syslogs and plain text).
Metrics: Metrics are data that tell you about how a system behaves or performs over time through indicators, such as CPU usage, the number of HTTP requests a system processes in a minute, etc. Metrics are quantifiable, and teams use them to understand system performance issues and optimize costs.
Traces: Traces summarize system events so teams can understand request flows in a system, pinpoint performance bottlenecks, and dependencies. For example, you can analyze traces to track how an HTTP request moves through each system component or how much time each component takes to interact with the request.
What’s the Difference Between Logging and Monitoring?
Many terms in software observability might look similar, but they are different when you dig deeper. For example, log monitoring is one thing, but logging and monitoring are two separate terminologies. So, you don’t want to use them interchangeably. If you do, this might as well change the meaning.
Logging
When you say logging, it means a system is recording an event with all the details, such as what happened and when.
Example: The event could be a transaction failure. In this case, the system will log or record the failure, the time of failure, the transaction ID, and the system or user that initiated the transaction, the error message, and other relevant information that can come in handy in diagnosis.
Monitoring
Monitoring means continuously observing a system’s logs and metrics. Development teams use dashboards and alerts to monitor a system or application. They analyze records that systems generate to spot issues and fix them proactively. If they set up alerts, the monitoring system notifies them if a metric exceeds the threshold value.
Example: Suppose a streaming service company uses a monitoring tool to track performance metrics, such as CPU usage, video buffering rates, etc. If the CPU usage exceeds 85% for 2 minutes, the monitoring tool will alert the development team so they can scale resources before users face playback issues.
Log Management vs Log Monitoring
Log monitoring is a part of log management. If log management is a library, log monitoring is the librarian who constantly keeps an eye on the books and notifies you of status/events, like shortages, new editions, etc.
Log monitoring’s main focus is to observe and analyze a system’s logs and identify and fix issues. But log management is an umbrella term that includes handling the complete lifecycle of log data. It begins when a system generates a log and goes all the way to teams processing, storing, analyzing, retaining, and disposing of it.
Why Log Management Matters and Its Use Cases
Modern organizations use plenty of tools, applications, and online services for development, marketing, sales, accounting, and other aspects of running a business. Each of these tools generates huge data volumes. Plus, each drains a certain amount of system resources and comes with security risks.
If you don’t monitor logs, identifying issues, such as slowdowns, cost spikes, and vulnerabilities, in systems on time becomes extremely difficult. It could affect user performance, reduce ROI, and attract cyberattacks. All of these are bad news for your business. According to OWASP Top 10 as of July 2025, falling at logging and monitoring failures can affect your IT visibility, forensics, and incident alerting.
With log management, you can collect and analyze data from various software to pinpoint events and issues. Development and engineering teams use these insights to find the root cause faster and fix problems. It keeps you informed of everything happening in your IT infrastructure. Controlling costs, managing security, and delivering top-class user experience becomes much easier this way.
Let’s understand various use cases of log management:
Complete IT Visibility with Centralized Log Management
Development teams can use log management software to gain complete visibility into their IT infrastructure in one place. They can view all the logs generated from different cloud services, applications, servers, databases, and other systems. It saves their time and resources in digging through each system. They can execute IT automations, responses, and operations with greater precision.
Team Collaboration with a Shared Space
Atlassian’s report says that 68.4% of companies now use proactive incident management, monitoring, alerting, and communication tools.
A log management tool helps improve collaborations between development, engineering, security, and operations teams. It provides a shared space to access and analyze logs and keeps everyone on the same page regarding system performance, security, user activities, etc. It avoids confusion and reduces the likelihood of errors. They can share insights, coordinate incident responses, apply fixes more efficiently, and achieve faster mean time to resolution (MTTR). Even the report showed around a 30% reduction in MTTR.
System Performance Optimization with Continuous Log Management
Continuous log management helps you spot issues in system performance, such as memory leaks, slow query processing, high resource usage, etc. It helps your team find the root cause of why a system’s performance has degraded. Fixing issues and restoring system performance becomes easier this way.
For example, log management helps you track API response times so that you can improve your backend processes.
Log Management for Incident Detection and Response
Cyberattacks escalate faster. A small security loophole can quickly turn into a vulnerability and then into a fully blown attack. Log management helps you monitor your systems for security in real-time. You can quickly detect security failures, policy violations, and breaches, and set up alerts for suspicious log patterns. It helps you apply fixes and close security gaps faster before cyberattackers get to them.
The same Atlassian report also indicated that monitoring tools were among the most popular tools for preventing security incidents.
Centralized Logging for Compliance with Regulations
Regulatory standards, such as GDPR, HIPAA, NIST, and PCI DSS, require organizations to follow their rules. Violating these rules could cause heavy fines and lengthy legal battles that no one wants. For example, NIST SP 800-92 outlines log management review processes and data protection.
With log management, you can collect and retain data for auditing. You must know who has access to what info, from where, and when. For this, perform immutable and centralized logging and use access controls. Some tools also offer reporting automation to save you more time in managing compliance.
Log Management for Cost Management
You must know how your resources are being utilised. Underutilized? Overutilized? How would you optimize your budget if you had no idea about this?
Monitoring logs helps you spot patterns in resource consumption. If resources are underutilized or overutilized, then you can cut down costs. It also enables you to allocate resources properly and make better scaling decisions.
For example, log analysis can help you find and eliminate redundant processes consuming resources unnecessarily, thereby saving costs.
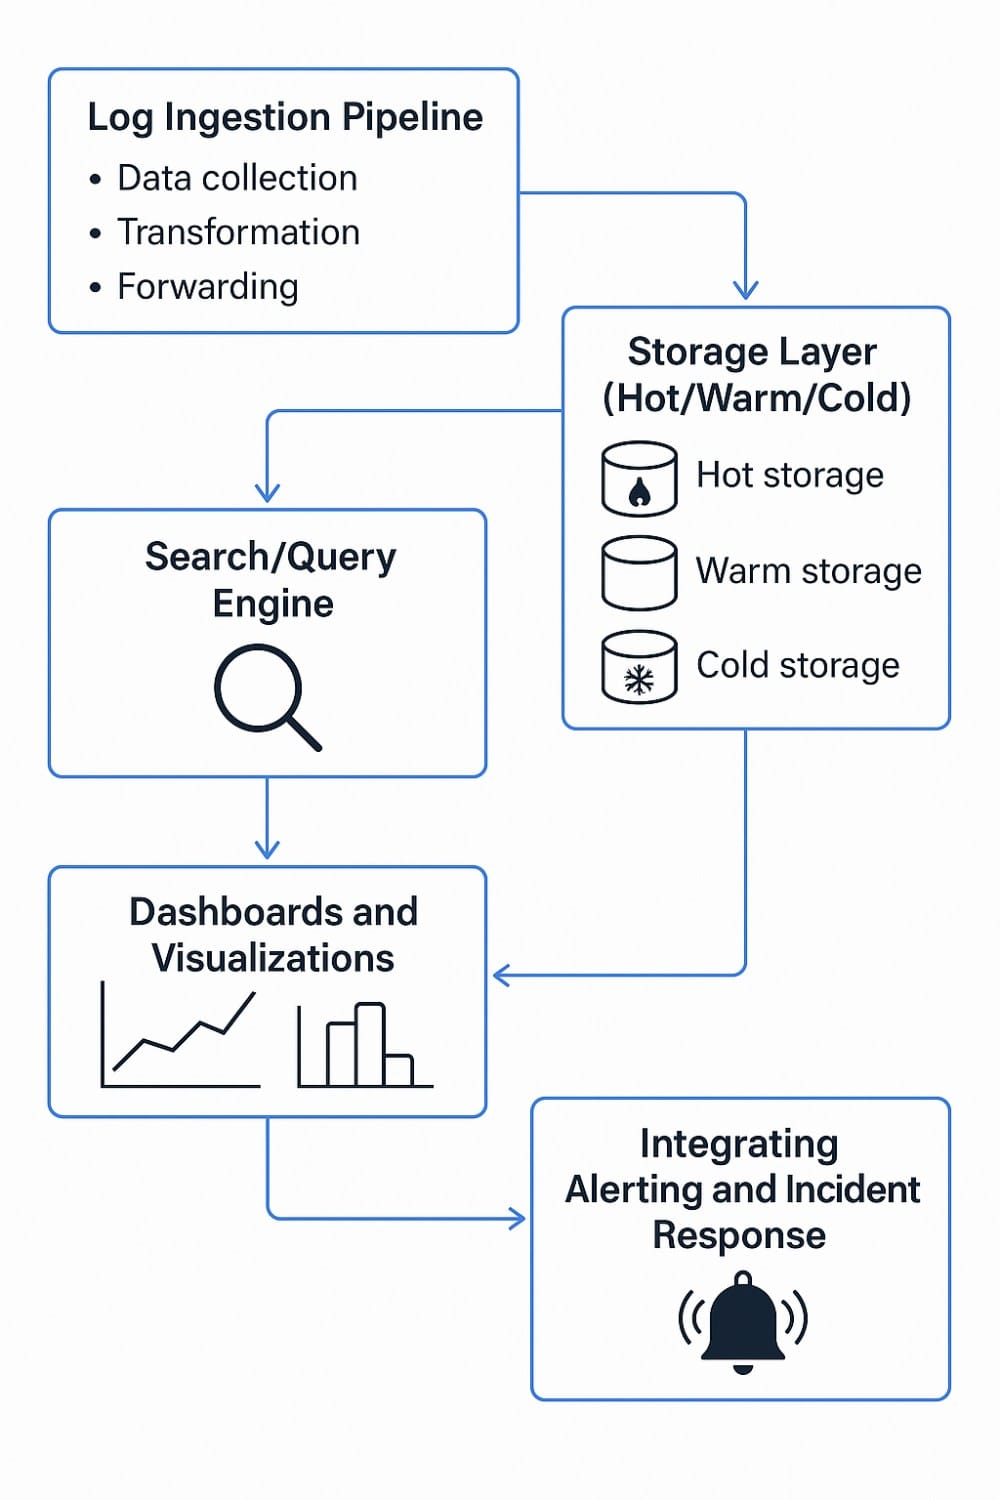
Key Components of a Log Management System

A log management system has the following components:
Log Ingestion Pipeline
This pipeline collects, transforms, and forwards log data from different sources into a central system.
- Data collection: Using collectors (e.g., OpenTelemetry Collector) or agents (e.g., Filebeat) installed on source systems, such as applications and servers. For example, CubeAPM aggregates logs from various agents, such as OTel, Loki, Logstash, Fluentbit, Filebeat, Kubernetes, Amazon S3, ECS, and more.
- Transformation: It includes eliminating low-value logs (e.g., debug in production) and rate-limiting noisy events. It also includes standardizing data (e.g., in JSON format) for precise queries and lowering data storage costs.
Storage Layer (Hot/Warm/Cold)
This layer stores your ingested logs and partitions them in different tiers based on data retention, cost, and latency:
- Hot storage: It stores recent and frequently accessed logs for faster troubleshooting and data analysis in real-time. Commonly, they are SSD-based.
- Warm storage: It stores less frequently accessed logs that you may still need for short-term reviews or run forensic investigations.
- Cold storage: Usually S3-based systems or on-prem backup systems, it’s used for long-term data retention (months to years) and maintaining compliance.
Search/Query Engine
Query Engine allows users to search, filter, and analyze the log data. The better your search engine is at correlating and slicing log volumes, the faster you can respond to incidents. It’s a core capability of dashboards, alerting, and investigation systems.
Dashboards and Visualizations
Visualizations, such as graphs, tables, maps, etc., convert raw logs into useful insights. Operators, developers, auditors, and managers can visualize these insights in clean dashboards to digest information easily and take suitable action. Monitoring tools come with built-in dashboards, while some allow you to customize them or create one from scratch.
Integrating Alerting and Incident Response
By integrating alerting with incident response, you can turn patterns or anomalies in logs into actionable workflows and alerts. It helps you resolve system issues promptly before they affect user experience. You can set rule-based alerts, use ML models for anomaly detection, connect alerts with email and Slack, and take a snapshot of logs for root cause analysis (RCA) and compliance.
How Log Management Works
Here’s a step-by-step process of how log management works in IT environments:
- Log Generation: Everything starts with your IT systems generating logs. Your applications, operating systems, cloud services, servers, network devices, etc., are log sources. A log could be an app error, a server update, a database query, and so on.
- Collection & aggregation: Developers and engineering teams collect, aggregate, and transform logs. Next, they send them to a central hub so they don’t have to search multiple locations to figure out what went wrong.
- Parsing & enrichment: In this step, you will need to break down raw data (IPs, error codes, etc.) into useful insights. You also need to enrich the data with additional details, such as threat level, user location, etc., for effective analysis.
- Indexing & storage: Now that your logs are organized, it’s time to index them so that it becomes easier to search them when in need. You also need to store logs in a reliable system, such as on-prem systems or cloud services.
- Querying, filtering, and visualization: With everything set up, you can easily search through your logs and filter them (by error type, time, etc.). You can also populate a dashboard with this data and visualize it via graphs, heat maps, tables, etc., to draw observations and take actions.
- Real-time alerting from logs: Lastly, set alerts to get notified when something goes wrong, such as a server crash or suspicious login attempts.
Log Management in Modern Observability
Now that you know the process, let’s take a closer look at how log management works in modern IT environments:
- Correlating logs with metrics and traces: To get the full picture of an issue, you need information on all three. Logs tell you the details, such as time, IDs, users, etc. Metrics tell you trends and patterns, such as CPU spikes, response delays, etc. Traces track how a request interacts with different services. When you combine them, you can pinpoint issues promptly.
- Role in SRE workflows: Log management is an important tool for Site Reliability Engineers (SREs). They use it to detect incidents early, understand how it can affect users, and perform RCA. They can also use logs to track the progress of issue resolution.
- OpenTelemetry integration: OpenTelemetry (OTel) is an open-source tool that standardizes your data collection process from different sources. It also sends them to observability tools for analysis without rewriting code.
Getting Started with Log Management
- Decide on logging format & structure: Start by choosing a consistent format like JSON to be able to efficiently parse, correlate, and query data later. Also, define the field names clearly, such as timestamp, message, level, etc.
- Set up log collectors: Use collectors or agents, such as OTel’s Collector, Logstash, Fluent Bit, or Promtail, to capture logs from your apps, containers, cloud services, etc. You can compress and filter data to capture relevant ones without overloading your network.
- Configure parsing and storage: Parse raw data into structured fields and store them on-prem or in reliable systems, such as Elasticsearch or Loki.
- Create dashboards and alerts: Build dashboards or use built-in dashboards from your monitoring system to visualize data. Set up alerts to receive immediate notifications.
- Start small, optimize for scale: Start with a single environment and gradually scale by refining your parsing rules and alert thresholds.
Top 3 Log Management Tools
1. CubeAPM

CubeAPM is one of the best log management tools in the market that you can use for full-stack observability with advanced features. You get faster onboarding and can manage logs effortlessly with fast search and intuitive dashboards. CubeAPM also allows easy controls, exports, and audits with vendor-neutral formats and complies with data localization rules and PII safety standards.
Key Features
- Supports log aggregation from multiple agents – AWS ECS, Firehose, Lambda, S3; Filebeat, Fluentbit, Fluentd, Kubernetes, and Logstash.
- Full MELT (metrics, events, logs, and traces) coverage
- 800+ integrations
- Ingest logs from anywhere
- Unlimited retention of logs
- On-prem log management. Compatible with any of your current stack
- Queries logs with full-text search and high cardinality filters at high speed
- Filterable and efficient dashboards with real-time context
- On-prem deployment without egress charges
- Cost-efficient with no additional costs
- Responsive support team with Slack and WhatsApp
Pricing: $0.15/GB of data ingestion
2. Dynatrace

Dynatrace is a full-stack observability platform that allows teams to unify logs, traces, and metrics with automation.
Key Features
- AI-based RCA with Davis AI
- Built-in app security
- Topology mapping
- Supports multi-cloud deployments
Pricing: $0.08/hour/ 8 GiB host for full-stack monitoring
3. Datadog

Datadog is a popular SaaS observability platform that comes with cloud native integrations and security insights.
Key Features
- 900+ integrations
- Full MELT
- DevSecOps capabilities
- Custom dashboards
Pricing: Infra: starts $15/host/month; APM: starts $31/host/month; Logs: starts $0.10/GB ingested + $1.70/M events.
How CubeAPM Handles Log Management

CubeAPM offers unified log management by combining it with application performance monitoring (APM), real user monitoring (RUM), and distributed tracing in one platform. Unlike standalone logging tools, CubeAPM is OpenTelemetry-native. This means it can ingest logs directly from cloud-native environments, such as Kubernetes, Docker, and microservices architectures, without relying on proprietary agents.
Key Advantages
- Centralized log collection from applications, servers, and containers.
- Real-time correlation of logs with traces and metrics for faster root cause analysis.
- Customizable dashboards to visualize error spikes, latency issues, and anomalies.
- Scalable storage and retention policies, helping teams optimize costs as data volume grows.
- AI-driven alerts to detect unusual patterns and prevent downtime before it impacts end users.
Case Study: How CubeAPM Helped an E-commerce Platform Achieve Faster MTTR and Reliable Operations
A mid-sized e-commerce platform deployed CubeAPM to handle rapidly growing log volumes from its checkout and payment services. By correlating logs with distributed traces, the engineering team identified a recurring latency issue in their payment gateway microservice. With CubeAPM’s real-time alerts and dashboards, they reduced their mean-time-to-resolution (MTTR) by 40%, preventing checkout failures during peak holiday traffic and safeguarding revenue.
By integrating logs with performance data, CubeAPM eliminates silos and gives DevOps and SRE teams a single pane of glass to monitor application health, troubleshoot faster, and maintain a seamless digital experience.
Challenges of Log Management
- High Log Volume: Modern IT systems can create millions of logs daily. With no smart filtering or indexing, it’s like searching for a needle in a haystack.
- Changing Formats: All logs are not the same. Their formats could be plain text, structured (json, xml), syslog, proprietary, or vendor-specific format. Changing formats can make parsing, analysis, and correlation difficult.
- Logs in Silos: Different tools and teams may keep their logs separate. Stitching together these pieces of logs can be time-consuming, particularly during an incident.
- Complex IT Environments: Hybrid clouds, distributed systems, and microservices create messy logs. Tracking root causes across so many moving parts can feel like a detective’s job.
- Data Storage Costs: Retaining logs for years or months can increase your storage bills.
Best Practices of Log Management
- Use a Structured Method: Avoid keeping your logs messy with random events. Use a structured and consistent format, such as JSON, to easily search and parse data.
- Tag logs: Tags, such as env=production, help you find the exact logs you want.
- Filter Noise: Keep relevant, complete, up-to-date, and accurate logs, instead of duplicate or irrelevant ones.
- Monitor in Real-time: Monitor logs in real-time to catch issues instantly and be able to fix them early.
- Frame Effective Retention Policies: Retain logs as long as they provide value to optimize your storage costs.
- Log Management: Keep collecting, storing, and managing logs as it’s a continuous process, not a one-time deal.
Conclusion
Efficient log management is important for modern IT teams to analyze issues and improve system performance, maintain compliance, and keep costs in check. It allows you to spot errors and anomalies early so that you can fix them faster. It reduces downtimes and costly cyberattacks.
Choose a high-performing log management solution from reliable providers, such as CubeAPM. Explore how it improves your observability game with unlimited log ingestion, real-time MELT correlation, and smart sampling.
Schedule a free demo with CubeAPM now.
Disclaimer: The information in this article reflects the latest details available at the time of publication and may change as technologies and products evolve.
FAQs
How long should you retain logs?
The ideal log retention period depends on your industry, compliance requirements, and storage costs. For security and auditing, many organizations keep logs for 90 days to 1 year. Highly regulated sectors (e.g., finance, healthcare) may require 2–7 years of retention under some regulations. Balance compliance with cost by using tiered storage, keeping recent logs in hot storage for quick access, and archiving older logs to cheaper, long-term storage.
What mistakes should you avoid during log management?
Common mistakes include:
– Logging too much noise without filtering or sampling
– Failing to standardize log formats
– Ignoring log security (unencrypted storage or weak access controls)
– Alert fatigue can happen if you don’t set clear thresholds.
– Skipping regular audits of logging pipelines
Avoiding these pitfalls ensures accuracy, reduces costs, and improves incident response speed.
Which monitoring tool is best?
The “best” tool depends on your needs. For example:
Small teams or open source users: ELK Stack, Loki, Graylog
Cloud monitoring: GCP Cloud Logging & Azure Monitor
Full-stack observability with logs, metrics, and traces: Platforms like CubeAPM.
Evaluate tools based on scalability, pricing model, integration ease, and OpenTelemetry support.
Can log management help with debugging or troubleshooting?
Yes, log management is critical for debugging. Real-time log insights help identify error patterns, pinpoint failing components, and trace issues across microservices. Historical logs are invaluable for root-cause analysis after an incident, while correlation with metrics and traces speeds up problem resolution.
Can log management boost your system’s performance?
Indirectly, yes. While log management itself doesn’t speed up processing, it surfaces performance bottlenecks, slow queries, and resource-hungry processes. By acting on these insights, optimizing code, scaling resources, or adjusting configurations, you can significantly improve system performance and reliability.


