Blue Matador stands out for its effortless setup and intelligent, automated alerting, making it a strong fit for lean teams monitoring cloud infrastructure. However, as environments scale, teams may encounter higher costs and a learning curve when tuning alerts.
CubeAPM is a strong alternative to Blue Matador, offering full-stack observability with OpenTelemetry-native support and predictable pricing, making it easier to scale without rising complexity or costs.
In this article, we will explore seven top alternatives to Blue Matador, examining their strengths, features, pricing, and support structures to help businesses make an informed decision.
Top 7 Blue Matador Alternatives
- CubeAPM
- Datadog
- Grafana
- Sumo Logic
- Dynatrace
- New Relic
- Uptrace
Why Look for Blue Matador Alternatives?
As businesses grow, so too do the complexities of their infrastructure and the need for comprehensive observability. Many organizations are seeking alternatives to Blue Matador due to a variety of reasons, including but not limited to:
1. Limited Automation and Non-Comprehensive Insights
Clients have pointed out that the automated monitoring process in Blue Matador takes away valuable time from their work. Additionally, the insights and reports generated are often not detailed enough, making troubleshooting more time-consuming.
“I dislike how it automates my monitoring tasks, which does not give me time to focus on important aspects of my job. The non-comprehensive insights and reports provided by Blue Matador make troubleshooting hectic.” – G2 Review
2. Limited Integration
Another user mentioned that while Blue Matador integrates well with various systems, it could benefit from additional integrations. The client also suggested more flexibility in adjusting alert thresholds to meet specific system requirements.
“It could be more comprehensive, especially for intricate configurations or coding-related functionalities. Expanding integration with additional tools and offering more flexibility in adjusting alert thresholds based on specific system needs would enhance its versatility.” – G2 Review
3. Incomplete APM Solution
Some users have noted that while Blue Matador provides a cost-effective solution, it does not offer the full range of features typically expected from an APM tool. As a result, users may need to pair it with additional solutions, like Elastic.co, to achieve full-stack observability.
“It’s not a full APM solution yet, but it pairs well with the elastic.co APM stack, allowing us to move off a more expensive New Relic environment. While the cost is very good, you’ll need a companion solution to handle the full stack typically covered by an APM.” – G2 Review
Criteria for Suggesting Blue Matador Alternatives
When considering alternatives to Blue Matador, several criteria come into play:
1. Open-Telemetery Support
We prioritized tools with native OTEL for flexibility. OpenTelemetry has emerged as the de facto standard for collecting, processing, and exporting telemetry data. It offers a vendor-neutral, unified framework that enables teams to instrument their applications once and send data to any backend of their choice.
2. Cost-Effectiveness:
With increasing data volumes, lower data ingestion, transfer, and storage costs are critical. Alternatives like CubeAPM offer substantial savings, making them attractive to companies with larger infrastructures.
3. Comprehensive Monitoring Capabilities
Businesses need tools that can handle not just APM but also logs, infrastructure monitoring, error tracking, and synthetic monitoring. Tools like Datadog and CubeAPM offer a full stack of observability features.
4. Scalability and Flexibility
As organizations scale, their observability tools must evolve with them. Solutions that support on-prem hosting, as well as cloud solutions, offer flexibility. CubeAPM’s ability to integrate seamlessly with popular tools like New Relic and Datadog makes it a versatile choice for businesses looking to switch.
5. Customer Support and Service Level Agreements (SLA)
The speed and quality of support are essential. While Blue Matador provides limited customer support, alternatives like CubeAPM and Datadog offer faster turnaround times through Slack or WhatsApp with core devs for mission-critical issues.
Blue Matador Overview
Known For
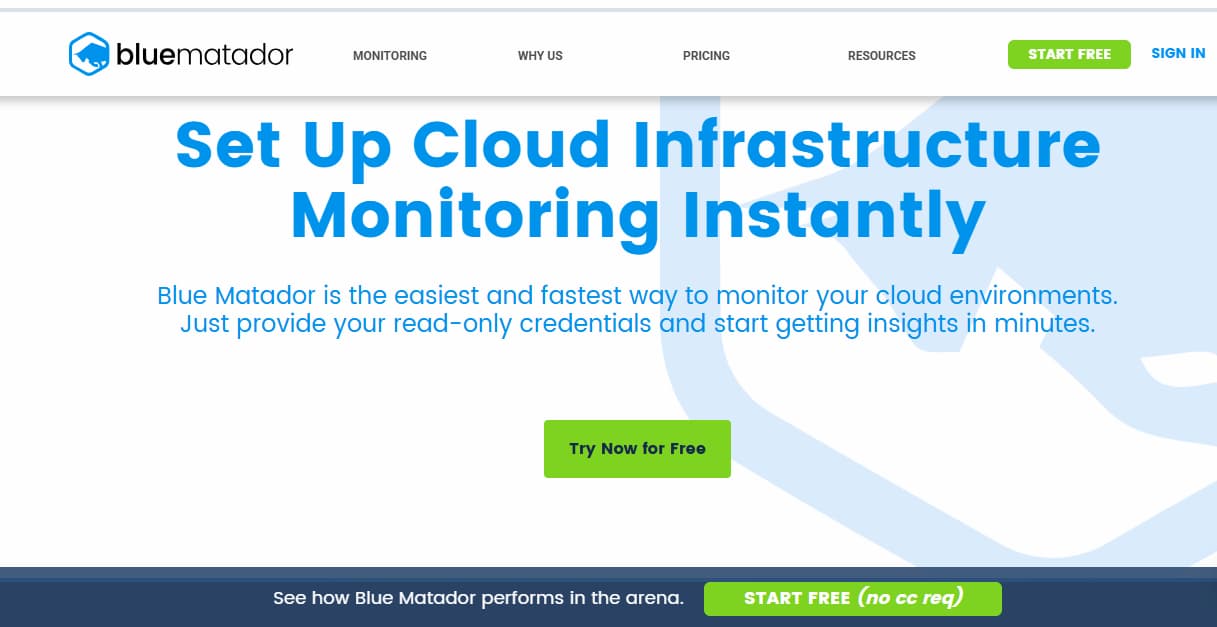
Blue Matador is primarily an infrastructure monitoring platform. It focuses on providing users with real-time insights into application performance, enabling businesses to quickly identify issues and optimize their systems. It targets smaller to medium-sized businesses looking for a straightforward and cost-effective solution for monitoring applications.
Standout Features
- Ease of Use: Blue Matador is recognized for its user-friendly interface and simplicity. It doesn’t require complex setup processes or configuration, making it an attractive choice for teams with limited DevOps expertise.
- Real-Time Alerts: Blue Matador sends out real-time alerts about application errors, helping teams resolve issues proactively before they affect end users.
- Automated Monitoring: Blue Matador automates the monitoring process, removing the need for extensive manual configuration, which reduces operational overhead.
- API Performance Monitoring: The tool excels at monitoring API performance and identifying bottlenecks in real-time.
Key Features
- Distributed Tracing: Blue Matador helps in tracing API calls across various microservices, helping users pinpoint issues in distributed systems.
- Error Tracking: It tracks application errors and provides detailed logs to help resolve issues efficiently.
- Synthetic Monitoring: Blue Matador allows for the simulation of user interactions, which is crucial for detecting issues before they affect actual users.
- Infrastructure Monitoring: The platform also provides comprehensive monitoring of infrastructure, ensuring that both the application and underlying infrastructure are performing optimally.
- Log Aggregation: Blue Matador aggregates logs and enables their analysis for improved troubleshooting.
Pros
- Blue Matador offers competitive pricing, especially for smaller teams or businesses with budget constraints.
- Requires minimal setup compared to complex APM solutions like Datadog and New Relic.
- Primarily designed for monitoring performance and errors, making it ideal for teams with these core needs.
Cons
- High costs as usage grows
- Limited integrations
Best For
- Small to medium-sized businesses or startups looking for a low-cost, easy-to-use APM solution for monitoring application performance, errors, and infrastructure.
- Teams that prioritize simplicity and ease of deployment over advanced features or highly customizable setups.
Pricing & Customer Reviews
- Free Tier: $0/month for up to 5 hosts.
- Pro Tier: $14/month per host for monthly billing.
- Annual Billing: $12/month per host when billed yearly.
- G2 Rating: 4.4/5
Top 7 Blue Matador Alternatives
1. CubeAPM

Known For
CubeAPM is recognized for its cost-effective, full-stack observability solution, offering comprehensive monitoring capabilities including APM, RUM, logs, infrastructure, and synthetic monitoring.
Key Features
- Distributed Tracing: Provides end-to-end tracing across microservices to identify performance bottlenecks.
- Synthetic Monitoring: Simulates user interactions to proactively detect issues before they impact real users.
- Log Aggregation: Collects and analyzes logs for efficient troubleshooting.
- Infrastructure Monitoring: Monitors servers, databases, and other critical components to ensure system health.
- Error Tracking: Identifies and alerts on application errors for prompt resolution.
Standout Features
- Smart Sampling: Utilizes contextual information like latency and error rates to make intelligent sampling decisions, enhancing data efficiency.
- On-Prem Hosting: Offers on-premises deployment to comply with data localization laws and reduce latency.
- High Compatibility: Seamlessly integrates with popular agents such as New Relic, Datadog, OpenTelemetry, Prometheus, and Elastic.
Pros
- Cost-effective pricing model.
- Comprehensive monitoring capabilities.
- Flexible deployment options.
- Rapid setup and integration.
- 800+ integrations
- Zero cloud egress costs
Cons
- Not suited for teams looking for off-prem solutions
- Strictly an observability platform and does not support cloud security management
Best For
- Small to medium-sized businesses seeking a comprehensive and affordable observability solution.
Pricing & Customer Reviews
- Pricing: Offers a competitive pricing structure, with data ingestion costs at $0.15/GB.
- G2 Rating: 5/5
CubeAPM vs Blue Matador
Blue Matador excels in cloud-native and Kubernetes monitoring with automated alerting built around infrastructure metrics, while CubeAPM offers full-stack observability with OpenTelemetry-native support and predictable pricing for teams that need broader visibility as their environments grow.
2. Datadog
Known For
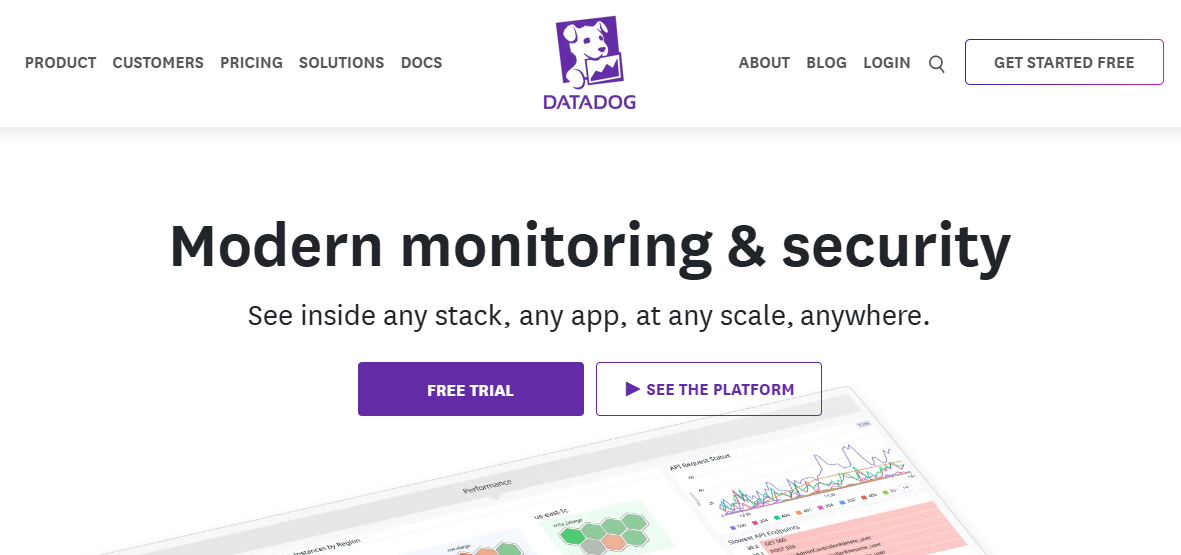
Datadog is renowned for its unified monitoring and analytics platform, providing full-stack observability with a wide range of integrations and advanced analytics capabilities.
Key Features
- APM: Offers distributed tracing and detailed performance analytics.
- Log Management: Collects, searches, and analyzes logs in real-time.
- Infrastructure Monitoring: Monitors servers, databases, and cloud services.
- Synthetic Monitoring: Simulates user interactions to test application performance.
- RUM: Monitors real user interactions to understand user experience.
Standout Features
- Advanced Analytics: Provides deep insights into application performance and infrastructure health.
- Extensive Integrations: Supports over 400 integrations with various tools and services.
- Machine Learning: Utilizes machine learning to detect anomalies and predict potential issues.
Pros
- Comprehensive monitoring capabilities.
- Scalable and flexible platform.
- Robust support and documentation.
Cons
- Pricing can become expensive as data volume increases.
- The user interface can be overwhelming for new users.
Best For
- Large enterprises require a scalable and feature-rich observability platform.
Pricing & Customer Reviews
- Infrastructure Monitoring (Pro Plan): $15/host/month
- APM (Pro Plan): $35/host/month
- Logs: $0.10/per ingested GB/month
- Rating: 4.4/5 on G2
- Most users acknowledge its powerful features and comprehensive monitoring capabilities, but raise concerns about costs
Datadog vs Blue Matador
Datadog provides a broad observability platform with extensive integrations and application-level visibility across complex environments, while Blue Matador emphasizes cloud-native and Kubernetes monitoring with automated, metrics-driven alerting and simpler operational overhead.
3. Grafana
Known For
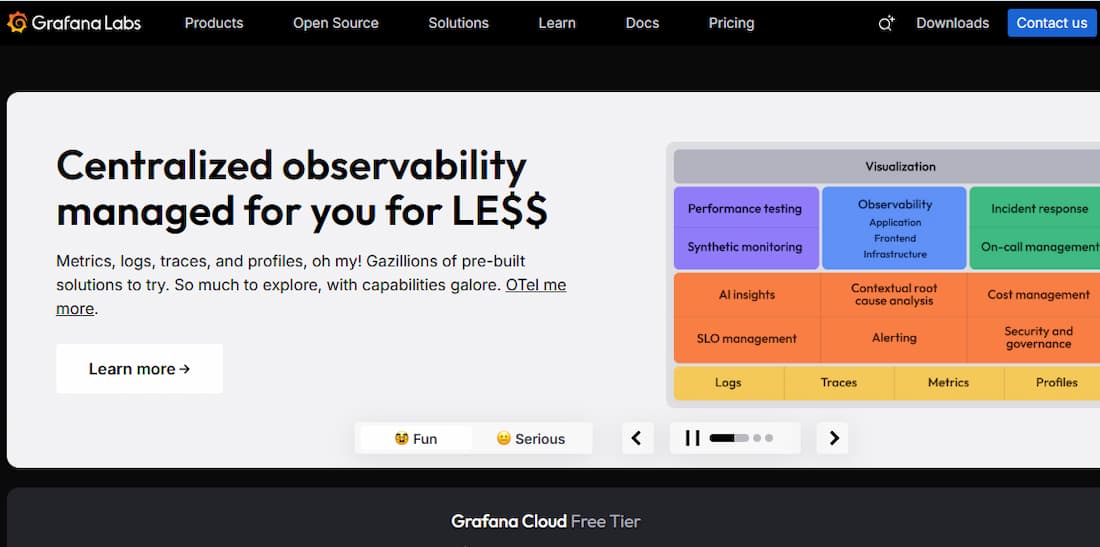
Grafana is primarily known for its powerful open-source data visualization platform, widely used for monitoring and analyzing time-series data. It provides users with the ability to create interactive and customizable dashboards, making it ideal for visualizing metrics from various sources.
Key Features
- Custom Dashboards: Grafana enables users to create highly customizable dashboards with real-time visualizations of their data.
- Data Source Integration: It integrates seamlessly with various data sources like Prometheus, Graphite, and Elasticsearch, allowing users to visualize data from multiple platforms in one place.
- Alerting: Grafana supports real-time alerts, which can be configured to notify users about issues with their systems, such as performance degradation or resource exhaustion.
- Plugins: Grafana supports a wide range of plugins that extend its functionality, including visualization types and data source connectors.
- Open-Source: Grafana is open-source, making it a cost-effective solution for organizations that want a flexible observability platform without the licensing costs associated with other tools.
Standout Features
- Time-Series Data Focus: Grafana is renowned for its ability to visualize time-series data, which is ideal for monitoring infrastructure and application performance over time.
- Dashboard Sharing: Grafana allows teams to share and collaborate on dashboards, enhancing teamwork and ensuring consistent monitoring across organizations.
- Alerting & Notification Channels: Grafana offers extensive alerting capabilities, including integration with email, Slack, and other communication channels, allowing teams to stay on top of critical issues in real time.
Pros
- The open-source nature of Grafana makes it a very affordable option, especially for small to medium-sized teams.
- Grafana’s flexibility in data visualization and dashboard creation makes it a favorite among developers and system administrators.
- Grafana supports a large ecosystem of data sources, providing users with the flexibility to work with multiple platforms.
Cons
- Steep learning curve
- Complex setup requirements
- Overwhelming UI
Best For
- Organizations focusing on visualization of metrics from various sources and teams are looking for an open-source alternative that integrates well with other observability tools like Prometheus and InfluxDB.
Pricing & Customer Review
- Grafana OSS: Free
- Pro plan: $19/month
- Metrics: $6.50/ 1k series
- Logs: $0.50/GB ingested
- Traces: $0.50/GB ingested
- Rating: 4.5/5 on G2.
- Reviewers appreciate its flexibility, visualization capabilities, and wide range of integrations. However, some users note a steeper learning curve, particularly when integrating complex data sources.
Grafana vs Blue Matador
Grafana is widely used for visualization and dashboarding, often relying on separate backends for metrics, logs, and traces, while Blue Matador focuses on cloud-native and Kubernetes monitoring with automated alerting built around infrastructure metrics.
4. Sumo Logic

Known For
Sumo Logic is recognized for its cloud-native machine data analytics platform, designed to provide real-time observability into application performance, security, and business operations. It offers comprehensive log management, monitoring, and advanced analytics to help teams detect, troubleshoot, and optimize their systems.
Key Features
- Log Management: Sumo Logic excels in collecting, managing, and analyzing large volumes of machine data and logs, offering deep insights into system health and performance.
- Real-Time Analytics: It enables real-time log and metric analytics, helping organizations quickly detect and resolve performance issues.
- Cloud-Native Architecture: Sumo Logic is built for the cloud, offering scalable and flexible solutions for enterprises of all sizes. It leverages the scalability of the cloud to process vast amounts of data efficiently.
- Security Monitoring: It provides security analytics and threat detection, helping teams to identify and respond to potential vulnerabilities in real time.
- APM: While Sumo Logic’s primary focus is on log management, it also includes APM features for monitoring application performance, tracing user transactions, and identifying bottlenecks.
Standout Features
- Advanced Machine Learning: Sumo Logic uses machine learning to analyze and predict trends in system and application behavior, automating anomaly detection and optimizing troubleshooting efforts.
- End-to-End Visibility: Sumo Logic provides end-to-end visibility across applications, infrastructure, and security, helping organizations ensure seamless monitoring of their entire environment.
- Custom Dashboards: Users can create customizable dashboards that consolidate metrics, logs, and traces for a comprehensive view of system health.
Pros
- Sumo Logic’s cloud-native architecture allows it to scale with organizations, handling increasing data volumes and complexity without performance degradation.
- The machine learning capabilities and AI-powered analytics provide proactive insights and allow for faster troubleshooting.
- Sumo Logic is known for its robust security features, which help detect and mitigate threats in real-time, making it ideal for security-conscious teams.
Cons
- Users find the UI cumbersome, hindering usability
- Steep learning curve, especially for Sumo Logic’s complex queries
- Slow performance due to UI unresponsiveness
- Expensive, especially when scaling
Best For
- Large enterprises are looking for a comprehensive, cloud-native observability platform that can manage log data, monitor application performance, and secure operations.
- Organizations with a strong focus on security and compliance, as Sumo Logic, excel in providing real-time security analytics and threat detection.
Pricing & Customer Reviews
- Sumo Logic offers a free tier for small teams.
- Starts around $3.14 per TB scanned
- Customer Rating: 4.3/5 on G2
- Customers praise its powerful analytics and cloud-native flexibility. Some users mention that its pricing structure can be complex and expensive for larger data volumes.
Sumo Logic vs Blue Matador
Sumo Logic offers a broad, cloud-native observability platform with strong log analytics and integrated monitoring capabilities, while Blue Matador focuses on cloud-native and Kubernetes monitoring with automated, metrics-driven alerting and minimal configuration.
5. Dynatrace
Known For
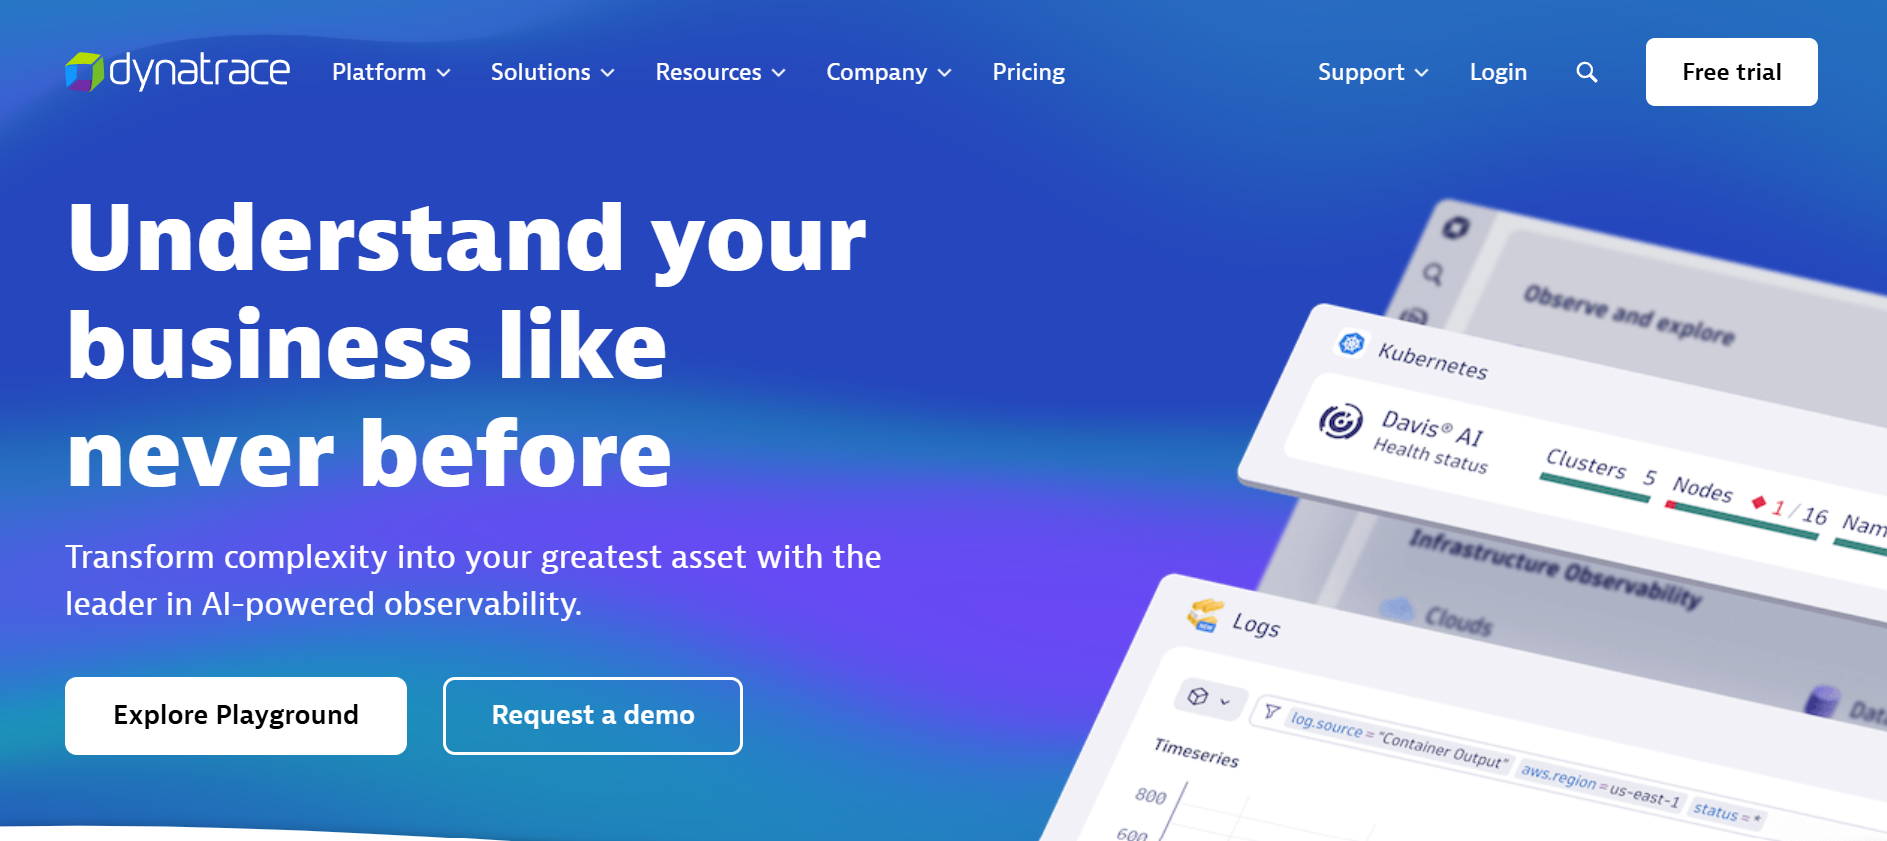
Dynatrace is a leading, AI-powered observability platform known for providing full-stack monitoring and performance insights for applications, infrastructure, and user experiences. It is designed for enterprises that require deep visibility into complex environments, offering robust APM, infrastructure monitoring, and cloud-native observability.
Key Features
- AI-Powered Monitoring: Dynatrace uses artificial intelligence to automatically detect and analyze performance issues, reducing the need for manual configuration and providing proactive insights.
- Full-Stack Observability: It offers end-to-end monitoring across applications, infrastructure, services, and user interactions, ensuring that no part of the stack is overlooked.
- Distributed Tracing: Dynatrace provides advanced distributed tracing capabilities to identify and troubleshoot issues across microservices and complex distributed systems.
- Cloud-Native Support: Designed for modern cloud environments, Dynatrace offers deep visibility into Kubernetes, containers, and serverless architectures.
- Log Management and Analytics: It collects, stores, and analyzes logs, making it easier to troubleshoot and resolve issues quickly.
Standout Features
- Smart AI Detection: Dynatrace uses its AI engine, Davis, to automatically detect anomalies, predict issues before they affect users, and provide root cause analysis without manual intervention.
- OneAgent Technology: Dynatrace’s proprietary OneAgent automatically instruments applications, containers, and services, simplifying setup and ensuring complete visibility with minimal configuration.
- Real User Monitoring (RUM): Dynatrace offers detailed insights into user behavior and application performance from the user’s perspective, which is essential for optimizing customer experience.
Pros
- Dynatrace provides a unified view of the entire tech stack, ideal for enterprises requiring deep insights into complex environments.
- The AI-powered analysis and auto-detection of anomalies help teams quickly identify performance issues and reduce downtime.
- Designed to scale with enterprise needs, offering robust monitoring for large and complex infrastructures, including cloud-native and hybrid environments.
Cons
- Dynatrace’s pricing can be prohibitive for small and medium-sized businesses.
- Steep learning curve
- Overwhelming UI & data overload
Best For
- Large Enterprises and Complex Environments: Dynatrace is best suited for large organizations with intricate IT infrastructures and a need for comprehensive, AI-powered observability. It is ideal for enterprises operating in cloud-native environments, with a mix of on-premise, hybrid, and multi-cloud deployments.
Pricing & Customer Reviews
- Full-Stack Monitoring: $58 /month/per 8 GiB host*
- Infrastructure Monitoring: $29 /month/per host*
- Customer Rating: 4.5/5 on G2
- Users praise its comprehensive monitoring capabilities and AI-driven insights. Some note the platform’s complexity and higher cost, which may be a consideration for smaller businesses.
Dynatrace vs Blue Matador
Dynatrace delivers a comprehensive observability platform with deep automation and application-level visibility across complex environments, while Blue Matador focuses on cloud-native and Kubernetes monitoring with automated, metrics-driven alerting designed to simplify infrastructure monitoring.
6. New Relic
Known For
New Relic is one of the most widely recognized and trusted APM (Application Performance Monitoring) solutions. Known for its ability to monitor applications, infrastructure, and customer experiences in real-time, New Relic is a leading choice for enterprises seeking a unified observability platform.
Key Features
- APM (Application Performance Monitoring): New Relic provides comprehensive APM capabilities, including distributed tracing, performance monitoring, and detailed transaction analysis to help teams identify bottlenecks and optimize applications.
- Real User Monitoring (RUM): Offers detailed insights into user behavior and performance, allowing teams to optimize the customer experience.
- Infrastructure Monitoring: Monitors the health and performance of infrastructure, including servers, containers, and cloud services, providing visibility into the underlying resources supporting applications.
- Log Management: Collects, analyzes, and visualizes logs in real-time, allowing teams to quickly diagnose and resolve issues.
- Synthetic Monitoring: Simulates user interactions with applications to test performance under various conditions, identifying potential issues before they impact real users.
Standout Features
- Full-Stack Observability: New Relic provides a unified view across all layers of your stack, from infrastructure to applications and user interactions, making it ideal for teams that need comprehensive visibility into their systems.
- AI-Powered Alerts: New Relic uses machine learning to detect anomalies and generate alerts based on predictive analytics, helping teams proactively address issues before they escalate.
- Custom Dashboards: Users can create customizable dashboards that consolidate key metrics from applications, infrastructure, and logs, providing teams with a comprehensive view of system health.
Pros
- New Relic excels at providing end-to-end observability, covering everything from application performance to infrastructure and user experience.
- Despite its extensive features, New Relic’s interface is relatively intuitive and easy to navigate for both beginners and advanced users.
- New Relic is highly scalable, making it suitable for both small teams and large enterprises with complex, distributed environments.
Cons
- Expensive, especially when scaling
- Steep learning curve for NRQL and dashboard configuration
- Complex initiat setup
Best For
- Large Enterprises: New Relic is best suited for large organizations or enterprises with complex, distributed systems that need a full-stack monitoring solution with in-depth insights and high scalability.
- Teams Looking for Full-Stack Visibility: New Relic is ideal for businesses that need a unified observability platform to monitor applications, infrastructure, and user interactions.
Pricing & Customer Reviews
- Free tier: 100GB/month
- Pro Plan: $0.40/GB ingested beyond the 100GB free limit
- Pro Plan: $349/month for full platform user
- Customer Rating: 4.4/5 on G2
- Users praise its comprehensive monitoring capabilities and user-friendly interface, though some mention that the pricing and setup complexity can be challenging, particularly for smaller businesses.
New Relic vs Blue Matador
New Relic provides a broad observability platform with application performance monitoring, logs, and distributed tracing across diverse environments, while Blue Matador emphasizes cloud-native and Kubernetes monitoring with automated, metrics-driven alerting and minimal setup.
7. Uptrace

Known For
Uptrace is an open-source APM (Application Performance Monitoring) tool known for providing observability and performance insights into applications, particularly focused on distributed tracing. It is designed to help developers and teams monitor, troubleshoot, and optimize the performance of their applications, providing deep visibility into microservices and complex architectures.
Key Features
- Distributed Tracing: Uptrace excels at providing distributed tracing for applications, allowing teams to trace requests as they flow through multiple services and microservices. This helps pinpoint performance bottlenecks and errors.
- APM: It provides real-time application performance monitoring, including metrics, traces, and logs, to help users identify and fix issues quickly.
- Metrics Collection: Uptrace collects key performance metrics such as response times, error rates, and throughput, which are crucial for understanding how well an application is performing.
- Error Tracking: Tracks errors in applications, helping teams quickly resolve performance and reliability issues.
- Open-Source: As an open-source solution, Uptrace offers a cost-effective observability solution, especially for teams that want a customizable and community-supported platform.
Standout Features
- Cloud-Native and Lightweight: Uptrace is designed to be lightweight and efficient, with minimal resource overhead. It is also optimized for use in cloud-native environments, such as Kubernetes.
- Integration with OpenTelemetry: Uptrace integrates seamlessly with OpenTelemetry, making it compatible with various other observability tools and offering flexibility in terms of instrumentation.
- Cost-Effective: Being open-source, Uptrace is a very cost-effective solution, making it ideal for smaller teams or organizations with budget constraints.
Pros
- As an open-source tool, Uptrace is free to use, making it a great option for teams with limited budgets or those who prefer an open-source solution.
- Uptrace is relatively easy to set up, especially for teams familiar with OpenTelemetry, as it supports the standard for collecting traces and metrics.
- Uptrace is designed to minimize resource consumption, ensuring that it does not introduce unnecessary overhead to applications.
Cons
- Some advanced features require setup efforts, especially when self-hosted
- Operational overhead, especially when self-hosted
- High operational overhead to manage ClickHouse, OTEL Collector, and configs.
Best For
- Small to Medium-Sized Teams: Uptrace is ideal for smaller teams or startups that need a lightweight, cost-effective APM tool for distributed tracing and basic application performance monitoring.
- Organizations Looking for an Open-Source Solution: It is perfect for organizations that prefer open-source software and want to customize their observability setup.
Pricing & Customer Reviews
- Traces and Logs: starts at $0.08 per GB
- Metrics: starts at $0.001 per series
- ProductHunt Rating: 4.8 / 5
- Users appreciate its simplicity, ease of use, and low cost. However, some users mention the lack of advanced features and integrations compared to commercial alternatives.
Uptrace vs Blue Matador
Uptrace offers a more lightweight and cost-effective solution compared to Blue Matador, especially for teams that prioritize distributed tracing and basic performance monitoring. While Blue Matador provides more comprehensive monitoring capabilities, including error tracking and synthetic monitoring, Uptrace excels in providing a simple and open-source alternative for teams that need essential observability features without the additional cost and complexity. However, Uptrace’s feature set may be insufficient for larger organizations or those with more complex monitoring needs.
Conclusion
s businesses grow, the demand for advanced and cost-efficient APM tools increases. While Blue Matador works well for smaller teams, larger or more complex infrastructures often require alternatives with richer features, better scalability, and competitive pricing. Solutions like CubeAPM, Datadog, and Dynatrace deliver robust capabilities and flexible deployment models to meet these needs.
Alternatives such as Coralogix, Grafana, and Sumo Logic offer specialized strengths — from advanced log analytics and cloud-native support to strong security monitoring. For simplicity and cost savings, Uptrace provides a solid open-source option, while CubeAPM stands out as a comprehensive yet affordable choice. The right pick ultimately depends on your budget, features, and scalability requirements.
Disclaimer: The information in this article reflects the latest details available at the time of publication and may change as technologies and products evolve.
FAQs
1. What are the best alternatives to BlueMatador for Application Performance Monitoring (APM)?
Some of the best alternatives to BlueMatador for APM include CubeAPM, Datadog, Coralogix, Dynatrace, and New Relic. These tools offer a range of features such as distributed tracing, full-stack observability, and advanced analytics, with varying pricing and scalability options.
2. Is CubeAPM a better alternative to BlueMatador?
Yes, CubeAPM is often considered a better alternative due to its cost-effectiveness, advanced features like synthetic monitoring, error tracking, and full-stack observability. CubeAPM is more affordable and offers greater flexibility compared to BlueMatador.
3. How does Datadog compare to BlueMatador?
Datadog offers a more feature-rich solution with AI-powered insights, extensive integrations, and scalability, making it ideal for larger enterprises. In contrast, BlueMatador is simpler and more affordable, but lacks the advanced capabilities of Datadog.
4. Can Coralogix replace BlueMatador for log management and monitoring?
Yes, Coralogix is a great alternative for log management and security monitoring, offering advanced real-time log analysis and cost-effective pricing. However, it focuses more on log analytics than BlueMatador’s broader APM and infrastructure monitoring capabilities.
5. What is the pricing difference between BlueMatador and its alternatives?
BlueMatador is generally more affordable, with lower data ingestion and transfer costs. Alternatives like Datadog, Dynatrace, and New Relic tend to be more expensive, particularly for larger data volumes. CubeAPM offers a competitive pricing model that is more cost-effective than both BlueMatador and its larger competitors.


