ScoutAPM is a lightweight, developer-focused application performance monitoring tool designed specifically for teams using Ruby, Python, Elixir, and PHP. It delivers fast, automatic tracing, intuitive N+1 query detection, and memory bloat alerts with minimal setup.
However, ScoutAPM lacks certain features, such as RUM and synthetic testing. Plus, if logs exceed 1GB per month and 5,000 errors per month, respectively, you will need to take logs and error monitoring add-ons, which cost extra. It’s a SaaS-based platform with no self-hosting or on-premise deployment, which could be a concern for compliance-focused businesses.
CubeAPM stands out as the best ScoutAPM alternative with built-in RUM and synthetic monitoring and full self-hosting to help businesses meet compliance requirements. Its capabilities include smart sampling, intelligent alerting, intuitive dashboards, etc., all under a simple pricing of $0.15/GB with no extra charges for logs, error monitoring, data retention, or egress.
In this article, we explore 7 top ScoutAPM alternatives, based on features, pricing, deployment options, and more.
Top 7 ScoutAPM Alternatives
- CubeAPM
- New Relic
- Datadog
- Dynatrace
- Splunk Appdynamics
- Sentry
- Sumologic
Why People Are Looking for ScoutAPM Alternatives
Missing Features
Scout APM excels at identifying application-level performance bottlenecks like N+1 queries, memory bloat, and slow database calls. However, features such as synthetic testing and real user monitoring (RUM) are not yet supported by Scout APM, according to their documentation. Teams requiring those functions may have to use other tools, which adds complexity and cost.
absence of OpenTelemetry support and lack of self-hosting options further restrict Scout’s suitability for cloud-native or enterprise-grade environments.
Extra Charges
Scout APM offers a free plan with 300k transactions/month, while paid plans cost $19-$299/month with fixed monthly transaction quotas (e.g., 600k/month-9M/month) with unlimited users. However, if you need additional log management and error monitoring, you will need to purchase add-ons. The log monitoring add‑on is priced at $40/month for 30 GB storage. But users consuming more telemetry incur overages at $0.46/GB. Similarly, the error monitoring add-on is priced at $19/month for 50,000 errors. Since no synthetics and RUM are available, you will require different tools if you need these functionalities.
No Self-Hosting
Scout APM is a SaaS platform, with no mention of self-hosting or on-premise deployment on their website at the time of writing this article. Although they mention that users can opt for a custom plan, the details are not mentioned. Since the platform is SaaS, the data goes through their servers, which might not be suitable for organizations with strict data sovereignty needs.
Criteria for Selecting ScoutAPM Alternatives
1. OpenTelemetry-Native Support
The alternative should fully support OpenTelemetry (OTEL) as a first-class citizen, enabling standardized telemetry collection and seamless migration across tools. Native OTLP ingestion eliminates vendor lock-in and supports scalable instrumentation across languages and frameworks.
2. Full MELT Coverage (Metrics, Events, Logs, Traces)
Modern observability requires unified insights, not just traces. Ideal platforms should offer integrated metrics dashboards, log search, distributed traces, event timelines, and anomaly detection in one UI for holistic debugging and analysis.
3. Smart or Tail-Based Sampling
Alternatives must include advanced sampling techniques like tail-based or context-aware sampling. These reduce noise and retain only high-value traces (e.g., error-prone, slow spans), helping teams optimize visibility without incurring high data volume costs.
4. Transparent, Scalable Pricing
Clear and predictable pricing—preferably based on data volume rather than transactions or host count—is key. Platforms like CubeAPM offer flat per-GB pricing with no hidden user or retention fees, unlike ScoutAPM’s overage-based billing model.
5. Long-Term Retention Options
Retaining data for 30, 60, or 90 days (or longer) should be possible without expensive upgrades. This is essential for postmortem analysis, SLA audits, performance benchmarking, and tracking regressions across releases.
6. Support for RUM and Synthetic Monitoring
Alternatives should provide built-in Real User Monitoring (RUM) to capture frontend performance and Synthetic Monitoring to simulate user journeys. These capabilities help measure user experience and uptime, which Scout lacks entirely.
7. Self-Hosting or Hybrid Deployment Options
Compliance-focused teams need flexibility to deploy observability tools on-prem or in private clouds. A strong alternative should offer both SaaS and self-hosting options to meet data residency, privacy, or air-gapped environment needs.
8. Responsive and Reliable Support
Enterprise-ready platforms should offer fast support through Slack or live chat, not just slow ticketing systems. Real-time help during outages or onboarding accelerates adoption and reduces MTTR during incidents.
9. Ease of Migration from ScoutAPM
Seamless onboarding, agent compatibility (e.g., OTEL, Prometheus, New Relic formats), and import tools help reduce friction while switching. Platforms with built-in agent support or no-code setups allow teams to transition within hours.
ScoutAPM Overview
Known for
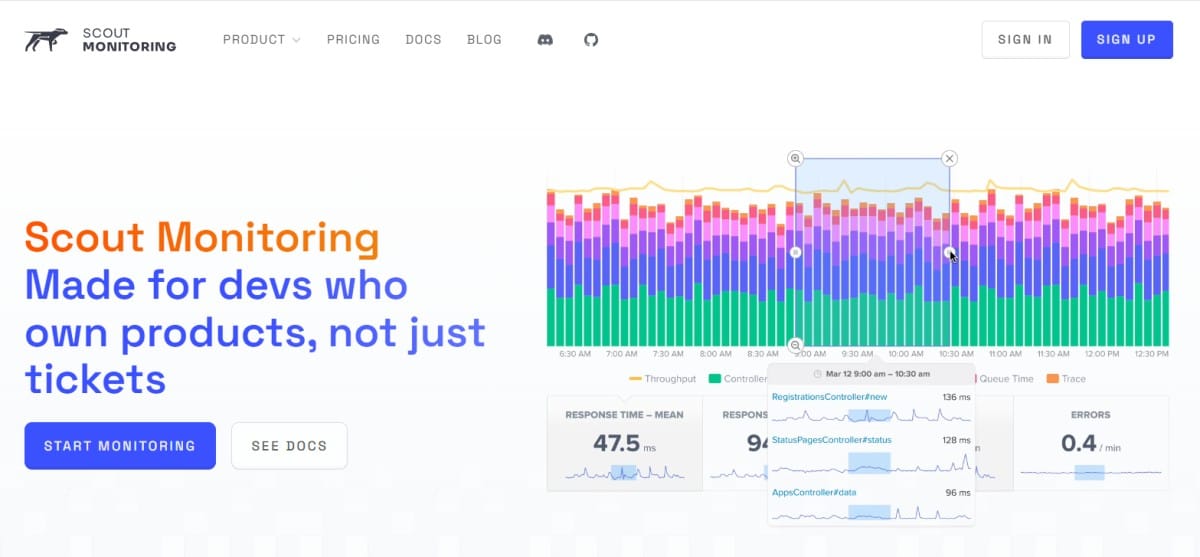
ScoutAPM is best known for its developer-centric application performance monitoring tailored to monolithic and service-based applications written in Ruby, Python, Elixir, and PHP. Designed for engineering teams who value ease of setup and lightweight agents, Scout focuses on helping developers detect performance bottlenecks like N+1 queries, memory bloat, and slow database calls without deep configuration. With minimal onboarding and straightforward UI, it appeals especially to small SaaS teams and backend-heavy environments.
Standout Features
- N+1 Query Detection: Scout automatically identifies inefficient database patterns such as N+1 queries in real time and highlights them directly in transaction traces—helping developers resolve them before they impact user experience.
- Memory Bloat Tracking: Offers per-request memory usage trends and tracks objects allocated by each endpoint, allowing teams to debug and optimize memory-intensive routes.
- Developer Attribution: Maps code-level performance issues directly to GitHub commits and contributors, so engineers can trace bottlenecks to specific releases or developers.
- Intelligent Backtrace Filtering: Highlights relevant lines of code (excluding vendor/gem noise) within backtraces to accelerate debugging without clutter.
- GitHub & Deploy Integration: Annotates performance timelines with deploy markers and versioning insights, allowing visibility into how each deployment affects system behavior.
Key Features
- Transaction Tracing: Breaks down individual web requests into trace segments, showing time spent in database calls, external services, and custom code paths for bottleneck identification.
- Language Support: Offers native instrumentation for Ruby, Python, Elixir, and PHP, with support for Sidekiq and other background job workers in Ruby environments.
- Error Monitoring: Integrates lightweight error tracking into APM view, enabling unified inspection of performance and exception traces.
- Basic Alerting: Supports basic threshold-based alerting through Slack, email, or PagerDuty, though with limited rule customization or anomaly detection.
- Log Monitoring Add-on: Available at additional cost, it offers basic ingestion and viewing of logs, though not deeply correlated with traces or metrics.
- Simple Setup: Agent installation typically takes under 5 minutes, with minimal configuration and auto-instrumentation for common frameworks.
Pros
- Lightweight agents and low overhead make it well-suited for small services and environments with tight resource constraints.
- Fast setup and a clean UI reduce friction for teams without dedicated observability engineers
- Native integrations with GitHub, Slack, and error monitoring simplify daily developer workflows
- Effective N+1 query detection helps backend engineers optimize performance in legacy monoliths
Cons
- No native support for RUM or synthetic testing
- No self-hosting
Best for
ScoutAPM is best suited for early-stage startups or small engineering teams working in Ruby, Python, or Elixir monoliths who need fast performance insights with minimal configuration. It’s ideal for teams that prioritize developer productivity over full-stack observability and operate within predictable traffic patterns and simple infrastructure.
Pricing & Customer Reviews
- Free Tier: 300k transactions/month, community support
- Startup: $19/month, 600k monthly transactions, community support
- Small: $39/month, 1.2M, monthly transactions, priority support
- Medium: $99/month, 3M monthly transactions, priority support
- Large: $299/month, 9M monthly transactions, priority support
- Log management add-on: $40/month for 30 GB, $0.46/GB on demand
- G2 Rating: 4.6/5
- Praised for: Clean UI, developer-first workflows, N+1 detection, low install effort
- Criticized for: Log overage charges
Top 7 ScoutAPM Alternatives
1. CubeAPM
Known for
CubeAPM is a modern observability platform built entirely on OpenTelemetry (OTEL), enabling full MELT (Metrics, Events, Logs, Traces) visibility for distributed cloud-native applications. It’s best known for combining seamless onboarding, smart data control, and flat pricing with the flexibility to deploy in SaaS, on-prem, or bring-your-own-cloud environments. CubeAPM is often chosen by teams looking to migrate away from complex legacy APM stacks and eliminate hidden fees or vendor lock-in.
Standout Features
- Smart Sampling Engine: Filters telemetry in real-time based on context such as latency, error rate, or transaction type, retaining only high-value spans and reducing trace volumes by up to 80%.
- Agent Compatibility for Seamless Migration: Drop-in compatibility with Datadog, New Relic, AppDynamics, and Prometheus agents makes it easy to switch without code changes.
- Slack-Native Support Model: Users get direct Slack or WhatsApp access to core engineering support, typically resolving queries within 5 minutes, unlike legacy ticket-based SLAs.
- One-Hour Deployment: CubeAPM can be fully deployed, including agents and dashboards, within 60 minutes with zero custom instrumentation required.
Key Features
- Full MELT Observability: Covers metrics, logs, traces, events, real user monitoring (RUM), synthetic checks, and error tracking in one unified platform.
- OpenTelemetry-Native Architecture: Built from the ground up on OTEL standards—allowing vendor-agnostic instrumentation and seamless signal portability.
- Cost-Efficient Pricing Model: Offers flat ingestion pricing with no per-user or per-host billing. Teams pay only for what they store, starting at $0.15/GB.
- Flexible Deployment Options: Supports SaaS, on-premise, and VPC-hosted models to meet compliance mandates like GDPR, HIPAA, and RBI.
- Kubernetes & Infra Dashboards: Auto-discovers infrastructure, Kubernetes clusters, and services with prebuilt dashboards and service maps.
- Enterprise-Grade Access Controls: Comes with role-based access control (RBAC), audit logging, SSO/SAML integration, and full tenant isolation for secure usage across teams.
Pros
- 800+ integrations
- Zero cloud egress charges
- Offers complete MELT coverage without needing separate tools
- Smart sampling significantly reduces cost while preserving insights
- One-click migration and OTEL-native design eliminate lock-in
- Slack-based support delivers sub-5-minute response times
- No per-seat pricing makes it accessible for engineering-heavy orgs
- Fast deployment and setup without vendor agents or SDK customization
Cons
- Not suited for teams looking for off-prem solutions
- Strictly an observability platform, and does not support cloud security management
Best for
CubeAPM is ideal for engineering, DevOps, and SRE teams that want to move beyond siloed monitoring tools and adopt a unified, OpenTelemetry-native observability platform. It’s especially valuable for teams that need tight control over data ingestion costs, flexible deployment models, and compliance with regulatory data localization standards.
Pricing & Customer Reviews
- Ingestion Cost: $0.15/GB (includes RUM, logs, infra, synthetics, error tracking)
- Score: 4.7/5
- Praised for: Transparent pricing, quick deployment, Slack-first support
CubeAPM vs ScoutAPM
Unlike ScoutAPM, which lacks features such as RUM and synthetics, CubeAPM offers full-stack observability, including RUM and synthetic monitoring. While Scout enforces hard transaction limits and paid log add-ons, CubeAPM’s simple $0.15/GB pricing and smart sampling allow teams to scale observability affordably. Unlike Scout APM, CubeAPM offers self-hosting to help teams meet compliance requirements.
2. New Relic
Known for
New Relic is a SaaS-based observability platform built to serve developers, SREs, and platform teams that require granular control over telemetry. It provides full MELT stack monitoring with advanced dashboarding and telemetry query capabilities. With its custom query language and polished interface, New Relic is widely used for its real-time system visualization and integration with CI/CD pipelines.
Standout Features
- System Explorer View: Automatically maps application entities like services, containers, and hosts into a live dependency graph, making it easier to track how components interact during incidents.
- NRQL (New Relic Query Language): Empowers teams to run real-time queries across metrics, traces, logs, and events for granular telemetry analysis and highly customized visualizations.
- Lookout Anomaly Engine: Uses machine learning to detect anomalies such as unexpected error surges, latency spikes, or traffic drops, allowing early intervention.
- Custom Dashboards for Role-Based Views: Provides modular dashboard components that can be tailored to developers, ops, or business stakeholders—each with its own logic, layout, and data slices.
Key Features
- Unified MELT Observability: Monitors logs, traces, metrics, RUM, synthetic checks, and event streams within a cohesive UI for real-time debugging and monitoring.
- Language Auto-Instrumentation: Supports a wide range of backend languages—Java, Go, Python, Node.js, Ruby, and .NET, helping teams onboard quickly across services.
- Cloud & Deployment Pipeline Integration: Offers plug-and-play support for AWS, GCP, Azure, and Kubernetes, while tying observability into CI/CD tools like Jenkins, CircleCI, and GitHub Actions.
- Frontend + Synthetic Coverage: Includes synthetic transaction simulations and real user monitoring with session-level insights, giving visibility into actual user behavior and frontend issues.
- Behavioral Baselines via ML: Builds automated baselines from historical telemetry, flagging outliers or regressions with higher precision and fewer false alarms.
- Fast Agent-Based Setup: Ingests and visualizes telemetry almost instantly after agent installation, without requiring complex configuration or infrastructure changes.
Pros
- NRQL enables powerful, flexible telemetry querying and visualization
- Seamlessly merges all MELT data into a single real-time interface
- Strong ecosystem integrations across cloud and CI/CD platforms
- Dynamic service maps aid in tracing interdependencies across microservices
- SaaS-first model allows rapid deployment and faster time to value
Cons
- Does not offer on-prem or BYOC deployment; SaaS-only
- High and complex pricing based on ingestion, user seats, and add-ons
Best for
New Relic is best suited for cloud-native engineering teams looking for customizable observability and rich telemetry querying. It’s particularly effective for platform teams in microservices-heavy environments and those integrating observability deeply into their CI/CD lifecycle. If you prioritize flexible dashboards, strong cloud-native integrations, and fast onboarding via SaaS, New Relic is a compelling choice.
Pricing & Customer Reviews
- Free Tier: 100 GB/month ingestion, includes 1 core user
- Ingestion Pricing: $0.40/GB depending on retention period
- Core Users: $49/user/month
- Full Users: $349/user/month based on access level
- G2 Rating: 4.4/5 (500+ reviews)
- Praised for: Dashboard customization, powerful telemetry queries, and fast SaaS onboarding
- Criticized for: Pricing complexity, no self-hosting
New Relic vs ScoutAPM
New Relic goes far beyond ScoutAPM’s limited APM scope by offering full MELT observability, advanced query capabilities via NRQL, and a real-time SaaS dashboard experience. New Relic offers richer context across microservices, frontend, and infrastructure—but at a higher and more complex pricing tier.
3. Datadog
Known for
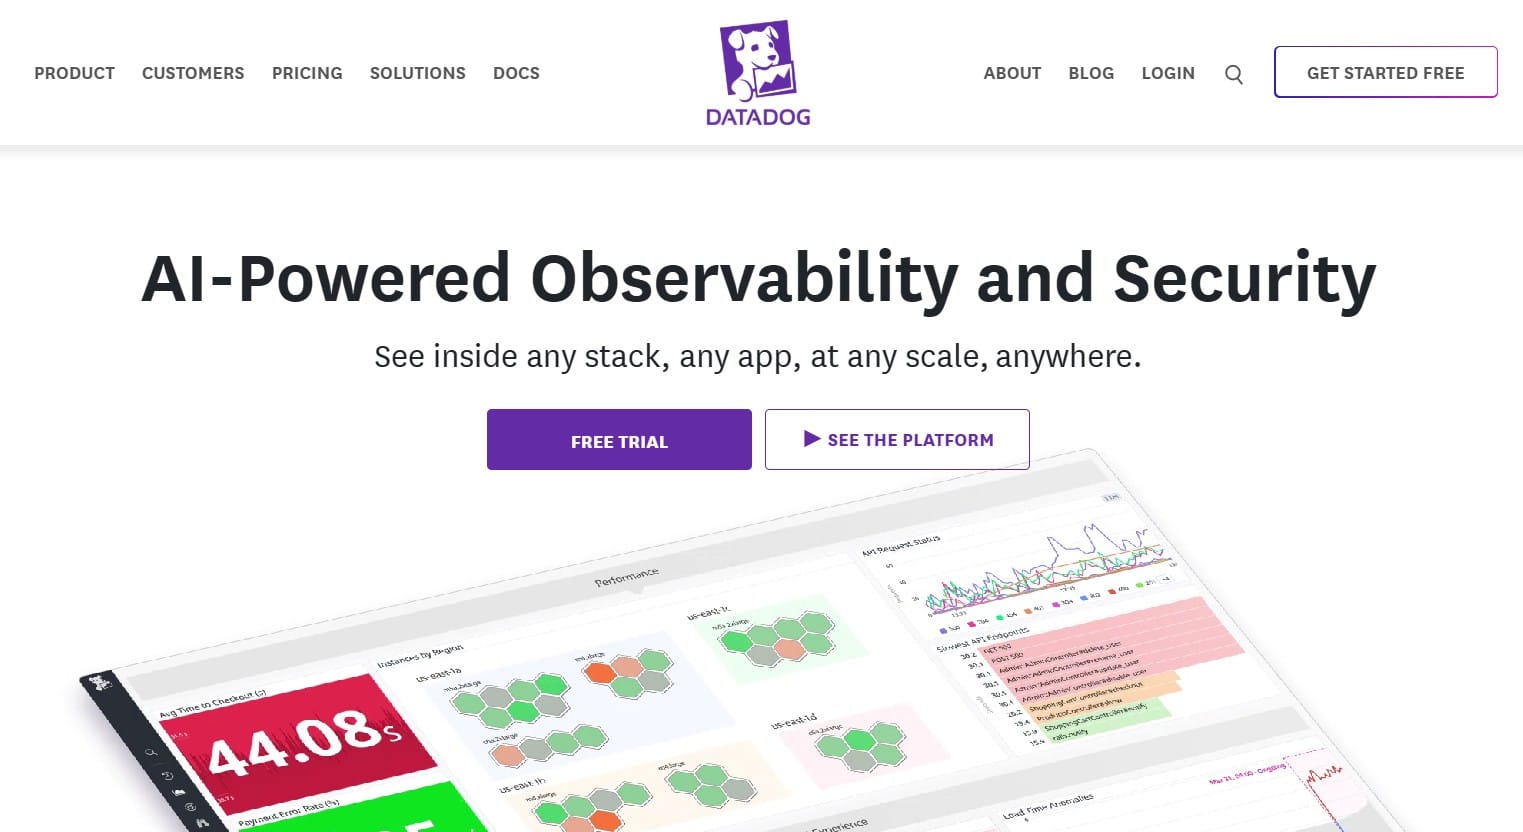
Datadog is a dominant observability and monitoring solution built for high-scale, cloud-native environments. With comprehensive support for infrastructure, applications, serverless, frontend, and even security layers, it offers DevOps and platform teams a single-pane view across their systems. Its strength lies in deep integrations, real-time dashboards, and seamless compatibility with cloud services like AWS, Azure, and GCP.
Standout Features
- Extensive Integration Ecosystem: Datadog features over 900 out-of-the-box integrations—including support for CI/CD tools, message queues, cloud services, and databases—drastically reducing setup time for complex environments.
- Collaborative Notebooks for RCA: Teams can jointly investigate incidents using shared notebooks that combine metrics, traces, and logs with embedded commentary, helping streamline root cause analysis.
- DevSecOps Observability: Goes beyond APM by adding modules like container security, CSPM, and workload protection—merging observability and security under one platform.
- Session Replay in RUM: Visualizes exact user interactions in real time for frontend troubleshooting, helping teams debug with behavioral insights instead of just error codes.
- Advanced Serverless Monitoring: Offers detailed visibility into AWS Lambda, Azure Functions, and GCP Cloud Functions—tracking cold starts, memory issues, and invocation latency at scale.
Key Features
- Unified MELT Telemetry: Captures metrics, logs, traces, synthetic checks, RUM data, and events into a single correlated UI, reducing silos and investigation times.
- Auto-Instrumentation for Multiple Languages: Supports agent-based instrumentation across Java, Python, Node.js, Go, .NET, and more, easing deployment across polyglot systems.
- Deep Cloud-Native Monitoring: Native hooks into Kubernetes, ECS, Fargate, and cloud-native services provide dynamic tracking of containers, clusters, and ephemeral workloads.
- Integrated Security Signals: Provides policy scans, threat detection, and audit events as part of its observability layer, enabling security and performance insights in one place.
- CI/CD Visibility: Connects deploy pipelines with observability data, so teams can tie regressions or errors directly to specific builds, commits, or environments.
- Real-Time Dashboards: Custom dashboards allow teams to monitor deployments, error rates, and latency live with drag-and-drop flexibility.
Pros
- Massive integration catalog accelerates time to value
- Combines observability and security features under one UI
- Notebooks and session replay enhance collaborative debugging
- Strong Kubernetes and serverless monitoring for dynamic infra
- Built-in ML-based anomaly detection improves alert accuracy
Cons
- Expensive
- No support for on-premise or self-hosting
Best for
Datadog is best suited for mid-to-large organizations running fast-scaling, multi-cloud environments—especially those built around Kubernetes, microservices, and serverless functions. Its blend of observability and security tooling also makes it attractive to SecOps and DevSecOps teams aiming for unified control and visibility across cloud stacks.
Pricing & Customer Reviews
- Infrastructure Monitoring: $15–$34 per host/month
- APM: $31–$40 per host/month (annual), $36 on-demand
- Logs: $0.10/GB ingestion + $1.70/million events for 15-day retention
- Serverless Monitoring: $10 per million invocations
- Security Suite: $15–$40 per user/month
- G2 Rating: 4.4/5 (based on 630+ reviews)
- Praised for: Extensive integrations, rich visualization tools, feature depth
- Criticized for: Unpredictable pricing, no self-hosting option, and limited OTEL-native support
Datadog vs ScoutAPM
While ScoutAPM offers a minimal APM-focused solution, Datadog delivers an expansive observability suite spanning frontend, backend, infra, and security. Its ecosystem, advanced dashboards, and collaborative tools are unmatched. However, Datadog’s ingestion-based pricing can rapidly scale, which may not be suitable for smaller teams.
4. Dynatrace
Known for
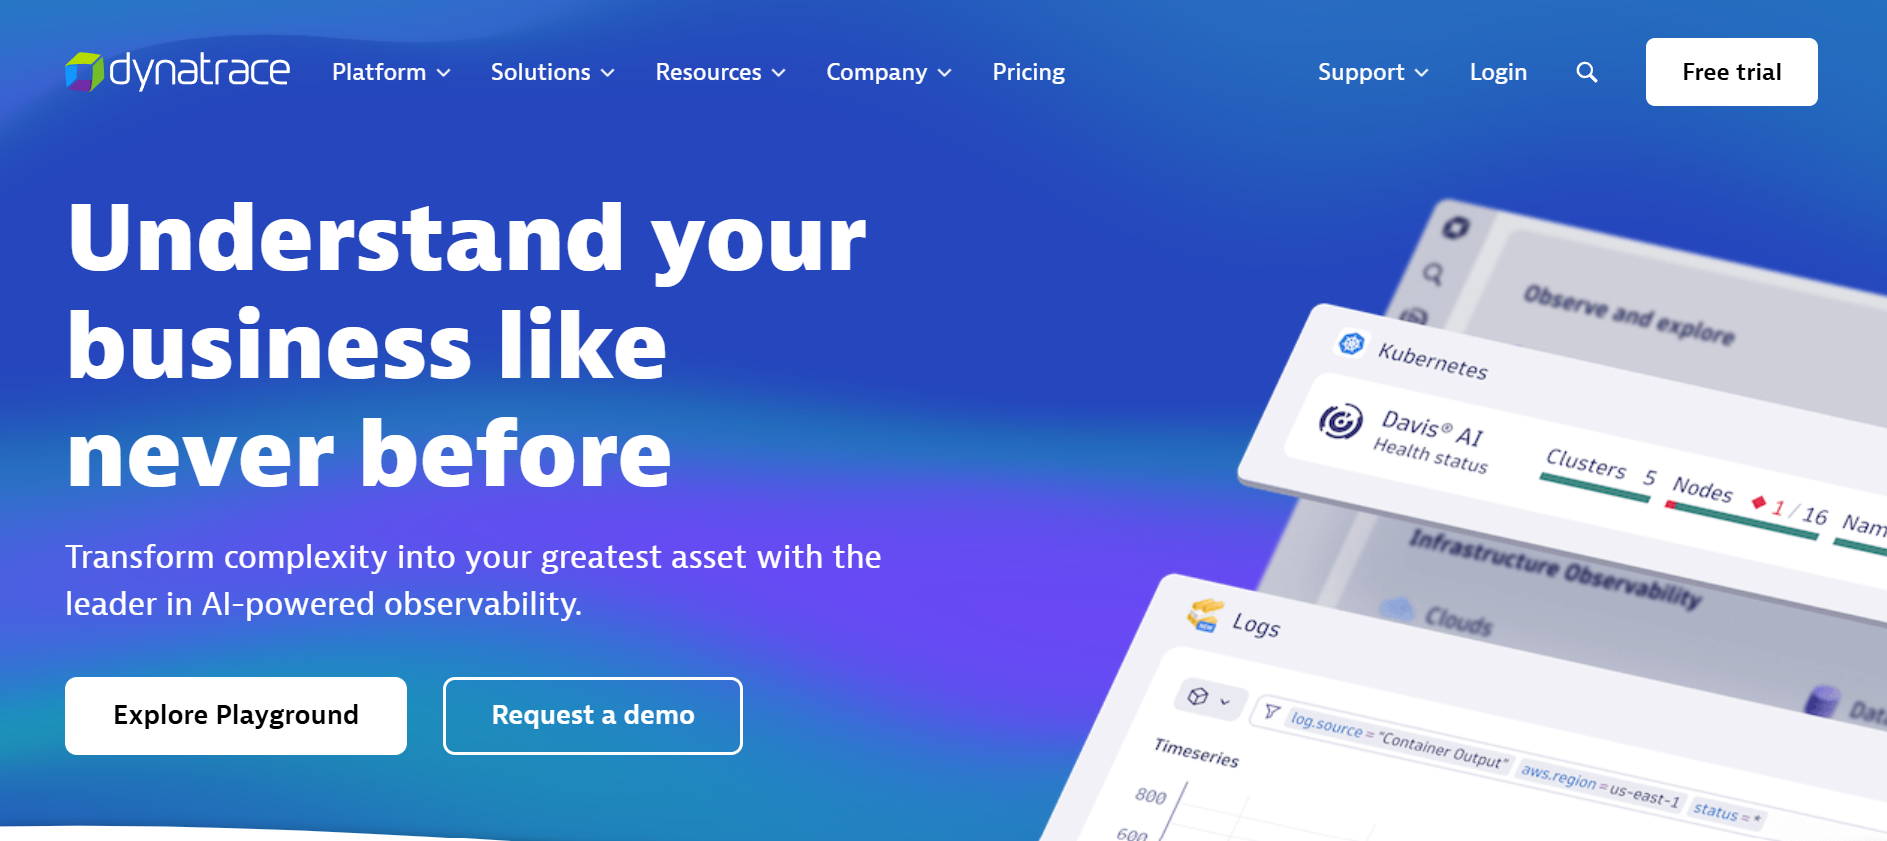
Dynatrace is an advanced enterprise-grade observability and security platform designed for teams running at scale. Known for its automated telemetry collection and AI-powered root cause detection, it’s a go-to choice for organizations prioritizing uptime, performance reliability, and operational efficiency. Dynatrace merges full-stack monitoring with application security and cloud-native intelligence, enabling precise insights without requiring manual tuning.
Standout Features
- Smartscape Topology Mapping: Automatically creates a live visual model of your infrastructure and service relationships—tracking dependencies, containers, and user flow for better root cause clarity.
- Davis AI Engine: Dynatrace’s AI continuously ingests billions of signals to automatically detect anomalies, correlate issues, and trace incidents to their root, minimizing noise and reducing time to resolution.
- Built-In Application Security: Embeds runtime application self-protection (RASP) directly into the platform, detecting vulnerabilities and suspicious behaviors without extra tooling.
- Integrated RUM and Synthetic Monitoring: Blends session analytics with simulated user journeys to trace frontend issues down to backend bottlenecks in real time.
Key Features
- All-in-One MELT Monitoring: Offers full support for metrics, events, logs, traces, synthetic tests, and real user monitoring—unified in a single dashboard with shared telemetry context.
- Zero-Touch Instrumentation: Dynatrace agents automatically detect services, APIs, hosts, containers, and cloud resources without manual setup, saving engineering hours.
- Real-Time Dependency Correlation: Tracks method-level interactions between frontend, backend, and infrastructure for deep performance insights and accelerated debugging.
- Multi-Cloud and Kubernetes Native: Integrates with AWS, GCP, Azure, and Kubernetes (including OpenShift) to provide detailed visibility across pods, services, and workloads.
- Embedded Security Telemetry: Monitors vulnerabilities and misconfigurations at runtime alongside performance data—merging security with observability into one stream.
- Built for Scale and Automation: Tailored for large-scale hybrid environments with automated deployment, policy enforcement, and update management across clusters.
Pros
- Best-in-class AI for incident detection and RCA automation
- Auto-discovers full stack without custom instrumentation
- Combines application security with performance monitoring
- Strong support for both legacy and cloud-native workloads
- Visual dependency graphs simplify system-wide troubleshooting
Cons
- Expensive
- Learning curve for teams new to Dynatrace’s ecosystem
Best for
Dynatrace is best for enterprise-scale organizations managing complex, distributed systems where performance, security, and automation are mission-critical. Its AI-assisted root cause detection, topology mapping, and auto-instrumentation make it ideal for large DevOps and ITOps teams that want deep observability without manually stitching together tools or signals.
Pricing & Customer Reviews
- Full-Stack Monitoring: $0.08 per 8 GiB host/hour
- Infra-Only Monitoring: $0.04 per host/hour
- Kubernetes Monitoring: $0.002 per pod/hour
- RUM: $0.00225 per session
- Synthetic Checks: $0.001 per HTTP test
- App Security: $0.018 per 8 GiB host/hour
- G2 Rating: 4.5/5 (based on 1,300+ reviews)
- Praised for: Exceptional AI automation, seamless agent-based discovery, strong hybrid support
- Criticized for: Unclear and expensive pricing model, closed ecosystem, steep onboarding
Dynatrace vs ScoutAPM
While ScoutAPM targets smaller teams with basic tracing and lightweight instrumentation, Dynatrace offers deep, AI-driven observability with security built in. Dynatrace delivers instant system-wide context, dynamic dependency mapping, and auto-remediation. That said, Dynatrace’s high pricing may not suit smaller teams.
5. Splunk AppDynamics
Known for
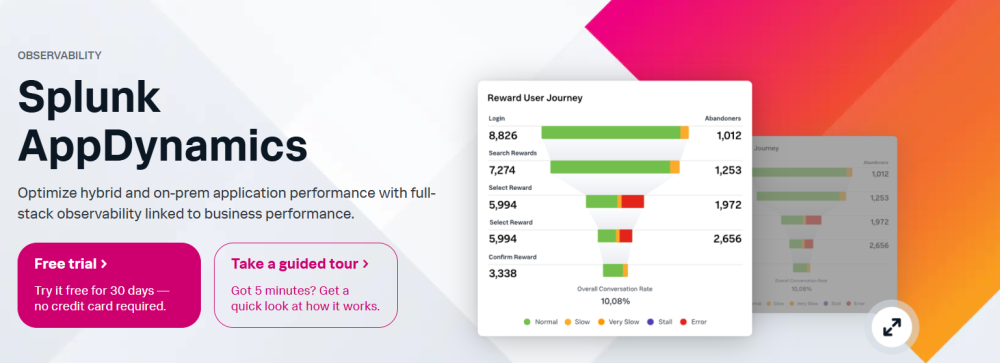
Splunk AppDynamics, a key component of Cisco’s observability stack, is purpose-built for full-stack application performance monitoring with an emphasis on transaction-level insights. It’s widely used by enterprises to monitor mission-critical systems by linking backend service performance with end-user experiences and business KPIs. AppDynamics excels at tracing individual transactions across complex, hybrid infrastructures, making it a strong fit for SLA-driven environments.
Standout Features
- Transaction-Centric Tracing: AppDynamics tracks user interactions across every backend tier, from APIs to database calls, enabling precise identification of bottlenecks that impact real business workflows.
- Live Application Flow Maps: Visualize system components, service calls, and APIs in real time, helping engineers understand dynamic interdependencies during incidents.
- Code Path Diagnostics: Provides deep insight into method-level execution for supported runtimes, helping developers locate the exact line or function causing regressions or latency.
- Performance Baselines & Anomaly Detection: Establishes behavioral baselines automatically and triggers contextual alerts when metrics deviate from expected norms.
Key Features
- Agent-Based APM Support: Offers robust instrumentation for Java, .NET, Node.js, Python, and PHP, allowing for in-depth code profiling and service tracing.
- Business Transaction Tagging: Allows users to define and monitor key application flows based on SLAs or user actions, aligning performance monitoring with business priorities.
- RUM and Synthetic Checks: Includes real user monitoring for frontend insights and synthetic monitoring to proactively test availability and latency across global endpoints.
- Hybrid Deployment Flexibility: Works across legacy servers, private data centers, and multi-cloud environments, catering to enterprises transitioning to cloud-native infrastructure.
- Secure App Integration: Leverages Cisco Secure App to detect runtime vulnerabilities within application environments, without additional overhead or tooling.
- CI/CD Visibility: Integrates with deployment pipelines to monitor release impact on system performance and automatically identify performance regressions post-deploy.
- Auto-Discovery of Components: Continuously detects new services, APIs, and nodes, ensuring dynamic environments are always mapped and monitored.
Pros
- Powerful end-to-end tracing for business-critical transactions
- Comprehensive hybrid infrastructure visibility
- Developer-friendly diagnostics down to method and class level
- Native integration with Cisco security tools for threat correlation
- Baseline-aware alerting reduces noise during dynamic load shifts
Cons
- Alert performance
- Slower updates cycle
Best for
Splunk AppDynamics is best suited for large enterprises managing complex, SLA-driven applications that span legacy and cloud-native environments. Its strengths lie in transaction tagging, method-level diagnostics, and on-prem/cloud hybrid observability.
Pricing & Customer Reviews
- Infrastructure Monitoring: $6 per vCPU/month
- APM (Premium): $33 per vCPU/month
- Enterprise Plan: $50 per vCPU/month (includes BI and SLA modules)
- RUM: Starts at $0.06 per 1,000 tokens/month
- Synthetics: Starts at $12/location/month
- G2 Rating: 4.3/5 (based on 375+ reviews)
- Praised for: In-depth transaction tracking, hybrid workload monitoring, and method-level drill-down
- Criticized for: Expensive at scale, alert issues
Splunk AppDynamics vs ScoutAPM
Compared to ScoutAPM’s lightweight tracing for developers, AppDynamics delivers much deeper visibility into enterprise-scale workloads and complex transactions, but at a high price.
6. Sentry
Known for
Sentry is a developer-first observability tool built to catch production errors, monitor performance bottlenecks, and tie issues directly to code owners. Widely adopted across frontend-heavy stacks, mobile apps, and full-stack JavaScript frameworks, it enables teams to debug faster with rich error context and Git-based triage automation. Its strength lies in correlating performance and release anomalies with version control activity.
Standout Features
- Error Grouping & Rich Context: Automatically clusters similar errors and enriches them with full stack traces, environment metadata, and source control info, streamlining root cause analysis.
- Cross-Stack Visibility: Supports both frontend and backend environments—tracing issues across JavaScript frameworks, Python APIs, and mobile runtimes in one unified interface.
- GitOps-Based Code Ownership: Integrates with repositories like GitHub and GitLab to auto-assign issues to relevant developers based on commit history and file changes.
- Custom Sampling for Performance Traces: Lets teams set latency thresholds, transaction budgets, and sample key routes or functions to focus on slow paths and regressions.
Key Features
- Exception Monitoring & Stack Traces: Captures exceptions with full tracebacks, breadcrumbs, and contextual variables—offering deep insight into runtime conditions.
- Transaction-Level Tracing: Follows performance across APIs, UI events, and service boundaries to help identify slow spans and unoptimized routes.
- Session Replay (Paid Feature): Records user sessions, click paths, and screen states before a crash or error—helpful for debugging frontend behavior.
- Release Tracking: Links errors and performance drops to specific deploys and commits, enabling teams to catch regressions early post-release.
- Alerting & Workflow Hooks: Supports Slack, Jira, GitHub, PagerDuty, and webhooks for error alerts, assignment automation, and triage routing.
- Broad SDK Coverage: Includes lightweight client libraries for JavaScript, Python, Java, PHP, Go, Flutter, iOS, React Native, and more.
Pros
- Excellent context for debugging across the frontend and backend
- Auto-assigns issues using Git-based code ownership
- Merges release, performance, and error data in one timeline
- Easy to set up with minimal instrumentation required
- Purpose-built UI for developers and release teams
Cons
- Error reporting delays
- Can be costly for smaller teams
Best for
Sentry is best for application engineers, product developers, and platform teams focused on frontend/backend reliability, release validation, and debugging speed. It’s a great fit for orgs that want to reduce MTTR without dealing with complex infrastructure monitoring or setting up full-stack observability pipelines.
Pricing & Customer Reviews
- Free Tier: Up to 5,000 events/month
- Team Plan: Starts at $26/month
- Business Plan: Starts at ~$80/month (usage-based); replay and performance billed separately
- G2 Rating: 4.5/5 (100+ reviews)
- Praised for: Debugging efficiency, Git integration, real-time error triage
- Criticized for: error reporting issues
Sentry vs ScoutAPM
While Scout APM focuses on lightweight backend tracing, Sentry is optimized for error monitoring and full-stack debugging tied to Git workflows. Sentry offers broader frontend and mobile coverage, session replays, and release diagnostics.
7. Sumo Logic

Known for
Sumo Logic is a SaaS-native observability and security analytics platform designed to handle high-volume telemetry at enterprise scale. Originally built for log analytics, it has since expanded to support full-stack monitoring with built-in SIEM capabilities. Popular among DevSecOps teams, it allows organizations to unify performance monitoring, threat detection, and compliance workflows in a single interface, without managing backend infrastructure.
Standout Features
- Cloud-Native Multi-Tenant Architecture: The platform’s fully managed, multi-tenant design ensures effortless scalability for teams ingesting terabytes of data daily—ideal for large, distributed systems.
- Integrated Security Analytics: Offers threat detection, audit logs, and compliance dashboards out of the box—bridging the gap between observability and SIEM.
- LogReduce™ & PowerQuery: Uses proprietary tools to compress log noise into readable summaries and power deep analytics through a purpose-built query language.
- Prebuilt Apps & Dashboards: Includes hundreds of integrations and turnkey dashboards for AWS, Kubernetes, NGINX, and more, enabling quick setup and rapid insights.
Key Features
- MELT Observability Coverage: Supports metrics, logs, traces, events, synthetic checks, and real user monitoring (RUM) across full-stack environments.
- Multi-Cloud Telemetry Ingestion: Collects data natively from AWS CloudWatch, Azure Monitor, GCP, and Kubernetes environments for centralized cloud visibility.
- Security & Compliance Modules: Features built-in support for HIPAA, PCI, SOC 2, and ISO 27001 standards, making it suitable for regulated industries.
- Anomaly Detection & Alerting: Uses machine learning to detect outliers in logs and metrics, helping teams catch performance degradations and unusual activity early.
- Flexible Ingestion Options: Ingests from OpenTelemetry exporters, Fluentd, AWS FireLens, and native agents—although deep correlation across signals remains limited.
Pros
- Combines observability and SIEM in a single cloud-native tool
- Scales well for large-scale log and event ingestion in multi-cloud setups
- Advanced analytics via LogReduce™ and PowerQuery accelerates investigations
- Rich integration ecosystem and prebuilt templates reduce onboarding time
- Ideal for DevSecOps teams looking for compliance and monitoring in one UI
Cons
- No self-hosting
- UI issues
- Learning curve
Best for
Sumo Logic is best for enterprises prioritizing log analytics, SIEM functionality, and out-of-the-box observability in a SaaS-managed model. It’s ideal for DevSecOps teams needing centralized telemetry, security monitoring, and compliance reporting—especially across multi-cloud environments.
Pricing & Customer Reviews
- Log Ingestion: Starts at $3.14/TB of data scanned
- Advanced observability features (RUM, metrics, tracing): Available as paid add-ons
- G2 Rating: 4.3/5 (600+ reviews)
- Praised for: Strong scalability, SIEM integration, and prebuilt dashboard coverage
- Criticized for: UI performance issues, can be difficult to learn
Sumo Logic vs ScoutAPM
Sumo Logic offers a more holistic observability and security platform compared to ScoutAPM, which focuses mainly on application tracing. While Scout is better suited for simple backend debugging, Sumo Logic excels in high-scale, log-heavy environments that require compliance dashboards and security insights. However, its tracing capabilities and OTEL support lag behind modern standards, making it less appealing for teams needing deep service-level observability.
Conclusion: Choosing the Right ScoutAPM Alternative
While Scout is excellent for small teams and backend performance debugging, it lacks certain functionalities, such as synthetic testing and RUM. It charges extra for add-ons for log management and error tracking beyond 1 GB and 5,000 errors, respectively. In addition, it lacks an on-premise or self-hosting option, which may not be suitable for orgnizations with strict data compliance requirements.
CubeAPM stands out as the best ScoutAPM alternative with a full-stack observability platform, including RUM and synthetics. It’s simple $0.15/GB pricing is uniform for logs, traces, metrics and events, with nothing charged extra. It’s smart sampling filters low-value data to further reduce costs. It also offers a self-hosting option on your on-premise systems or cloud infrastructure to help you meet data sovereignty needs.
Ready to make the switch? Book a free demo with CubeAPM.
Disclaimer: The information in this article reflects the latest details available at the time of publication and may change as technologies and products evolve.
FAQs
1. What are the best alternatives to ScoutAPM for full-stack observability?
While ScoutAPM is excellent for lightweight application performance monitoring, it lacks RUM and synthetics support. Top alternatives offering comprehensive observability include CubeAPM, Datadog, New Relic, and Dynatrace, all of which support RUM, infrastructure metrics, synthetics, and advanced alerting under one platform.
2. Why are engineering teams moving away from ScoutAPM?
Teams often outgrow ScoutAPM due to its limited feature set, including real user monitoring and synthetics, short retention periods, and fixed transaction quotas.
3. How does CubeAPM compare to ScoutAPM in terms of pricing and features?
CubeAPM offers a simple pricing model at $0.15/GB, with no per-user or per-host charges—unlike Scout’s tiered pricing and add-on costs. It also provides full MELT observability, smart sampling, real user and synthetic monitoring, and Slack-first support, making it more scalable and cost-efficient for growing teams.
4. Which ScoutAPM alternative supports self-hosting or on-prem deployment?
CubeAPM stands out with flexible deployment options, including on-premise or bring-your-own-cloud (BYOC) setups—ideal for teams with data residency, compliance, or low-latency needs.
5. Is there an OpenTelemetry-native replacement for ScoutAPM?
Yes, CubeAPM is fully OpenTelemetry-native, allowing seamless integration with OTEL SDKs and collectors. This gives teams vendor-agnostic instrumentation and better control over telemetry pipelines.


