Coralogix, known for its Streama™-based data pipeline, offers strong ingestion control and native OpenTelemetry support, making it appealing for teams that need flexible routing at scale. However, with Coralogix, the cost can get high, especially when scaling, and a steep learning curve for beginners complicates the initial use.
CubeAPM is the best alternative to Coralogix. It offers built-in support for APM, logs, infra, RUM, synthetics, and error tracking. With smart sampling, no per-user fees, and pricing as low as $0.15/GB, CubeAPM delivers up to 50% cost savings over platforms like Coralogix.
In this article, we’ll break down the top Coralogix alternatives in 2025 across categories like feature depth, deployment flexibility, pricing transparency, OTEL compatibility, and support experience, starting with CubeAPM.
Top 7 Coralogix Alternatives
- CubeAPM
- Grafana
- Datadog
- Dynatrace
- Splunk AppDynamics
- Sentry
- New Relic
APM Tools Comparison: Coralogix vs CubeAPM vs Others (2025)
| Tool | *Pricing(Small, Medium, Large) | OTEL Native | Support TAT | Deployment Option |
| CubeAPM | Small: $2,080; Mid: $7,200 Large: $15,200 | Yes | Within minutes | Self-hosted |
| New Relic | Small: $9,366; Mid: $32,115; Large: $70,220 | No | 2hrs to days | SaaS only |
| Datadog | Small: $8,185; Mid: $27,475 Large: $59,050 | No | <2hrs-48hrs | SaaS only |
| Dynatrace | Small: $7,740; Mid: $21,850; Large: $46,000 | No | 4hrs to days | SaaS and Self-hosted |
| Splunk Appdynamics | Small: $2,650; Mid: $9,825; Large: $20,150 | No | 2hrs to days | SaaS and Self-hosted |
| Grafana | Small: $3,870; Mid: $11,875 Large: $26,750 | Yes | 2hrs to 6hrs | SaaS and Self-hosted |
| Coralogix | Small: $4,090 Mid: $13,200 Large: $29,000 | Yes | within minutes | SaaS only |
| Sentry | Small: $3,560; Mid: $12,100 Large: $32,400 | No | hrs to days | SaaS and Self-hosted |
*All pricing comparisons are calculated using standardized Small/Medium/Large team profiles defined in our internal benchmarking sheet, based on fixed log, metrics, trace, and retention assumptions. Actual pricing may vary by usage, region, and plan structure. Please confirm current pricing with each vendor.
*OTEL Sources: Datadog uses proprietary SDKs; Dynatrace uses collectors; Splunk AppDynamics uses collectors
Why Look for Coralogix Alternatives?
Although Coralogix delivers strong flexibility for log management, its growing adoption has also surfaced several critical drawbacks that engineering and platform teams increasingly report:
1. Steep Learning Curve
Coralogix’s flexibility comes with a learning curve. Building efficient observability pipelines via Streama, configuring storage tiers, and managing indexing policies requires advanced expertise, which slows down onboarding and incident triage.
“The UI takes some time to get used to, and advance alert rules require a bit of learning curve.”(G2)
“The learning curve can be a bit steep initially, especially for users unfamiliar with structured queries or logging concepts.”(G2)
2. TCO Optimizer helps — but cloud egress costs still remain
Coralogix reduces storage spend by routing only high-priority data for real-time indexing and sending lower-priority logs/traces to S3-compatible archives through its TCO Optimizer. This lowers long-term retention costs, but teams still pay cloud data-out (egress) fees because telemetry must first leave their AWS/GCP/Azure environment and be sent to Coralogix’s cloud endpoint.
As workloads scale, these unavoidable egress charges become a significant part of the total cost, especially for log-heavy or latency-sensitive applications.
Criteria for Suggesting Coralogix Alternatives
When shortlisting the best Coralogix alternatives, we assessed tools across a blend of technical, financial, and operational criteria tailored to the evolving needs of modern DevOps and SRE teams:
1. OpenTelemetry-Native Ingestion
We prioritized platforms with OpenTelemetry (OTEL)-first architectures for seamless data portability and standardized instrumentation, critical for modern DevOps/SRE teams. Tools like CubeAPM, Grafana, and SigNoz natively integrate OTEL, ensuring effortless ingestion of traces, metrics, and logs without proprietary format dependencies. OTEL-native platforms streamline integration, reduce vendor lock-in, and future-proof observability pipelines for dynamic, cloud-native environments.
2. Unified MELT Stack
A robust MELT (Metrics, Events, Logs, Traces) stack is essential for holistic observability. We favored tools with native MELT support, along with extras such as Real User Monitoring (RUM), synthetics, and error tracking. CubeAPM excels by bundling these natively, ensuring seamless correlation across data types.
3. Cost Efficiency
Most observability tools often hide complexity in modular pricing, retention tiers, or ingestion quotas. CubeAPM keeps it simple with a single rate for all features and unlimited user access. With this pricing mode, CubeAPM is more affordable compared to Coralogix.
Coralogix Pricing for a Mid-Sized Team
*Disclaimer: Pricing comparisons are based on standardized Small/Medium/Large team profiles defined in our internal benchmarking sheet. Actual costs may vary by usage, region, and plan. Please verify current pricing with each vendor.
Monthly data ingestion by Traces (GB): $4,000 (25000 x 0.16)
Monthly data ingestion by Log hosts (GB): $4,200 (10,000 x 0.42)
Monthly data ingestion by Infra hosts (GB): $500 (10,000 x 0.05)
Observability data out cost (charged by cloud provider): $4,500 (0.1 x 45,000)
Total: $13,200/month
Coralogix pricing for a Small-Sized Team
Monthly data ingestion by Traces (GB): $960 (6,000 x 0.16)
Monthly data ingestion by Log hosts (GB): $1,680 (4,000 x 0.42)
Monthly data ingestion by Infra hosts (GB): $150 (3,000 x 0.05)
Observability data out cost (charged by cloud provider): $1,300 (0.1 x 13,000)
Total: $4,090
CubeAPM Cost for a Mid-Sized Team
Total Monthly data ingestion (GB): $6,757 (45,000 x 0.15)
Observability data out cost (charged by cloud provider): $450 (45,000 x $0.01)
Total: $7,200
CubeAPM Cost for a Mid-Sized Team
Total Monthly data ingestion (GB): $1,950(13,000 x 0.15)
Observability data out cost (charged by cloud provider): $450 (13,000 x $0.01)
Total: $2,080
4. Ease of Setup & Migration
Tools must offer quick onboarding, agent compatibility with existing setups (Datadog, New Relic, Elastic), and prebuilt dashboards. CubeAPM’s 1-hour setup and agent compatibility make it migration-friendly.
Coralogix Overview
Known For
An observability platform built for teams that require full MELT coverage, flexible routing, and cost optimization via stream-based indexing and storage decoupling. Coralogix is widely adopted in environments with heavy log volume, compliance needs, or CI/CD monitoring requirements.
Standout Features
- Streama™ Architecture: Decouples log ingestion from indexing, allowing high-throughput processing with customizable retention and routing rules. Reduces indexing costs by letting users choose which logs to index vs. store.
- Customer-Controlled Archival: Archived telemetry data is pushed to the customer’s cloud (S3/GCS) for long-term retention, eliminating Coralogix storage charges for cold data.
- CI/CD & Security Integrations: Coralogix integrates with GitHub, Jenkins, CircleCI, and SIEM tools, enabling use cases beyond observability, like auditing, release monitoring, and security visibility.
Key Features
- Log Ingestion & Parsing: Real-time structured and unstructured log ingestion with custom parsing, enrichment, and alerting rules.
- Metrics & Tracing Support: Supports OpenTelemetry and Prometheus for ingesting metrics and distributed traces, though less mature than its logging capabilities.
- Anomaly Detection & ML Alerts: Detects statistical outliers and pattern anomalies across telemetry streams, with support for alert triggers based on time windows, thresholds, or behavior baselines.
- Data Routing & Index Control: Fine-grained control over what gets indexed, retained, or discarded, allowing users to reduce ingestion costs.
- GitOps + CI/CD Friendly: The infrastructure-as-code model enables teams to manage dashboards and pipelines as code for repeatability and version control.
Pros
- Advanced log routing and control over indexing/storage
- OTEL and Prometheus support for trace/metrics ingestion
- Strong CI/CD, security, and audit use cases
- Pay-as-you-go usage tiers and customizable plans
- Lower long-term storage costs due to customer-controlled archives
Cons
- Steep learning curve
- Overwhelming UI that makes navigation a challenge
Best For
Engineering teams and DevOps orgs in log-intensive environments who prioritize cost control, indexing flexibility, and log pipeline customization. Especially useful for teams running CI/CD workflows, security monitoring, or needing audit trails via structured log routing.
Pricing & Customer Reviews
- Logs: $0.42/GB
- Traces: $0.16/GB
- Metrics: $0.05/GB
- AI: $1.5 per 1M tokens
- G2 Rating: 4.6 / 5
Users praise Coralogix’s cost-saving architecture and alerting capabilities, but often note that it has a steep learning curve and introduces costs when scaling.
Top 7 Coralogix Alternatives
1. CubeAPM Overview

Known For
CubeAPM is a modern, high-efficiency observability platform built to support full-stack monitoring in cloud-native, Kubernetes-based, and privacy-conscious environments. It is natively OpenTelemetry-compatible and optimized for teams looking to cut observability costs, enforce data residency, and avoid vendor lock-in without compromising on MELT capabilities.
Supports Out-of-the-box monitoring of all AWS Components: It supports monitoring of all popular infrastructure components, including K8s, Redis, Kafka, MySQL, MS SQL, and many more. It also provides automated support of all the AWS components, including EC2, EBS, RDS, DynamoDB, and Lambda. This remarkable capability sets it apart from other code review bots.
Key Features
- Full MELT Stack Coverage: CubeAPM offers native support for Metrics, Events, Logs, and Traces—all deeply integrated with APM, Real User Monitoring (RUM), error tracking, infrastructure visibility, and synthetic monitoring.
- Smart Sampling Engine: CubeAPM implements contextual trace sampling, intelligently retaining traces based on error rates, latency, and service importance. This ensures high-signal traces are preserved while low-value telemetry is discarded.
- OTEL-Native & Agent-Compatible: Built from the ground up for OpenTelemetry, CubeAPM supports direct ingestion from OTEL agents and is backward-compatible with New Relic, Datadog, and Prometheus agents. This enables a fast migration (under 1 hour) for teams switching from legacy vendors.
- Self-Hosted & Compliance Ready: CubeAPM supports deployment in private cloud, on-premise, essential for compliance. Coralogix, by comparison, sends data through its pipeline before archiving it in your cloud, posing compliance risks.
- Real-Time Support Experience: CubeAPM offers Slack and WhatsApp-based live support, giving teams direct access to engineers for fast issue resolution. Compared to email/ticket-based support in tools like Coralogix, this makes CubeAPM developer-first in its operations model.
Standout Features
- Built-in support for APM, Logs, Infra, RUM, Synthetics, and Errors
- Smart trace sampling for cost savings
- No per-user or host-based pricing
- Fully self-hostable with complete data control
- Agent-agnostic ingestion for easier adoption
Pros
- Highly cost-effective
- Rapid deployment and agent migration
- Transparent and predictable pricing
- A unified observability stack reduces tool sprawl.
- Exceptional customer support turnaround
Cons
- Not suited for teams looking for off-prem solutions.
- Strictly an observability platform and doesn’t support cloud security management.
Best For
Engineering teams, SREs, and platform owners at mid-sized SaaS, fintech, e-commerce, and regulated enterprises who want complete observability, data sovereignty, and usage-based pricing without the rigidity of legacy APM tools.
Pricing & Customer Reviews
- Pricing: $0.15/GB for ingestion, with unlimited users and no additional charges for features or retention
- Support: Slack/WhatsApp access with live response within minutes
- Retention: Unlimited by default
- G2 Rating: 4.7 / 5
Customers highlight CubeAPM’s developer-first UX, transparent pricing, and faster-than-average support as key differentiators.
CubeAPM vs Coralogix
While Coralogix excels at full-stack observability, log routing, and stream-based ingestion, it has a steep learning curve, and users still incur the data-out cost (charged by your cloud provider like AWS) because you first send your telemetry data out from your cloud to the Coralogix cloud. In contrast, CubeAPM offers a full MELT stack out of the box, smart sampling for ingestion efficiency, and a self-hosted option without the additional cloud costs.
2. Grafana

Known For
Grafana is an open-source visualization platform known for its best-in-class dashboarding and extensibility. It serves as a central UI layer across observability stacks by connecting to multiple backends such as Prometheus, Loki, Tempo, InfluxDB, and more. While Grafana Cloud provides a hosted version with managed storage and alerting, Grafana OSS remains the go-to solution for teams building custom, vendor-agnostic observability stacks.
Key Features
- Flexible Dashboarding & Visualization: Grafana allows teams to build fully customizable dashboards using time-series and structured data from multiple sources. Its templating, transformation, and alerting logic provide unmatched control over data presentation.
- Prometheus, Loki & Tempo Integration: Grafana supports deep integration with Prometheus (metrics), Loki (logs), and Tempo (traces)—allowing users to construct a complete observability stack, though requiring manual setup for correlation and MELT.
- Grafana Cloud & OSS Options: Grafana offers two primary deployment modes: a free, self-hosted OSS version, and Grafana Cloud, which bundles managed services like hosted metrics, logs, traces, and RUM (via Faro).
- Plugin Ecosystem: Grafana supports hundreds of plugins for data sources, panels, and apps, allowing integration with services like AWS, GCP, Azure, Elasticsearch, and more.
Standout Features
- Best-in-class visualization and dashboarding flexibility
- Native OTEL support through Tempo, Prometheus, and Loki
- Fully open-source and self-hostable
- Massive plugin ecosystem
- Works with almost any telemetry backend
Pros
- Completely free to use via OSS version
- Strong community support and documentation
- Highly extensible via plugins and APIs
- Clear separation of UI and backend, ideal for modular observability
Cons
- Steep learning curve and
- Users face a complex setup with Grafana
- Overwhelming UI for new users
Best For
Engineering teams that want to build their observability pipeline using open-source tools, or companies needing custom dashboards over third-party telemetry backends like Prometheus or Elasticsearch.
Pricing & Customer Reviews
- Grafana OSS: Free
- Pro: $19/month + usage
- Metrics: $6.50/ 1k series for pro plan and $3/ 1k series for enterprise plan
- Logs: $0.50/ GB ingested
- G2 Rating: 4.5 / 5
Users praise Grafana for its visualization power and community plugins, though they often note the complexity in backend management and cost scaling in the Cloud version.
Grafana vs Coralogix
Grafana and Coralogix target different layers of the observability stack—Grafana is a visualization/UI layer, while Coralogix is a full-stack observability with core strength in query archival and streama architecture. However, Grafana can become a powerful alternative when paired with open-source tools like Prometheus + Tempo + Loki to replicate full-stack observability.
3. Datadog
Known For
Datadog is a comprehensive cloud-native observability platform used widely for infrastructure monitoring, application performance monitoring (APM), log management, and security analytics. Known for its 900+ integrations, it is popular in large-scale environments running Kubernetes, microservices, and hybrid cloud architectures. While powerful, Datadog is also frequently critiqued for its complex pricing and surprise overages.
Key Features
- Unified Observability Platform: Datadog offers a full MELT stack: metrics, logs, traces, RUM, synthetics, and events, all accessible in a single interface. This allows developers, SREs, and security teams to correlate issues across the stack in real-time.
- 900+ Integrations: Supports out-of-the-box integrations with AWS, Azure, GCP, Kubernetes, PostgreSQL, Redis, Kafka, Docker, and nearly every major tool in the DevOps ecosystem.
- Distributed Tracing & APM: Provides code-level visibility across services with support for tracing, span-level tagging, and performance profiling. However, it uses basic head-based sampling, which may drop valuable traces under load.
- Watchdog AI for Anomaly Detection: Datadog includes Watchdog, its ML-based system that auto-detects anomalies, performance regressions, and outliers in system behavior.
- Dashboards & Custom Visualizations: Highly customizable dashboards allow drag-and-drop metrics and alerting across logs, infrastructure, and applications.
Standout Features
- Broadest integration library in the industry
- One unified UI for MELT, security, and monitoring
- Watchdog AI helps detect issues without manual rules.
- Strong Kubernetes-native observability
- Built-in role-based access control (RBAC)
Pros
- End-to-end visibility from frontend to infra
- Powerful dashboarding and analytics tools
- Extensive documentation and community content
- Scales well for enterprise and high-throughput use cases
Cons
- Complex pricing with per-feature, per-host, and per-GB tiers
- Steep learning curve, especially for new users
- High cost when scaling operations
Best For
Large-scale teams operating in Kubernetes, multi-cloud, or enterprise IT environments that need integrated monitoring across applications, infrastructure, and security, but can manage complex billing and vendor lock-in.
Pricing & Customer Reviews
- APM Pro: starts at $35/host/month
- Infrastructure: starts at $15/host/month
- G2 Rating: 4.4 / 5
Users appreciate the depth of visibility and integrations, but frequently cite pricing unpredictability and sampling limitations.
Datadog vs Coralogix
While Coralogix boasts a fluid streama architecture and archiving that reduces observability costs, it lacks Datadog’s rich integration ecosystem. Datadog provides complete full-stack observability with strong infrastructure and security support. However, Datadog’s opaque pricing model makes it difficult for cost-conscious teams. Teams must weigh depth vs predictability when choosing between the two.
4. Dynatrace
Known For
Dynatrace is an enterprise-grade observability platform known for its AI-powered root cause analysis, automated instrumentation, and real-time dependency mapping. Its proprietary OneAgent and Davis AI engine enable deep, automatic monitoring across complex, large-scale environments, especially in Kubernetes, VM-heavy, or hybrid cloud ecosystems.
Key Features
- OneAgent Auto-Instrumentation: Dynatrace uses a single, auto-deploying agent (OneAgent) that automatically discovers services, dependencies, containers, and processes—eliminating the need for manual configuration or multiple agents.
- Davis AI & Smartscape Topology: Dynatrace’s Davis AI engine continuously correlates metrics, traces, logs, and events to deliver real-time root cause analysis. Smartscape builds an auto-updating service topology map, showing the flow and health of dependencies.
- Full MELT Observability: Includes native support for Metrics, Events, Logs, Traces, as well as infrastructure monitoring, APM, RUM, and synthetic testing—completing the MELT stack in a tightly integrated environment.
- Kubernetes & Cloud-Native Visibility: Optimized for Kubernetes, Dynatrace captures container-level metrics, pod health, cluster insights, and service interconnectivity without extra instrumentation.
- SLO Dashboards & Anomaly Alerts: Provides built-in dashboards for Service Level Objectives (SLOs), along with predictive anomaly alerts and problem impact scoring for incident prioritization.
Standout Features
- Fully automated discovery with no manual instrumentation
- Davis AI engine enables true root cause detection.
- Dynamic Smartscape topology mapping
- Integrated SLO dashboards and service impact scoring
- Deep Kubernetes observability out-of-the-box
Pros
- Highly automated monitoring reduces manual setup.
- Powerful AI for detecting performance anomalies
- End-to-end MELT stack in one platform
- Strong cloud-native and hybrid support
- Enterprise-grade support and scalability
Cons
- Users struggle with the steep learning curve
- Users find Dynatrace expensive, discouraging teams on a tight budget
- Users find the complex configuration challenging
- Overwhelming UI especially due to frequent UI changes
Best For
Enterprises and platform teams managing high-scale microservice or hybrid infrastructures, who need automated discovery, AI-assisted observability, and tight SLO management, and have budget flexibility for a premium tool.
Pricing & Customer Reviews
- Full-Stack Monitoring: $58 /month/8 GiB host
- Infra Monitoring: $29/month/8 GiB host
- G2 Rating: 4.5/5
Customers value Dynatrace’s automation and AI accuracy but report pricing complexity and a lack of transparency around usage tiers.
Dynatrace vs Coralogix
Dynatrace delivers automated full-stack observability with topology mapping and root-cause analysis. Coralogix also offers full MELT coverage but emphasizes real-time stream processing and flexible data routing to optimize cost. Teams seeking deep automation lean toward Dynatrace; those prioritizing routing control and cost efficiency often prefer Coralogix.
5. Splunk AppDynamics
Known For
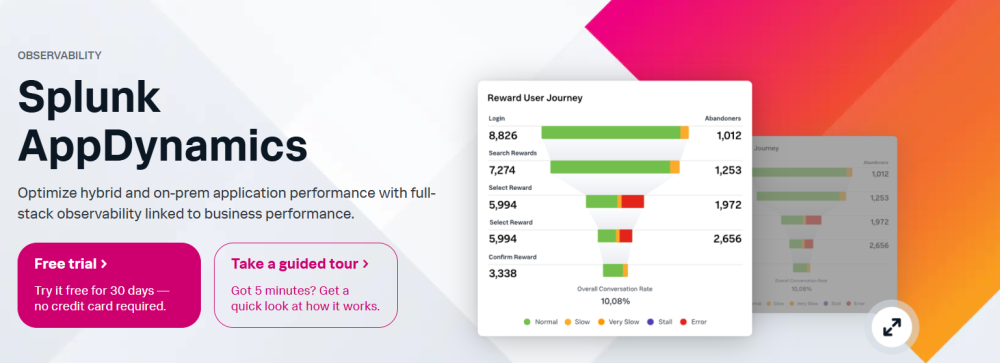
Splunk AppDynamics, now part of Cisco, is a traditional APM platform focused on transaction-level monitoring, code diagnostics, and business impact analysis. It’s widely used in large enterprises with monolithic or hybrid architectures where deep visibility into legacy stacks, database performance, and business KPIs is critical.
Key Features
- Business Transaction Monitoring: Splunk AppDynamics maps service flows into business transactions, helping teams trace user journeys and application performance back to revenue-impacting endpoints. This makes it useful for large applications with many interdependent layers.
- Code-Level Diagnostics: Offers deep code visibility with call graphs, SQL analysis, and method-level performance tracking for Java, .NET, PHP, and more—helping pinpoint bottlenecks in backend code and DB queries.
- Infrastructure & Database Visibility: Monitors infrastructure components and databases alongside applications, with insights into CPU, memory, thread states, and I/O wait times, offering full-stack diagnostics from frontend to DB layer.
- Real User Monitoring (RUM) & Synthetic Testing: Supports browser-based RUM and synthetic transactions to track user behavior and simulate performance in different regions or device types.
- Cisco Integration: Integrates with Cisco SecureX and network monitoring tools, offering an observability-plus-security lens for teams operating in hybrid IT or enterprise networks.
Standout Features
- Business-first transaction tracking
- Deep backend diagnostics at code and DB levels
- Integration with Cisco’s security and infrastructure stack
- On-prem deployment support for high-security environments
- Tailored for enterprise-scale legacy or hybrid applications
Pros
- Mature platform trusted by Fortune 500 companies
- Robust APM and root cause correlation
- Comprehensive infrastructure and database insights
- Powerful SLA/SLO-based reporting and dashboards
- Available as self-hosted or SaaS
Cons
- High Cost for Large Deployments
- Complex Licensing & Pricing Structure
- Alerting & Notification Shortcomings — A portion of reviewers find the alerting system inefficient
Best For
Large enterprises with legacy systems, monolithic architectures, or strict security environments, where business transaction mapping and full-stack correlation are more critical than OTEL-native or modular flexibility.
Pricing & Customer Reviews
- APM: starting at $33/month/CPU core
- Infrastructure Monitoring: $6/month/CPU core
- G2 Rating: 4.3 / 5
Users appreciate Splunk AppDynamics’ deep backend diagnostics, but note its complex setup, and cost inflexibility compared to newer platforms.
Splunk AppDynamics vs Coralogix
Splunk AppDynamics excels in code-level diagnostics, transaction mapping, and enterprise-grade APM across legacy systems. Splunk AppDynamics lacks Onative penTelemetry, while Coralogix offers OTEL-native and full-stack monitoring. If you’re managing large-scale monoliths with strict SLA enforcement, Splunk AppDynamics is stronger. For cloud-native, OTEL-driven teams seeking flexible observability, Coralogix is more agile.
6. Sentry
Known For
Sentry is a developer-focused platform built for real-time error monitoring, exception tracking, and lightweight performance profiling across frontend and backend applications. Its tight integration with source code, Git workflows, and alerting tools makes it especially popular among product engineering teams and JavaScript-heavy applications.
Key Features
- Real-Time Error Monitoring: Sentry tracks unhandled exceptions and performance issues across web, mobile, and backend services. It provides rich context like stack traces, breadcrumbs, release version, and user impact, making it easy to debug quickly.
- Performance Monitoring: Includes basic distributed tracing and route-level performance tracking. Helps teams detect slow transactions, API bottlenecks, and N+1 query patterns—primarily for web and frontend-centric apps.
- Wide SDK Coverage: Sentry supports a wide array of SDKs: JavaScript, React, Node.js, Python, Go, PHP, iOS, Android, and more. It’s designed for quick integration with full-stack applications.
- Issue Grouping & GitHub Integration: Automatically groups errors by cause and integrates with GitHub, Jira, Slack, Microsoft Teams, and more—allowing devs to triage, fix, and track errors without context switching.
- Self-Hosted Option: Sentry offers a Docker-based OSS version, which teams can self-host for privacy or compliance reasons—rare among SaaS-first observability tools.
Standout Features
- Developer-first UI with full stack trace context
- Strong support for frontend frameworks and mobile SDKs
- Git-based source mapping and release tracking
- Easy setup and high usability for dev teams
- OSS self-hosting is available for private environments
Pros
- Great for debugging and fast error resolution
- Lightweight and fast to set up
- Excellent integration with engineering workflows
- Self-hosted option offers flexibility.
- Strong mobile and browser SDK support
Cons
- Complex configuration in larger setups
- Delayed error reporting
- Pricing limitations for heavy use — The free and lower-tier plans have error quota
Best For
Frontend and full-stack product teams that prioritize fast debugging, error resolution, and release monitoring. Ideal for applications with high frontend visibility and CI/CD workflows but not infrastructure-heavy workloads.
Pricing & Customer Reviews
- Free tier available for small teams
- Teams: $26/month
- Business: $80/month
- Self-hosting supported via Docker
- G2 Rating: 4.5 / 5
Users love Sentry’s developer UX, fast setup, and debugging depth, but often mention its limited backend observability and lack of broader MELT coverage.
Sentry vs Coralogix
Sentry’s core strength is in error tracking and deep code-level monitoring, while Coralogix is centred on offering full MELT, log routing, and backend telemetry ingestion. Teams wanting full-stack observability with infrastructure, logs, and metrics will outgrow Sentry faster than Coralogix.
7. New Relic

Known For
New Relic is a veteran in the observability space, best known for its full-stack APM capabilities, custom dashboards, and wide visibility into application and infrastructure performance. It’s used by DevOps and SRE teams to monitor distributed applications and microservices across frontend, backend, and infrastructure layers, though concerns around pricing, agent lock-in, and flexibility have led many teams to seek alternatives.
Key Features
- Full-Stack Observability: New Relic offers an integrated UI for APM, RUM, Logs, Infrastructure, Errors, and Synthetic Monitoring, with custom dashboards powered by NRQL (New Relic Query Language).
- Distributed Tracing: Supports trace-based diagnostics and includes trace maps, span-level insights, and an Errors Inbox for correlating exceptions with specific services. However, it uses head-based sampling (~10 traces/min), which can miss slow/error traces under traffic.
- Real User & Synthetic Monitoring: Enables browser session monitoring (RUM) and synthetic tests across geographies to detect frontend latency, downtime, or regressions.
- Custom Dashboards with NRQL: Teams can query telemetry using NRQL and build tailored dashboards for KPIs, SLOs, and alerting.
- Pre-Built Cloud Integrations: Includes integrations for AWS, Azure, GCP, Kubernetes, and more—but many advanced features are only available in higher-priced tiers.
Standout Features
- Robust NRQL dashboarding and visualization engine
- Consolidated telemetry from infra to user-level
- Wide cloud provider and service integration catalog
- Synthetic and browser monitoring out of the box
- Mature enterprise support infrastructure
Pros
- Unified observability across the MELT stack
- Well-established ecosystem and documentation
- Built-in alerts and SLO dashboards
- Strong synthetic monitoring and browser RUM
- Prebuilt visualizations and integrations for a quick start
Cons
- Expensive/unpredictable pricing
- Steep learning curve & complex setup
- Overwhelming UI, too many features for smaller teams
- Cost growth as data volume or scale increases
Best For
Large DevOps or platform teams needing complete full-stack visibility and dashboard flexibility in cloud-first environments, and that can absorb higher per-user and data ingestion costs.
Pricing & Customer Reviews
- Free: 100GB/month ingested
- Data ingested: $0.40/GB beyond the free 100 GB
- Full Platform User: $418.80/user(for monthly pay as you go)
- G2 Rating: 4.3 / 5
Users praise New Relic’s visualization and full-stack coverage but consistently criticize the complex pricing, lack of deployment flexibility, and agent lock-in.
New Relic vs Coralogix
New Relic offers more mature APM capabilities with stronger automatic instrumentation and dashboards, while Coralogix excels at real-time stream processing and cost-efficient data routing across MELT signals. New Relic gives deeper out-of-the-box application insights, whereas Coralogix provides better control over ingestion and long-term storage costs. Teams wanting polished APM workflows may prefer New Relic; those prioritizing routing flexibility and predictable pricing often choose Coralogix.
Conclusion: Choosing the Right Coralogix Alternative
While Coralogix offers powerful log control and cost-saving mechanisms like Streama™, the egress costs and steep learning curve incentivise users to seek alternatives.
CubeAPM emerges as the most balanced Coralogix alternative—offering full MELT coverage, smart trace sampling, OTEL-native compatibility, and flat, usage-based pricing at $0.15/GB. With real-time support and flexible deployment models, CubeAPM empowers engineering teams to scale observability confidently.
*At the time of writing, all pricing details, feature limitations, and user-reported issues reflect the most up-to-date information available from public sources and vendor documentation. Observability platforms evolve quickly, so features, performance, and pricing may change over time. We recommend verifying the latest details directly with each vendor before making a final decision.
FAQs
1. What are the top alternatives to Coralogix?
Some of the most widely considered alternatives include CubeAPM, Datadog, New Relic, Dynatrace, Grafana, and Logz.io.
2. How do Coralogix alternatives compare in pricing?
Coralogix charges based on data volume, with stream-based control and cloud-archived storage. CubeAPM offers flat, usage-based pricing at $0.15/GB, with no user-based charges or modular feature pricing
3. Do Coralogix alternatives support full observability (MELT stack)?
Yes, CubeAPM, Datadog, and Dynatrace offer full-stack MELT with APM, RUM, logs, infrastructure, and synthetic monitoring.
4. Are there self-hosted or data-residency-friendly Coralogix alternatives?
Yes. Tools like CubeAPM, Grafana OSS, Sentry (self-hosted), and SigNoz offer on-prem or private cloud deployment options, suitable for organizations with data sovereignty or compliance needs.
5. Which Coralogix alternative is best for cost-effective logging at scale?
For high-volume logging use cases, platforms with smart sampling or stream-based control offer better long-term value. CubeAPM provides cost-efficient ingestion at $0.15/GB with smart trace sampling and full MELT support.


