Windows Server monitoring tools are indispensable for safeguarding performance, uptime, and security in increasingly complex IT environments. As of 2025, the global observability tools and platforms market is estimated to exceed US$28.17 billion, reflecting how vital monitoring has become across enterprise stacks.
But picking the right Windows Server monitoring tool remains a headache. Costs balloon with ingestion volume, retention policies turn rigid, and many tools excel in cloud-native environments yet stumble when handling legacy Windows services. Hidden fees, slow support, and vendor lock-in still top the list of user complaints in mid-2025.
CubeAPM addresses these pain points head-on. CubeAPM is the best Windows Server monitoring tool provider, combining CPU, memory, disk I/O, Event Log, process monitoring, and dependency mapping; all under affordable pricing, unlimited retention, and OpenTelemetry-native flexibility. In this article, we’ll explore the top Windows Server monitoring tools, covering features, pricing, and ideal use cases.
Top 8 Windows Server Monitoring Tools in 2025
- CubeAPM
- Datadog
- New Relic
- Dynatrace
- SolarWinds Server & Application Monitor (SAM)
- ManageEngine OpManager
- Paessler PRTG
- Zabbix
What is a Windows Server Monitoring Tool?
A Windows Server monitoring tool is software designed to continuously track the health, performance, and availability of Windows-based servers. It collects system metrics (CPU, memory, disk usage, network I/O), monitors essential services like Active Directory, IIS, and SQL Server, and captures event logs for deeper troubleshooting. These insights help IT teams detect anomalies early, prevent downtime, and optimize infrastructure usage.
For modern businesses, Windows Server monitoring isn’t just about uptime—it’s about ensuring reliability and user experience at scale. When configured correctly, monitoring tools become an enabler of cost efficiency, compliance, and customer satisfaction:
- Reduced downtime: Early detection of failing processes or resource bottlenecks prevents service interruptions.
- Performance optimization: Tracking memory leaks, I/O spikes, and CPU saturation keeps applications responsive.
- Security & compliance: Event log analysis reveals failed logins, policy violations, and other security signals critical for frameworks like GDPR and HIPAA.
- Scalability & forecasting: Trend analysis of server metrics helps IT teams right-size infrastructure and control cloud costs.
By integrating these capabilities with modern observability practices, distributed tracing, log monitoring, real-user monitoring, and synthetic tests, businesses gain a holistic view across both Windows and cloud-native stacks. This unified visibility is what transforms server monitoring from a basic ops task into a driver of digital resilience.
Example: Monitoring SQL Server Performance with CubeAPM
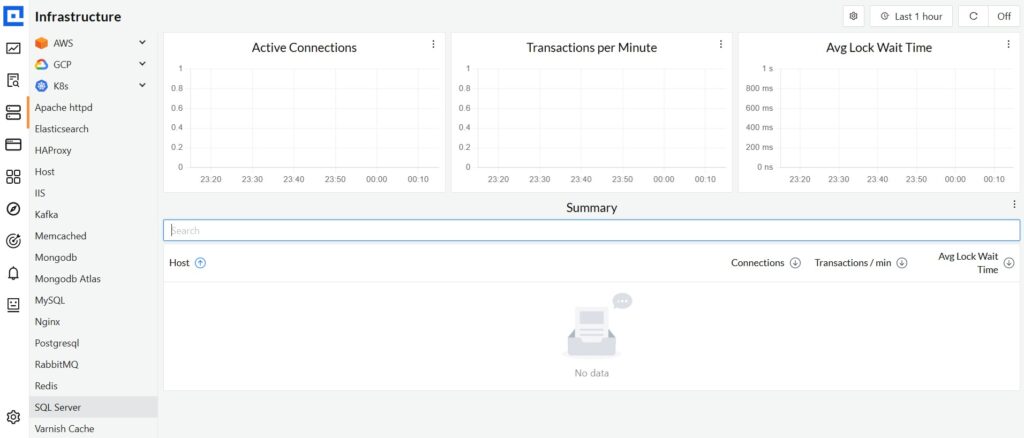
Using CubeAPM, teams can monitor a Windows Server running Microsoft SQL Server in real time. The tool ingests Windows Performance Counters and Event Logs into its observability pipeline. From there, CubeAPM automatically correlates metrics like CPU utilization, disk I/O, and memory pressure with SQL query latency. If a query causes high resource consumption, CubeAPM’s Smart Sampling ensures the trace is retained, allowing engineers to drill into execution plans and find the root cause.
On the CubeAPM dashboard, admins can see spikes visualized in real time, cross-linked with logs and traces. Alerts trigger instantly if memory thresholds exceed safe levels, while synthetic checks verify the database endpoint’s availability from multiple locations. The outcome: faster troubleshooting, fewer outages, and better SLA compliance—all delivered at a fraction of the cost of traditional monitoring suites
Why Teams Choose Different Windows Server Monitoring Tools
Cost predictability and pricing transparency
Windows Server monitoring often produces massive telemetry—Performance Counters, Event Logs, IIS metrics, and SQL traces. When tools charge by host, ingestion volume, or add-ons, costs can spiral unexpectedly. Reviews on G2 and discussions on Reddit highlight unpredictable bills and hidden ingestion fees as major reasons IT teams re-evaluate their tools.
OpenTelemetry-first and vendor neutrality
With Windows workloads increasingly tied to cloud-native ecosystems, enterprises are embracing OpenTelemetry as a standard for instrumentation. OTel support allows them to send telemetry anywhere, avoiding vendor lock-in and lowering switching costs. This flexibility has become a key criterion in 2025 evaluations (CNCF OTel Report).
Native Windows telemetry and Event Log collection
Organizations require deep integration with Windows-native signals like PerfMon counters, IIS app pool performance, and Active Directory logs. Some prefer agentless Windows Event Forwarding (WEF) for scale, while others deploy agents for enrichment and filtering. Tools that don’t support both collection models struggle in real-world Windows environments, especially those with compliance requirements.
Hybrid and multicloud readiness (Azure Arc + AMA)
Enterprises now run Windows Servers on-prem, in Azure, and across other clouds. Microsoft’s Azure Arc and the new Azure Monitor Agent (AMA) are central to this shift, but migration from legacy agents and managing Data Collection Rules (DCRs) adds complexity. Teams choose tools that integrate seamlessly with Arc/AMA and still support non-Azure Windows estates, ensuring flexibility in hybrid setups.
Strong RCA with cross-signal correlation
Windows issues rarely appear in isolation—an IIS recycle or SQL latch can cascade into CPU pressure and application slowdowns. Teams value tools that correlate metrics, logs, and traces in one view, enabling faster root-cause analysis (RCA). Without this correlation, IT teams spend hours piecing together silos, delaying fixes (Gartner Research).
Security, compliance, and workload-specific needs
Windows Server monitoring tools must also handle security-critical events (failed logins, GPO changes) and support workload-specific visibility. IIS, SQL Server, and Active Directory demand tailored dashboards and alerts that go beyond generic metrics. For industries governed by GDPR, HIPAA, or financial regulations, this capability often drives tool selection as much as price or integrations.
Top 8 Windows Server Monitoring Tools
1. CubeAPM
Overview
CubeAPM has built a strong reputation as an OpenTelemetry-native observability platform that delivers predictable costs and deep integration for Windows environments. It is known for providing full-stack monitoring—including servers, IIS, SQL Server, and Active Directory—while also excelling in distributed tracing, logs, and synthetic monitoring. In a crowded market dominated by usage-metered vendors, CubeAPM positions itself as the most cost-efficient choice for Windows Server monitoring without compromising on enterprise-grade features.
Key Advantage
Cost-effective Windows Server monitoring with unlimited retention and predictable pricing.
Key Features
- Windows Performance Counter Monitoring: Collects CPU, memory, disk I/O, and network usage directly from Windows servers for proactive health checks.
- Windows Event Log Ingestion: Centralizes system, application, and security logs to detect failures, errors, and policy violations in real time.
- IIS Application Insights: Tracks request rates, error codes, and worker process utilization for Microsoft IIS workloads.
- SQL Server Monitoring: Correlates query performance, latency, and system resource usage to uncover bottlenecks.
- Active Directory Visibility: Provides metrics on authentication latency, failed logins, and domain controller health.
Pros
- Predictable pricing tied to data volume
- Strong integrations with 800+ platforms
- OpenTelemetry-first, ensuring vendor neutrality
- Real-time correlation of metrics, logs, and traces
- Easy deployment across hybrid environments
Cons
- Less suitable for teams that prefer vendor-hosted, off-premises solutions only
- Designed purely for observability and does not include cloud security management capabilities
CubeAPM Pricing at Scale
CubeAPM uses a transparent pricing model of $0.15 per GB ingested. For a mid-sized business generating 45 TB (~45,000 GB) of data per month, the monthly cost would be ~$7,200/month*.
*All pricing comparisons are calculated using standardized Small/Medium/Large team profiles defined in our internal benchmarking sheet, based on fixed log, metrics, trace, and retention assumptions. Actual pricing may vary by usage, region, and plan structure. Please confirm current pricing with each vendor.
Tech Fit
CubeAPM is a strong fit for Windows Server ecosystems, including IIS, SQL Server, and Active Directory, while also supporting Linux, containerized workloads, and multi-cloud deployments. With 800+ integrations and OTel-native compatibility, it suits enterprises running .NET, Java, Node.js, Python, and other major stacks side by side with Windows infrastructure.
2. Datadog
Overview
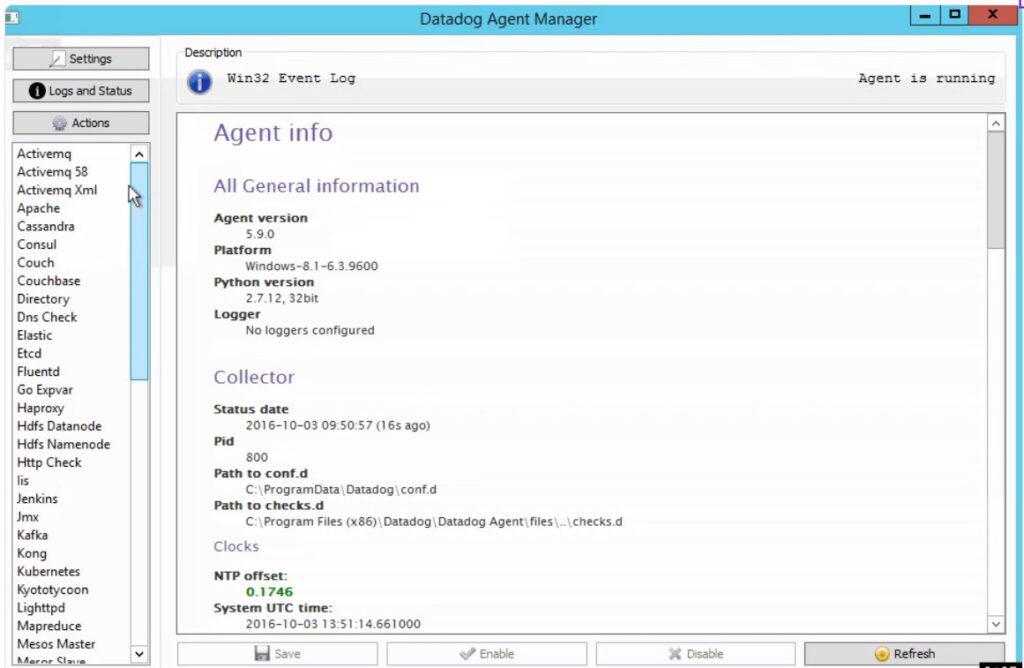
Datadog is a popular SaaS observability platform recognized for its Windows Server monitoring capabilities, using a single Windows Agent to gather metrics from services, Performance Counters, IIS, and Windows Event Logs. It’s positioned as a strong choice for organizations that want broad Windows-native telemetry alongside cloud and application monitoring, though it’s often considered costly at scale.
Key Advantage
Comprehensive Windows-native integrations through one agent—covering services, PerfMon counters, and Event Logs together with metrics, logs, and traces.
Key Features
- Windows Agent & Service Checks: Tracks service status and availability, raising alerts when failures occur.
- Windows Performance Counters: Collects CPU, memory, disk, and queue metrics for real-time monitoring.
- Windows Event Logs: Ingests key channels like System, Security, and Application with parsing and tagging.
- IIS Monitoring: Monitors request throughput, status codes, and worker process performance.
- Hybrid Server Monitoring: Correlates Windows host telemetry with app traces and logs across cloud and on-prem.
Pros
- Rich Windows integrations for services, PerfMon, Event Logs, and IIS
- Unified dashboards that correlate metrics, logs, and traces
- 900+ integrations for hybrid and multi-cloud setups
- Strong documentation for Windows deployments
Cons
- Pricing complexity can escalate quickly as ingestion volume and features increase
- SaaS-only deployment; no self-hosting or on-prem available
Datadog Pricing at Scale
Datadog charges differently for different capabilities. APM starts at $31/month; infra starts at $15/month; logs start at $0.10/GB, and so on. For a mid-sized business ingesting around 45 TB (~45,000 GB) of data per month, the cost would come around $27,475/month.
Tech Fit
Datadog is well-suited for Windows Server environments running IIS, .NET applications, and SQL Server, especially in hybrid estates spanning on-premises and cloud. It’s strong for enterprises that prioritize deep integrations but can absorb the higher costs.
3. New Relic
Overview
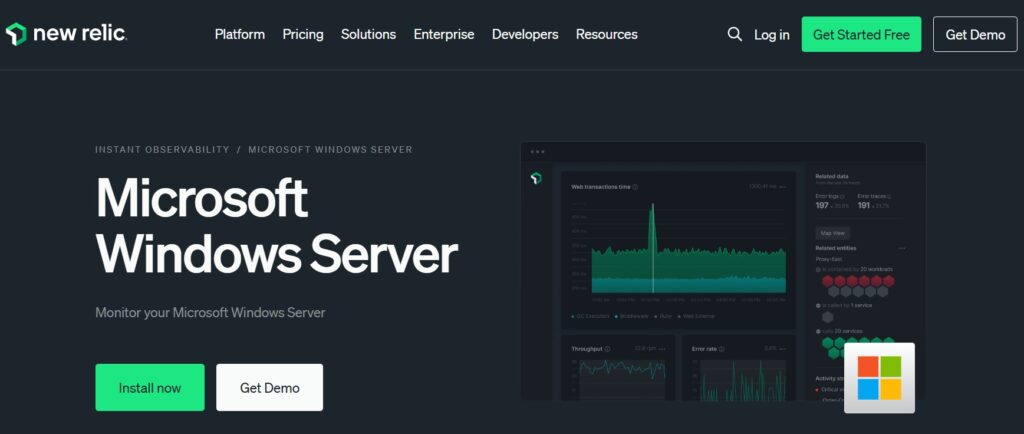
New Relic is a usage-based observability platform known for strong Windows coverage through its infrastructure agent and “Instant Observability” quickstarts. It’s widely adopted by teams that want end-to-end visibility across Windows Server, IIS, SQL Server, and Windows Services while centralizing metrics, logs, and alerting in one place. Its market position emphasizes easy onboarding, curated Windows content, and flexible pricing options for data ingest and users.
Key Advantage
Windows Services + Event Log + PerfMon in one workflow, delivered via a mature Windows agent and ready-made quickstarts.
Key Features
- Windows infrastructure agent (MSI/ZIP): Simple install methods and policy-friendly rollout for server fleets.
- Windows Services integration: Track service states, start modes, host coverage, and alert on failures.
- Windows Event Logs: Ingest Application, System, and Security channels with parsing and tagging for investigations.
- IIS quickstart: Monitor request throughput, error codes, and worker processes to troubleshoot web apps.
- Performance Counters: Collect key PerfMon metrics (CPU, memory, disk I/O, queues) and correlate with app telemetry.
Pros
- Mature Windows Server, IIS, SQL Server, and Event Log support
- Good install flexibility for enterprise rollout and automation
- Strong dashboards, alerts, and quickstarts to accelerate value
- Broad ecosystem and documentation for Windows use cases
Cons
- Usage-based pricing can scale up quickly with large Windows Event Log and metrics volumes
- SaaS-based only; no self-hosting
New Relic Pricing at Scale
New Relic’s billing is based on data ingested, user licenses, and optional add-ons. The free tier offers 100 GB of ingest per month, then it costs $0.40 per GB after that. For a business ingesting 45 TB of logs per month, the cost would come around $25,990/month.
Tech Fit
Excellent for Windows Server environments running IIS/.NET and SQL Server, especially where teams want curated quickstarts, robust dashboards, and correlation across metrics, logs, and APM. Works well in hybrid estates and mixed stacks alongside Linux and cloud services.
4. Dynatrace
Overview
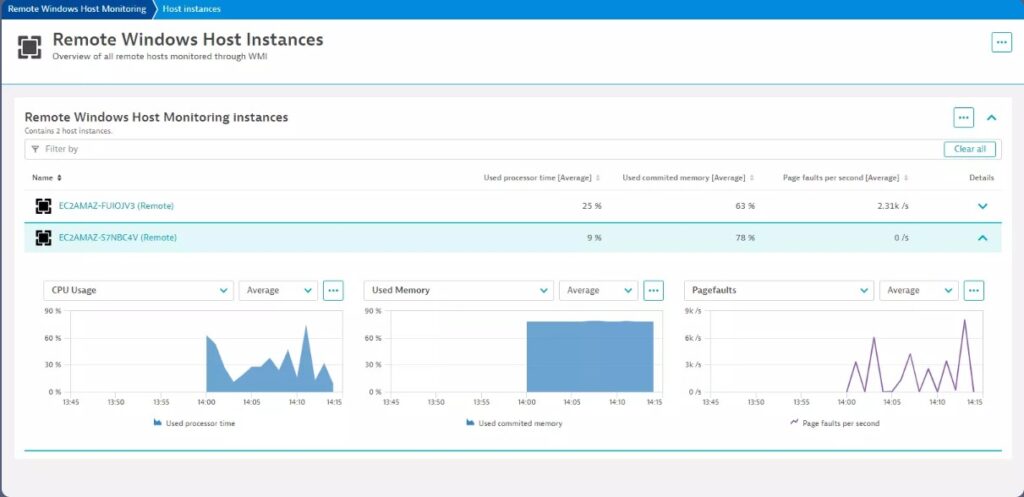
Dynatrace is an enterprise observability platform known for deep Windows Server coverage through its OneAgent and curated Windows extensions. It combines host metrics, Windows Services availability, Event Logs, WMI-based remote collection, IIS insights, and scheduled task monitoring with automated topology (Smartscape) and AI-assisted RCA—positioning it as a strong fit for large Windows estates that need correlated, real-time diagnostics.
Key Advantage
End-to-end Windows visibility (agent and agentless) with OS service availability, IIS, Event Logs, and WMI-based remote monitoring in one platform.
Key Features
- OS Services monitoring: Per-minute availability metrics and basic/advanced alerting to catch stopped or flapping Windows services.
- IIS extension: Auto-instrumented insight into sites, app pools, requests, and status codes, plus a ready dashboard.
- Event Log awareness: Windows Event Logs are analyzed in context with host and application signals for faster RCA.
- Agentless WMI collection: Remote Windows host monitoring when OneAgent cannot be installed.
- Scheduled Tasks tracking: Extension polls the Task Scheduler state and last run to surface failures or delays.
Pros
- Strong Windows Server depth (services, IIS, Event Logs, WMI)
- Automated discovery and dependency mapping for RCA
- Flexible deployment: OneAgent or remote WMI collection
- Mature extensions ecosystem and policy-based rollouts
Cons
- Expensive for smaller teams
- Learning curve is steep
Dynatrace Pricing at Scale
- Full stack: $0.01/8 GiB hour/month or $58/month/8GiB host
- Log Ingest & process: $0.20 per GiB
For a similar 45 TB (~45,000 GB/month) volume, the cost would be $21,850/month.
Tech Fit
A strong match for Windows Server fleets that need IIS/.NET, Windows Services, Event Logs, and scheduled jobs monitored alongside application traces. Works well in hybrid environments where some hosts can run OneAgent, and others require agentless WMI collection.
5. SolarWinds Server & Application Monitor (SAM)
Overview
SolarWinds SAM is a long-standing choice for Windows Server monitoring across on-prem and hybrid estates, known for its AppInsight content packs that go deep on Microsoft workloads like IIS, SQL Server, and Active Directory. It pairs Windows service/process checks, Performance Counter coverage, and Event Log monitors with rich, drill-down dashboards and capacity planning—positioning SAM as a strong fit for Windows-heavy environments that want detailed, ops-friendly visibility without moving all telemetry to a SaaS backend.
Key Advantage
Windows-native AppInsight packs that expose hundreds of IIS/SQL/AD metrics and actions out of the box.
Key Features
- AppInsight for IIS: Monitor sites, app pools, request rates, errors, and worker processes with ready dashboards.
- AppInsight for SQL Server: Track query performance, agent jobs, waits, latency, and resource pressure for fast RCA.
- Windows Services Monitor: Alert on stopped/flapping services and enforce start modes across servers.
- Windows Event Log Monitors: Parse Application/System/Security channels and trigger action-oriented alerts.
- PerfMon/WMI Coverage: Collect CPU, memory, disk I/O, queues, and process counters for proactive health checks.
Pros
- Very deep, Windows-specific content for IIS and SQL Server
- Strong on-prem option with granular control and data locality
- Mature alerting, reports, and capacity planning for server teams
- Works well alongside existing AD/GPO and platform tooling
Cons
- Licensing and tiering by nodes/sensors can be complex
- Heavier initial setup and ongoing tuning for large estates
SolarWinds SAM Pricing at Scale
The official SolarWinds site uses a “Get a Quote” model for SAM and doesn’t price by GB of ingest. As a brief reference, resellers publicly list examples such as SAM500 (subscription renewal, 1 year, up to 500 nodes) at around $31,462 and SAM500 (perpetual license + first-year maintenance) at around $91,839; actual quotes vary by tier and licensing.
Tech Fit
Best for Windows-centric, on-prem or hybrid environments that want deep IIS/SQL/AD visibility, robust Windows Services and Event Log monitoring, and the ability to keep monitoring data inside their own network. Works well for teams comfortable managing Windows credentials, WMI/PerfMon, and GPO-driven agent/template rollout.
6. Paessler PRTG
Overview
Paessler PRTG is a long-running favorite for Windows Server monitoring in on-prem and hybrid networks. It’s known for a sensor-based model and deep WMI/PerfCounter coverage that fits classic Windows estates—tracking core OS health, Windows Services, IIS, Event Logs, and more—without forcing teams to ship all telemetry to a SaaS back end. For many admins, PRTG’s strength is quick time-to-value on Windows thanks to ready-made sensors and clean, ops-friendly dashboards.
Key Advantage
WMI/PerfCounter-first monitoring with extensive, ready Windows sensors that map cleanly to IIS/AD/SQL and core OS health.
Key Features
- Windows Performance Counters: Collects CPU, memory, disk I/O, queues, and process metrics using native counters for precise Windows health checks.
- WMI Monitoring: Uses WMI sensors for Windows Services status, process details, and system components across large fleets.
- IIS Monitoring: Tracks site availability, request throughput, and worker process behavior via dedicated IIS sensors.
- Windows Event Logs: Watches Application/System/Security channels to surface errors and security-relevant events.
- Device & Dependency Maps: Visualizes Windows servers and dependencies for faster impact analysis and RCA.
Pros
- Strong Windows coverage via WMI and Performance Counters
- Large catalog of Windows sensors, including IIS/SQL/AD use cases
- Easy to start on-prem with straightforward dashboards and maps
- Suits teams that prefer to keep monitoring data inside the network
Cons
- Sensor-based licensing needs careful sizing as the scope grows
- UI can be improved
- Learning curve
PRTG Pricing at Scale
For PRTG, pricing at scale is based on sensor tiers rather than data volume. According to the official Paessler pricing, monitoring around 250 devices fits into the PRTG 2500 subscription tier, priced at $625 per month when billed annually. This tier supports up to 2,500 sensors, which typically maps to roughly 250 devices depending on sensor usage. Costs remain fixed at this tier unless additional sensors or higher tiers are required, making PRTG predictable but constrained by sensor limits as environments grow.
Tech Fit
Best for Windows-centric, on-prem or hybrid environments that rely on WMI/PerfCounters, IIS/.NET, AD/SQL, and want an ops-friendly NMS-style experience. Works well for SMBs and mid-market teams that prefer agentless WMI/PerfCounter approaches, maintain their own monitoring servers, and value straightforward dashboards over heavy analytics.
7. ManageEngine OpManager
Overview
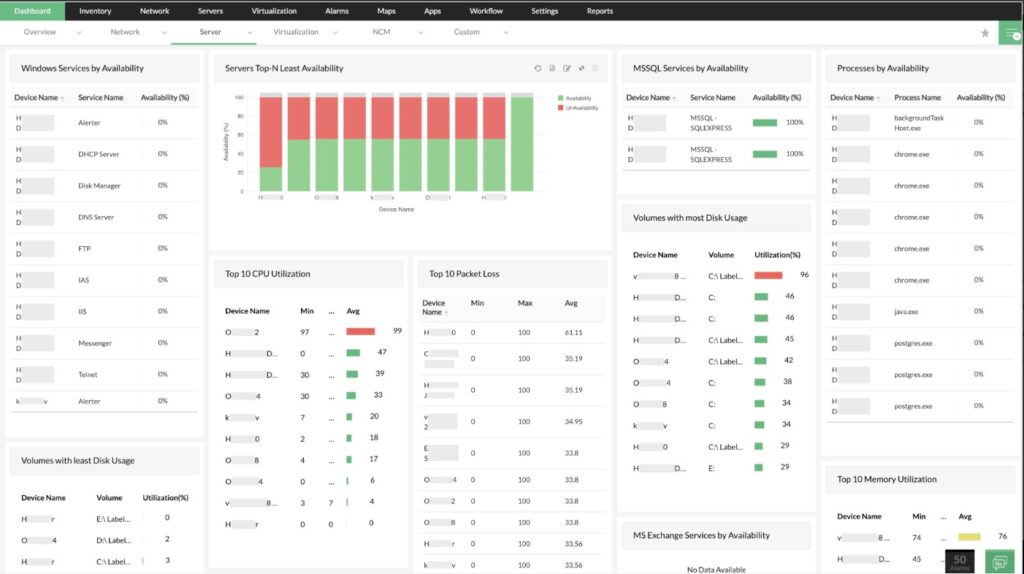
ManageEngine OpManager is a device-based, on-prem-friendly platform that’s well regarded for Windows Server monitoring across midsize and enterprise environments. It leans on WMI/PerfMon for OS health, tracks Windows Services, watches Event Logs, and offers IIS/SQL visibility, all inside familiar, ops-centric dashboards. Many teams choose OpManager when they want deep Windows coverage without shipping all telemetry to a SaaS back end.
Key Advantage
Device-based Windows monitoring with strong WMI/PerfMon coverage that fits organizations preferring on-prem control and AD/GPO-friendly rollout.
Key Features
- Windows Performance Counters: Collect CPU, memory, disk I/O, queues, and process metrics for proactive health checks.
- Windows Services Monitoring: Track service state/start mode and alert on stopped or flapping services across servers.
- Windows Event Logs: Watch Application/System/Security channels and trigger notifications for errors and policy changes.
- IIS & SQL Visibility: Use native checks and templates to monitor site availability, status codes, and database health.
- WMI/Credential Profiles: Apply domain credentials and policies to scale monitoring cleanly across large Windows estates.
Pros
- Strong Windows coverage via WMI and Performance Counters
- Familiar, on-prem deployment with data locality
- Works well with AD/GPO and policy-driven rollouts
- Straightforward dashboards for server ops teams
Cons
- Device-based licensing requires careful cost planning as the footprint grows
- Customer needs to improve
- Complex setup
OpManager Pricing at Scale
ManageEngine OpManager pricing scales by number of monitored devices and edition. From the official pricing page, the Enterprise Edition supports around 250 devices at $4,595 per year (about $383/month), which is the relevant tier for mid-sized environments. Smaller setups start with Standard or Professional editions at lower device counts, while larger deployments require additional device licenses or higher tiers. Costs increase as device counts grow, but remain predictable and device-based, rather than tied to data ingestion volume.
Tech Fit
Best for Windows-centric, on-prem or hybrid environments that prefer WMI/PerfMon and policy-managed rollouts, need solid Windows Services/Event Log coverage, and want to keep monitoring data inside the network. Works well alongside AD, GPOs, and existing Windows ops practices.
8. Zabbix
Overview
Zabbix is a mature, open-source platform that excels at Windows Server monitoring through native agents, Windows Performance Counters, and Event Log collection. With official Windows templates (including IIS) and low-level discovery for Windows services, Zabbix is popular with teams that want deep, customizable Windows visibility while keeping control over where data lives—self-hosted or in Zabbix Cloud.
Key Advantage
Agent-driven Windows telemetry with official templates (PerfCounters, Event Logs, IIS, services) that you can run fully on-prem or in Zabbix Cloud.
Key Features
- Windows Performance Counters: Collect OS and app counters (CPU, memory, disk I/O, queues) for precise server health tracking.
- Windows Event Logs (active checks): Ingest Application/System/Security events for failures, logons, and policy changes.
- Windows Services discovery: Auto-discover and watch service state/start mode across fleets for targeted alerting.
- IIS monitoring template: Ready-to-use IIS template without external scripts for sites, requests, and status codes.
- Self-hosted or Cloud: Run the open-source stack yourself, or use Zabbix Cloud with published entry tiers.
Pros
- Free open-source core with flexible self-hosting
- Deep Windows coverage via PerfCounters, Event Logs, IIS, and service discovery
- Strong templates and automation for Windows fleets
- Data locality and control for regulated environments
Cons
- More DIY tuning for templates, thresholds, and maintenance
- Learning curve and setup complexity
- Official support is quote-based unless you self-support
Zabbix Pricing at Scale
- Zabbix Open Source (self-hosted): Software is free (AGPLv3). Your costs are infrastructure (VMs, storage, DB), ops time, and optional commercial support, which is quote-based on the official site.
- Zabbix Cloud: Public tiers start at $50/month (Nano) and include 10 GB of storage to begin; higher tiers scale up by resources. Exact costs for heavy Windows estates depend on the chosen tier.
A typical mid-sized business tier at around $750/month includes roughly 1,000 NVPS (new values per second), which defines how much metric data the platform can process. This makes Zabbix predictable at scale: unlimited usage if self-managed, or fixed, NVPS-based pricing in the cloud without ingestion-driven cost spikes.
Tech Fit
Great for Windows-centric teams that want tight control and on-prem operations, need PerfCounter + Event Log + IIS coverage, and are comfortable managing their own monitoring stack—or prefer a light, published-tier cloud option with Zabbix Cloud.
How to choose the right Windows Server Monitoring Tools
Windows-native telemetry depth
Prioritize tools that deeply cover Windows Performance Counters, Windows Services, Event Logs, IIS, SQL Server, and Active Directory. You want ready dashboards and alerts for IIS/ASP.NET signals (requests/sec, queued requests, worker process health) and SQL latency, not just generic host metrics. Depth here determines whether you catch real Windows issues early.
Event Log collection: WEF/WEC vs. agent
Decide upfront whether you’ll centralize Windows Event Logs with WEF→WEC (lower host overhead) or use agents for parsing, enrichment, and buffering. The right tool should support both models, least-privilege rollout in domains, and reliable filtering to handle noisy Security logs without drops.
Hybrid & multicloud readiness (Arc + AMA)
If you span on-prem and cloud, ensure clean integration with Azure Arc and Azure Monitor Agent, including Data Collection Rules for precise routing. Policy-based deployment, consistent tagging, and RBAC across Windows hosts—Azure and non-Azure—will make operations predictable at scale.
Cost model fit for Windows realities
Windows estates generate heavy telemetry from Event Logs, PerfMon, IIS access/error logs, SQL waits, and scheduled tasks. Model total cost with your real volumes across ingest, retention, query scans, hosts/users/add-ons, then stress-test scenarios (bursting Security logs, new IIS sites) to avoid bill shock.
Cross-signal correlation & RCA
Favor platforms that correlate metrics, Event IDs, traces, and user impact in one view. You should be able to pivot from a Windows Service stop or IIS app-pool recycle to affected URLs, SQL waits, CPU/disk queues, and back—shrinking mean time to detect and resolve.
OpenTelemetry support (avoid lock-in)
Confirm the vendor supports OpenTelemetry Collector/SDKs on Windows and has solid exporters for .NET and mixed stacks. This keeps instrumentation portable so you can change backends without re-instrumenting, and lets you tune sampling while preserving the high-value Windows signals.
Deployment, lifecycle, overhead & reliability
Plan agent/agentless rollout via GPO/SCCM/Intune or Arc policies, and verify silent installs, upgrades, and policy drift detection. Tune WMI/PerfMon intervals to limit host load, and require store-and-forward/backpressure so bursts or network hiccups don’t lose Windows events.
Security, compliance & data residency
Ensure secure handling of Security/Sysmon/AD events with role-based access and audit-friendly retention. If residency matters, pick a platform that can keep Windows telemetry on-prem or in-region, with clear controls for segregating sensitive logs from operational data.
Prove it with a Windows-specific pilot
Run a time-boxed pilot on IIS front ends, SQL back ends, and domain controllers using your actual Event Log/PerfMon profiles. Include WEF subscriptions or agents, IIS/ASP.NET counters, and (if hybrid) Arc/AMA DCRs, then measure setup effort, data fidelity, RCA speed, host overhead, and total projected cost.
Conclusion
Choosing a Windows Server monitoring tool is hard: costs balloon with Event Logs and PerfMon volumes, pricing models hide extras, and many platforms miss real Windows depth across IIS, SQL Server, AD, and scheduled tasks. Add deployment friction (agents vs WEF/WEC), lock-in worries, and data-residency needs—and teams hesitate.
CubeAPM removes that friction. It delivers Windows-native telemetry (Performance Counters, Windows Services, Event Logs, IIS/SQL/AD), correlates metrics, logs, and traces for fast RCA, supports OpenTelemetry to avoid lock-in, and offers predictable $0.15/GB pricing with no extra infrastructure or data-transfer charges.
Book a free demo with CubeAPM today and explore the platform.
Disclaimer: The information in this article reflects the latest details available at the time of publication and may change as technologies and products evolve.
FAQs
1. Do Windows Server monitoring tools work on Server Core and Nano Server?
Yes. Most modern tools support Server Core/Nano via lightweight agents or remote collection (WMI/WinRM/PerfCounters/Event Logs). For GUI-less hosts, ensure silent installs, GPO/SCCM/Intune deployment, and remote Event Log subscriptions. CubeAPM supports agent/collector-based setups that work well on Core images.
2. How can I estimate monitoring overhead on busy Windows servers?
Baseline CPU, memory, and disk I/O, then enable a subset of counters/log channels and increase gradually. Prefer longer scrape intervals for heavy WMI classes, exclude noisy Security/Event Log channels, and verify store-and-forward buffers. Most teams target <2% CPU and minimal I/O from the monitoring footprint.
3. What’s the cleanest path to migrate from SCOM to a newer platform?
Export SCOM management pack coverage for IIS/SQL/AD and map those to the target tool’s equivalent sensors/dashboards. Run both in parallel for 2–4 weeks, validate alert parity (rules, severities, suppressions), then cut over per server group. CubeAPM provides OTel-native collectors and Windows packs to speed parity checks.
4. Can Windows telemetry stay on-prem for compliance or air-gapped networks?
Yes, choose tools that support on-prem or BYOC deployment, local storage, and role-based access. Set longer retention for Security/AD events than operational logs, and segment access to sensitive channels. CubeAPM offers on-prem/BYOC options, so Windows telemetry can remain inside your environment or region.
5. What alerting strategy works best for Windows estates?
Use layered alerts: (a) service availability (critical services stopped), (b) performance SLOs (CPU ready/queue length, disk latency, memory pressure), (c) security/audit signals (Account Lockout, 4625 spikes). Tie alerts to runbooks, add automatic enrichment (last Event IDs, top processes), and route incidents to the right on-call with business-hour policies.


