The main difference between New Relic, Dynatrace, and CubeAPM is how much control teams have over observability data, costs, and operations.
New Relic emphasizes SaaS convenience and quick onboarding, Dynatrace focuses on automated, AI-driven observability for large enterprises, while CubeAPM is built for teams that want self-hosted, OpenTelemetry-based observability with predictable pricing and full data ownership.
As systems grow, observability challenges shift from basic visibility to cost predictability, retention limits, sampling accuracy, and access to complete data during incidents. This article compares New Relic vs Dynatrace vs CubeAPM across cost, features, deployment, and more.
New Relic vs Dynatrace vs CubeAPM Comparison
This table compares New Relic, Dynatrace, and CubeAPM across core observability dimensions that matter at scale, including deployment model, pricing structure, sampling behavior, data retention, and support responsiveness. It highlights how each platform differs in control, cost predictability, and operational trade-offs beyond surface-level features.
| Feature | CubeAPM | Dynatrace | New Relic |
| Known for | Unified MELT, native OTEL, self-hosting, cost predictability | Enterprise observability, AI-driven automation, deep visibility | Full-stack APM, service maps, advanced analytics |
| Multi-Agent Support | Yes (OTel, New Relic, Datadog, Elastic, etc.) | Limited (OneAgent, OTel) | Yes (New Relic Agent, OTel, Prometheus) |
| MELT Support | Full MELT coverage | Full MELT coverage | Full MELT coverage |
| Deployment | Self-hosted with vendor-managed | SaaS-based & self-managed | SaaS-only |
| Pricing | Ingestion-based: $0.15/GB | Full-stack: $0.01/GiB-hour; infra:$0.04/ host-hour; Logs: $0.20/GiB | Free 100 GB/month; beyond: $0.40/GB. Per-user: $49-$349/month |
| Sampling Strategy | Smart sampling, automated, context-aware | Adaptive Traffic Management (ATM), head/tail-based sampling via OTel | Adaptive head- & tail-based |
| Data Retention | Unlimited Retention | Metrics: 15m; logs: 35d; Traces: 10d; RUM/synthetics: 35d | 30d for logs/events; add-on retention |
| Support Channel & TAT | Slack, WhatsApp; response in minutes | Chat & web ticket; Standard: 4d-4 hrs; Enterprise: 2d-30min | Community, docs, ticket; TAT: 2d to 2hrs, 1hr (priority) |
New Relic vs Dynatrace vs CubeAPM: Feature Breakdown
Known For
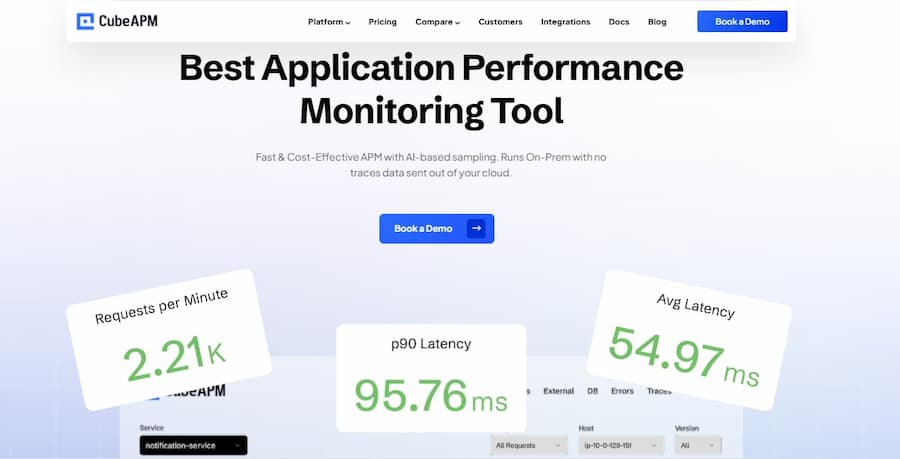
CubeAPM: CubeAPM is positioned as a full-stack observability and APM platform that unifies all telemetry types (metrics, events, logs, traces) with a native OpenTelemetry-first architecture. It emphasizes flexibility by supporting multiple agent types and deployment models (self-hosted with vendor-managed operations) while offering predictable pricing and full data ownership inside the customer’s environment.
New Relic: New Relic is a cloud-based full-stack observability platform that consolidates telemetry data, including APM, infrastructure metrics, logs, synthetics, and digital experience, into a unified UI with powerful analytics. It prioritizes ease of deployment, broad integrations, and an integrated data model that supports query-based exploration (e.g., NRQL) for operational insights.
Dynatrace: Dynatrace is an enterprise observability and software intelligence platform built to provide real-time observability, automation, and deep insights across applications, infrastructure, user experience, and security. It uses AI-powered capabilities such as Davis AI and Smartscape topology mapping to accelerate root-cause analysis and automate operations at scale.
Multi-Agent Support
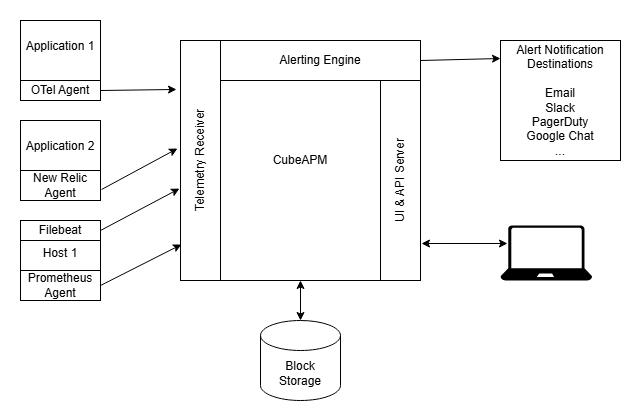
CubeAPM: CubeAPM is designed with broad multi-agent support, allowing teams to ingest telemetry from OpenTelemetry SDKs and collectors as well as agents from ecosystems like New Relic, Datadog, Elastic, and Prometheus. This approach enables gradual migrations, mixed environments, and OpenTelemetry-first instrumentation without forcing teams to standardize on a single proprietary agent.
New Relic: New Relic supports telemetry ingestion through its own language-specific agents as well as OpenTelemetry and Prometheus integrations. This allows teams to use New Relic agents where deep platform integration is needed, while also supporting standards-based instrumentation for newer services or heterogeneous environments.
Dynatrace: Dynatrace primarily relies on its proprietary OneAgent for automatic instrumentation across applications, infrastructure, containers, and services. While Dynatrace supports ingesting OpenTelemetry data via OTLP endpoints and the Dynatrace OpenTelemetry Collector, OneAgent remains the core and preferred mechanism, rather than a true multi-vendor agent model.
MELT Support
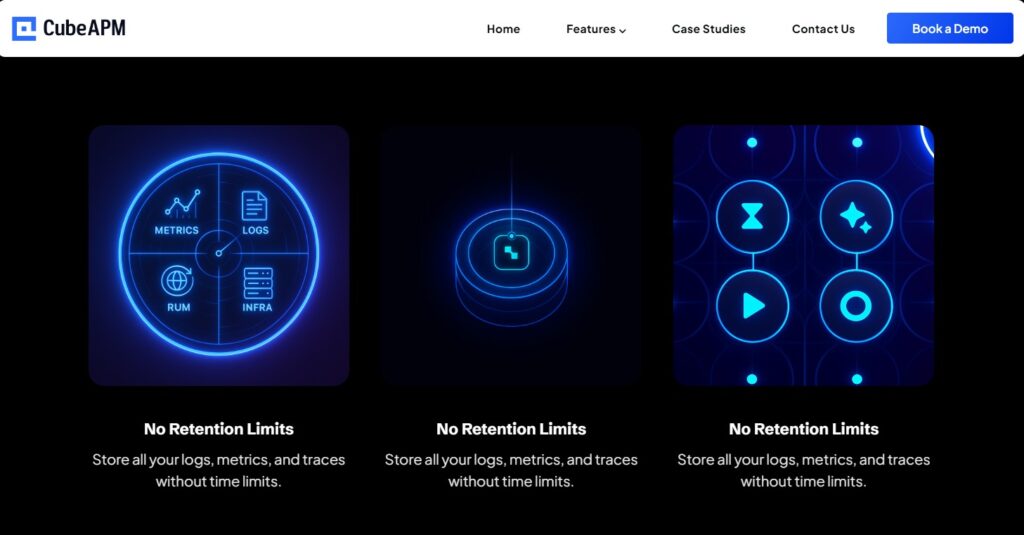
CubeAPM: CubeAPM provides full MELT support by design, covering metrics, events, logs, and traces on a unified backend. All signals are ingested through OpenTelemetry-native pipelines and correlated at query time, allowing teams to move seamlessly from high-level metrics to logs and traces without switching tools or storage layers.
New Relic: New Relic offers full MELT coverage through its unified observability platform, combining APM, infrastructure monitoring, logs, distributed tracing, synthetics, and digital experience monitoring. Telemetry is correlated using a shared data model and explored through NRQL, enabling cross-signal analysis from a single interface.
Dynatrace: Dynatrace supports full MELT observability across applications, infrastructure, user experience, and security. Metrics, logs, traces, and events are automatically correlated using Dynatrace’s Smartscape topology model and Davis AI, enabling context-aware analysis across services, hosts, containers, and user sessions.
Deployment
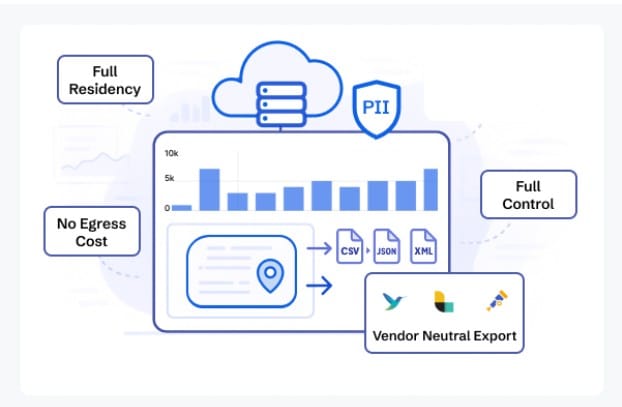
CubeAPM: CubeAPM is deployed as a self-hosted observability platform that runs inside the customer’s own cloud or on-prem infrastructure, with setup, upgrades, and operational management handled by the CubeAPM team. This model allows organizations to retain full control over their telemetry data and meet strict data residency or compliance requirements without running the platform themselves.
New Relic: New Relic operates as a SaaS-only observability platform, where all telemetry data is sent to and processed within New Relic’s cloud infrastructure. This approach minimizes deployment and operational effort for customers but does not support self-hosted or customer-managed backend deployments.
Dynatrace: Dynatrace supports two official deployment models. Dynatrace SaaS is fully hosted and managed by Dynatrace, while Dynatrace Managed allows customers to run the Dynatrace platform components in their own data centers or cloud environments. Both models use the same core technology and OneAgent instrumentation, with deployment choice driven primarily by compliance and operational preferences.
Pricing for Small, Mid, and Large Teams
To summarize the pricing:
*All pricing comparisons are calculated using standardized Small/Medium/Large team profiles defined in our internal benchmarking sheet, based on fixed log, metrics, trace, and retention assumptions. Actual pricing may vary by usage, region, and plan structure. Please confirm current pricing with each vendor.
| Approx. cost for teams (size) | Small (~30) | Mid-Sized (~125) | Large (~250) |
| CubeAPM | $2,080 | $7,200 | $15,200 |
| New Relic | $7,896 | $25,990 | $57,970 |
| Dynatrace | $7,740 | $21,850 | $46,000 |
CubeAPM Costs in Detail
CubeAPM: CubeAPM follows a single, ingestion-based pricing model. Telemetry data across logs, metrics, traces, and events is billed at $0.15 per GB ingested, with no per-host or per-user licensing. This pricing includes unlimited data retention and applies uniformly across all signals.
- Small teams (~ 30): $2,080
- Mid-sized teams (~ 125): $7,200
- Large teams (~250): $15,200
New Relic Cost in Detail
New Relic: New Relic offers a usage-based pricing model with both data ingest charges and per-user licensing. Every account includes 100 GB of free data ingestion per month; additional data ingest is billed at $0.40 per GB for Original Data or $0.60 per GB for the optional Data Plus tier.
For user-based pricing, Core users are priced at $49 per user per month, and Full Platform users are typically priced at $99 per user per month in the Standard edition. In higher editions, Full Platform user pricing can be $349 per user per month (annual commitment) or $418.80 per user per month (monthly pay-as-you-go).
Cost for different team sizes:
- Small teams: $7,896
- Mid-size teams: $25,990
- Large teams: $57,970
Dynatrace Cost in Detail
Dynatrace: Dynatrace uses a granular, usage-based pricing model published on its official rate card. Full-stack monitoring is priced at $0.01 per memory-GiB-hour, infrastructure monitoring at $0.04 per host-hour, log ingestion at $0.20 per GiB, and real user monitoring at $0.00225 per session. These units are aggregated under a Dynatrace Platform Subscription and scale with actual usage.
- Small teams: $7,740
- Mid-size teams: $21,850
- Large teams: $46,000
As telemetry volume grows with sustained traffic and expanding microservices, observability costs become more noticeable. What starts as a simple tooling expense often turns into a usage-driven cost that teams need to monitor and plan for, similar to other core infrastructure components.
Sampling Strategy
This section explains how each platform controls telemetry volume, what signals are prioritized, and how sampling decisions affect cost and incident visibility at scale.

CubeAPM: CubeAPM uses automated, context-aware Smart Sampling that evaluates traces based on attributes such as latency, error status, and request behavior before deciding what to retain. Sampling decisions are designed to preserve high-value signals during normal operation and incidents, while keeping ingestion predictable. The strategy is tightly aligned with OpenTelemetry pipelines and applies consistently across distributed tracing.
New Relic: New Relic supports adaptive sampling across its APM and OpenTelemetry pipelines, including both head-based and tail-based sampling strategies. Sampling can be configured at the agent or OpenTelemetry level to control ingest volume while prioritizing error traces and slow transactions. This flexibility allows teams to balance cost control with diagnostic depth depending on workload characteristics.
Dynatrace: Dynatrace relies on Adaptive Traffic Management (ATM) as its primary sampling mechanism. ATM dynamically adjusts trace capture rates to keep ingestion within licensed limits rather than using a fixed sampling percentage. Dynatrace does not natively implement classic head-based and tail-based sampling in its core platform; however, head- or tail-based sampling can be applied when traces are ingested via the Dynatrace OpenTelemetry Collector, where OpenTelemetry sampling processors are supported.
Data Retention
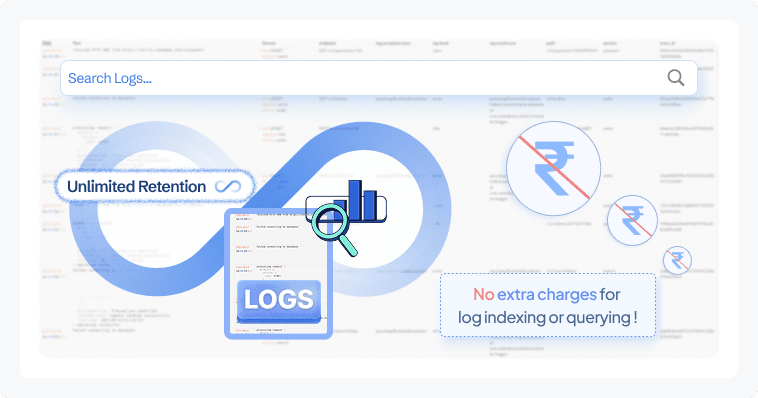
CubeAPM: CubeAPM provides unlimited data retention by default across metrics, logs, traces, and events, with no additional charges for longer retention periods. Because the platform is self-hosted in the customer’s environment, retention is not constrained by vendor-imposed limits and can be aligned with internal compliance, audit, or historical analysis requirements.
New Relic: New Relic retains logs and events for 30 days by default under standard plans, with extended retention available as a paid add-on. Metrics and trace retention varies by data type and plan, with longer retention requiring higher-tier subscriptions or additional spend. Retention limits are enforced at the platform level rather than being fully user-controlled.
Dynatrace: Dynatrace applies different default retention periods by data type, with options to extend retention using Grail buckets. Metrics are retained for 15 months by default, logs and RUM or synthetic monitoring data for 35 days, and distributed traces for 10 days. Using Grail, customers can configure custom retention for logs and traces from 1 day up to 10 years, depending on use case and compliance needs.
Support Channel & TAT
CubeAPM: CubeAPM offers real-time support via Slack and WhatsApp channels, giving customers direct access to engineering teams. Typical initial response times are measured in minutes, designed to accelerate incident troubleshooting and reduce mean time to resolution during production issues.
New Relic: New Relic publishes technical support offerings for paid support plans. For priority support (premium tier add-on), official documentation shows a 2-business-day initial support response SLA for standard issues (this covers initial ticket response expectation).
Higher tiers with expedited response and priority routing are available via New Relic Priority Support agreements (document referenced in official New Relic Priority Support materials). Exact per-severity response times (e.g., 1-hour or 2-hour for critical cases) are defined in contractual Priority Support SLAs provided to customers upon subscription.
Dynatrace: Dynatrace support is provided through the Dynatrace Support Center, including web ticketing and in-product assistance. Under Standard Support, official initial response times are:
- Critical (Severity 1): 4 business hours
- High (Severity 2): next business day
- Medium (Severity 3): 2 business days
- Low (Severity 4): 4 business days
With Enterprise Success & Support, which adds priority handling and 24×7 coverage, the published initial response targets are:
- Critical (Severity 1): 30 minutes
- High (Severity 2): 4 hours
- Medium (Severity 3): 1 business day
- Low (Severity 4): 2 business days
For an in-depth comparison of features and pricing, visit our CubeAPM vs New Relic page.
How Teams Typically Decide Between Dynatrace, New Relic, and Self-Hosted Observability
Choosing an observability platform at scale is rarely a purely technical decision. As usage grows, the evaluation expands beyond dashboards and features to include cost behavior, operational ownership, and organizational constraints.
Who is involved in the decision
Engineering teams usually drive the initial evaluation, focusing on visibility depth, debugging workflows, and how easily telemetry can be instrumented and queried. Finance teams become involved once observability spend grows with traffic and data volume, assessing pricing models, predictability, and long-term cost exposure. Security and compliance stakeholders weigh in when data residency, access controls, and regulatory requirements become relevant, especially in self-hosted or multi-region environments.
What questions block decisions
Teams often get stuck on questions that comparisons alone do not answer. Common blockers include how costs behave during incidents or traffic spikes, whether sampling or retention limits affect post-incident analysis, how difficult migrations or hybrid setups will be, and who ultimately owns and operates the observability backend. These questions tend to surface only after short trials or proof-of-concept deployments.
Why comparisons alone aren’t enough
Feature tables and pricing pages provide a starting point, but they rarely reflect real production behavior. At scale, the deciding factors are how the platform performs under sustained load, how transparent and controllable costs remain over time, and whether the operating model fits the team’s ownership and compliance expectations. As a result, many teams rely on staged rollouts, cost modeling, and incident simulations before making a final choice.
New Relic vs Dynatrace vs CubeAPM: Use Cases
This section outlines where each platform fits best in real-world environments, based on deployment needs, cost behavior, and operational priorities observed in production setups.
Choose CubeAPM if:
CubeAPM is best suited for teams that want strong observability coverage without sacrificing control, predictability, or long-term flexibility.
- You need self-hosted observability for strict data residency, compliance, or internal security policies, while still expecting vendor-managed setup and upgrades.
- You want an OpenTelemetry-native platform that works across mixed environments and agents, making migrations and hybrid setups easier.
- You are sensitive to cost predictability at scale, especially as log volume, trace fan-out, and microservice count increase (based on demo and sales data).
- You operate microservices-heavy architectures and need reliable end-to-end tracing across services without aggressive retention or sampling limits.
- You want to reduce MTTR by retaining high-value traces and logs during incidents, rather than losing data to early sampling decisions.
- You prefer unlimited data retention for audits, long-term performance analysis, or historical debugging.
- You run Java-based services such as Spring Boot, JVM microservices, or high-throughput backend APIs and want low-overhead tracing with deep visibility into latency, errors, and service dependencies.
- You are a startup or scaling engineering team looking for full-stack observability that is lightweight to operate but does not become prohibitively expensive as usage grows.
Choose New Relic if:
New Relic is often selected by teams that value fast onboarding and a SaaS-first observability experience.
- You want a SaaS-only platform that requires minimal operational effort to deploy and maintain.
- You need full-stack observability with APM, logs, metrics, synthetics, and RUM available out of the box through a unified interface.
- You prefer query-driven analysis using NRQL for ad-hoc investigation and custom dashboards.
- You are comfortable with a mixed pricing model that combines usage-based data ingest with per-user licensing (based on New Relic’s published pricing).
- You are an early-stage or mid-sized team that benefits from the free tier during initial adoption before telemetry volume grows significantly.
- You want broad cloud and third-party integrations without managing backend infrastructure yourself.
Choose Dynatrace if:
Dynatrace is typically chosen by organizations that prioritize automation and enterprise-wide observability across very large environments.
- You operate at large enterprise scale with hundreds or thousands of services and want automated discovery, topology mapping, and AI-assisted root cause analysis.
- You prefer a single-agent model that minimizes manual instrumentation and configuration across hosts and platforms.
- You want AI-driven insights and automated problem detection tightly integrated into the observability platform (based on Dynatrace product positioning).
- You are comfortable with granular, usage-based pricing tied to memory, host hours, sessions, and data volume, and have processes in place to manage and forecast this spend.
- You need observability that spans applications, infrastructure, user experience, and security within one enterprise platform.
- You have dedicated platform or SRE teams that can manage and optimize a feature-rich observability setup over time.
Conclusion
New Relic, Dynatrace, and CubeAPM each address observability from different angles, reflecting trade-offs between automation, convenience, and control. Dynatrace emphasizes enterprise-scale automation and AI-driven insights, while New Relic focuses on SaaS simplicity and fast onboarding for full-stack visibility.
CubeAPM offers a self-hosted, OpenTelemetry-native approach that prioritizes predictable pricing, data ownership, and long-term retention. The right choice depends on how teams balance scale, cost behavior, operational ownership, and compliance needs.
As systems grow, evaluating how observability behaves under real production load is often more important than feature checklists alone.
Disclaimer: The information in this article reflects the latest details available at the time of publication and may change as technologies and products evolve.
FAQs
1. Can these platforms be used together during a migration?
Yes. Many teams run tools in parallel during transitions. CubeAPM supports OpenTelemetry and multiple agents, which can make phased migrations easier. New Relic and Dynatrace can also ingest OpenTelemetry data, allowing overlap during cutover periods.
2. How do these tools perform during major incidents or traffic spikes?
Behavior differs by platform. Dynatrace dynamically regulates trace capture using Adaptive Traffic Management. New Relic relies on usage-based ingest limits and sampling configurations. CubeAPM’s smart sampling and predictable ingestion model are designed to retain high-value signals even during spikes, based on product documentation and demo data.
3. Which option is better for long-term historical analysis?
CubeAPM is typically preferred for long-term analysis because it offers unlimited retention by default. Dynatrace and New Relic retain data for defined default periods, with longer retention requiring configuration or additional spend.
4. Do these platforms require re-instrumentation to switch later?
Not necessarily. All three support OpenTelemetry, which allows teams to standardize instrumentation and reduce rework when switching platforms. Proprietary agents may offer deeper integrations but can increase switching effort later.
5. How do these tools differ in data ownership and compliance models?
CubeAPM stores data inside the customer’s own environment, which can simplify data residency and compliance requirements. Dynatrace offers both SaaS and self-managed options. New Relic operates as a SaaS-only platform, with data processed in vendor-managed regions.


