The main difference between Grafana, Splunk AppDynamics, and CubeAPM is how each approaches observability depth, operational control, and cost efficiency across modern application environments.
Grafana is known for visualization and dashboards, and Splunk AppDynamics for deep enterprise APM, but both can become expensive and complex as scale increases. CubeAPM, on the other hand, offers predictable ingestion-based pricing and OpenTelemetry-native full-stack observability to help teams control costs.
In this comparison, we’ll break down how these three platforms differ across telemetry coverage, deployment, sampling, retention, support, and pricing.
Grafana vs Splunk AppDynamics vs CubeAPM Comparison
| Features | CubeAPM | Grafana | Splunk AppDynamics |
| Known For | OpenTelemetry-native full-stack platform | Visualization-first platform | Enterprise-grade APM and analytics |
| Multi-Agent Support | Yes (OTel, New Relic, Datadog, Elastic) | Partial(Prometheus, OTel) | Partial(Splunk OTel Collector) |
| MELT Support | Full MELT coverage | Full MELT coverage | Full MELT coverage |
| Setup | Self-hosted / BYOC (vendor-managed) | SaaS & Self-hosted | SaaS & Self-hosted |
| Pricing | Ingestion-based: $0.15/GB | Logs: $0.50/GB Traces: $0.50/GB Metrics: $0.05/GB | APM: $33/month/CPU core Infra: $6/month/CPU core |
| Sampling Strategy | Smart sampling ( 95 % compression) | Tail + Head-based | Tai + head-based + session-based |
| Log Retention | Infinite Retention (no extra cost) | Free Plan: 14 days Pro Plan: 30days-3 months | Default: 8 days |
| Support TAT | < 10 min avg TAT | 2hrs–6hrs | 2hrs to days |
Grafana vs SplunkAppDynamics vs CubeAPM: Feature-by-Feature Breakdown

Multiagent Support
CubeAPM: Designed for interoperability, CubeAPM supports multiple agents out of the box, including OpenTelemetry, Prometheus, Datadog, New Relic, and Elastic. This allows teams to migrate or combine existing observability pipelines without changing instrumentation or collectors.
Grafana: Grafana is not fully multi-agent. It supports interoperability at the collector layer through Grafana Alloy and the OpenTelemetry Collector, ingesting telemetry via standard protocols such as OTLP and Prometheus. However, it does not directly ingest or operate third-party commercial APM agents as first-class inputs.
Splunk AppDynamics: Supports multi-source ingestion through its OpenTelemetry Collector distribution, allowing OpenTelemetry-formatted telemetry to be sent via OTLP. It does not natively ingest or run other commercial APM agents directly.
MELT Support (Metrics, Events, Logs, Traces)

CubeAPM: CubeAPM delivers full MELT coverage in one backend, correlating metrics, logs, traces, and events automatically. This unified approach simplifies troubleshooting and gives a complete view of system performance.
Grafana: Grafana provides full MELT coverage, but users need to combine Loki for logs, Tempo for traces, and Mimir for metrics, which increases setup and storage complexity. While powerful for visualization, this modular architecture makes Grafana better suited for teams with strong internal DevOps resources to manage multiple telemetry pipelines.
Splunk AppDynamics: Supports full-stack observability across metrics, events, logs, and traces, with strong application-to-infrastructure correlation. It is best suited for enterprise environments that require deep APM and business transaction monitoring.
Deployment (Self-hosted / On-Prem)
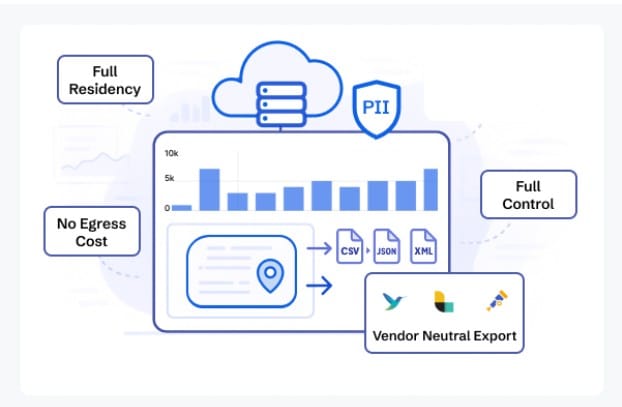
CubeAPM: CubeAPM can be deployed self-hosted inside your VPC or on-prem, giving teams complete control over data location and security. Despite being self-managed, it’s delivered as a vendor-managed SaaS experience—automated updates, scaling, and maintenance are handled for you. This hybrid approach ensures compliance while keeping data egress cost at zero.
Grafana: Grafana offers both cloud and self-hosted options. The self-managed LGTM (Loki, Grafana, Tempo, Mimir) stack provides full flexibility but requires ongoing infrastructure management and scaling. Grafana Cloud removes this overhead but stores data on Grafana’s infrastructure, which can add egress costs for teams.
Splunk AppDynamics: Offers both SaaS and self-hosted options. Its setup and operation are more complex, making it better suited for organizations with dedicated IT teams rather than fast-moving or mid-sized teams.
Pricing: Approximate Cost for Small, Medium & Large Teams
*Disclaimer: Pricing comparisons are based on standardized Small/Medium/Large team profiles defined in our internal benchmarking sheet. Actual costs may vary by usage, region, and plan. Please verify current pricing with each vendor.
An APM host is a host that is actively generating traces data and an Infra host is any physical or virtual OS instance that you monitor with any observability tool.
CubeAPM uses the simplest and most predictable cost structure among the three. It’s priced at $0.15 per GB ingested, applying uniformly across logs, metrics, and traces. Grafana Cloud separates billing per telemetry stream, while Splunk AppDynamics follows a host-based enterprise model that scales sharply with environment size. Here’s how the three compare for different team tiers.
Estimated Monthly Cost for Small Teams (~30 hosts):
- CubeAPM: $2,080/month
- Grafana Cloud: $3,870/month
- Splunk AppDynamics: $2,290/month
Estimated Monthly Cost for Mid-Sized Teams (~125 hosts):
- CubeAPM: $7,200/month
- Grafana Cloud: $11,875/month
- Splunk AppDynamics: $8,625/month
Estimated Monthly Cost for Large Teams (~250 hosts):
- CubeAPM: $15,200/month
- Grafana Cloud: $26,750/month
- Splunk AppDynamics: $17,770/month
Teams moving to CubeAPM consistently achieve 60–80% lower overall costs than Grafana or AppDynamics, thanks to a single ingestion rate and zero egress fees that remove billing surprises.
CubeAPM: Cost for Small, Medium, and Large Teams
CubeAPM’s pricing model covers logs, traces, metrics, and events under one rate, removing the complexity of user-based or retention-based fees. There are no add-ons, hidden usage tiers, or transfer charges, giving complete cost visibility from day one.
Pricing:$0.15 per GB ingested
Typical Monthly Cost:
- Small teams (~30 hosts): $2,080
- Mid-sized teams (~125 hosts): $7,200
- Large teams (~250 hosts): $15,200
This straightforward structure gives DevOps and SRE teams full budget control, especially in Kubernetes or hybrid setups where data volumes fluctuate daily.
Grafana Cloud: Cost for Small, Medium, and Large Teams
Grafana Cloud uses a modular billing model where each telemetry type is billed separately. Logs and traces are charged per gigabyte, while metrics and user licenses add incremental costs. It offers flexibility for smaller teams but grows expensive once multiple data sources are ingested simultaneously.
Pricing:
- Logs and Traces $0.50/GB
- Metrics $0.05/GB
- Pro Base $19/user/month
Typical Monthly Cost:
- Small teams (~30 hosts): ~$3,870
- Mid-sized teams (~125 hosts): ~$11,875
- Large teams (~250 hosts): ~$26,750
Splunk AppDynamics: Cost for Small, Medium, and Large Teams
Splunk AppDynamics applies a host-based enterprise pricing model that includes APM licensing and optional analytics modules. This approach works well for large organizations but quickly becomes costly for mid-sized deployments.
Pricing:
- Infra:$6/host/month
- Premium:$33/host/month
Typical Monthly Cost:
- Small teams (~30 hosts): $2,290
- Mid-sized teams (~125 hosts): $8,625
- Large teams (~250 hosts): $17,750
While AppDynamics offers deep performance insights, its layered pricing and enterprise SLAs make cost prediction complex, particularly for teams scaling fast across multiple clusters.
In overall transparency and scalability, CubeAPM delivers the best pricing-to-performance ratio. Its single ingestion rate, zero egress cost, and predictable monthly spend make it the most budget-stable option for modern observability deployments.
Sampling Strategy
CubeAPM: CubeAPM uses Smart Sampling, a context-aware mechanism that dynamically retains traces based on latency, errors, or anomalies. It achieves up to 95% compression, significantly cutting down ingestion volumes while keeping important transactions visible. This balance of cost and fidelity makes it ideal for high-traffic systems and microservice-heavy architectures.
Grafana: Supports both head-based and tail-based sampling through the OpenTelemetry Collector, with decisions made either at request start or after trace completion based on signals such as errors or latency.
Splunk AppDynamics: Supports multiple sampling strategies, including head-based, session-based, and tail-based sampling through OpenTelemetry, as well as session-based sampling for end-user monitoring. This allows teams to control data volume while preserving high-value traces and user sessions for analysis.
Data Retention

CubeAPM: CubeAPM provides unlimited retention by storing telemetry directly in the customer’s cloud environment, ensuring compliance and zero egress cost. Long-term retention allows teams to perform year-over-year trend analysis and meet audit requirements without paying for additional storage tiers. This is particularly useful for fintech, healthcare, and government workloads that require historical trace data.
Grafana: Enforces plan-based retention limits. The Free plan retains data for 14 days, while the Pro plan extends retention to 30 days, after which older data is automatically deleted. For many teams, this short window is sufficient for active monitoring but less ideal for long-term diagnostics.
Splunk AppDynamics: Applies a default data retention period of 8 days. Extended retention options of 30, 60, or 90 days can be configured and available as add-ons depending on data type.
Support Channel & TAT
CubeAPM: Provides direct Slack and WhatsApp access to core engineers with response times measured in minutes. This real-time collaboration model helps DevOps and SRE teams resolve incidents quickly without ticket delays.
Grafana: Provides plan-based support. The Free plan includes no formal SLA, while paid tiers offer 24/7 support with defined targets, including P1 responses within 2 business hours and P2 within 4 business hours. Enterprise plans improve these targets further, with P1 response times of up to 30 minutes and optional real-time troubleshooting.
Splunk AppDynamics: Support is tiered by plan. For P1 (critical) incidents, Standard support provides 24×7 availability with a 2-hour response time, while Premium support reduces P1 response time to 30 minutes. Premium plans also offer more frequent updates and faster workaround targets compared to Standard support.
Known For
CubeAPM: CubeAPM is known for being an OpenTelemetry-native, full-stack observability platform that delivers unified MELT coverage under one backend. With $0.15/GB predictable pricing, unlimited retention, and VPC or on-prem deployment options, it stands out for combining compliance, performance, and cost efficiency.
Grafana: Grafana is best known for its visualization-first approach and extensive plugin ecosystem. It excels at creating rich dashboards and integrating data from multiple sources, making it a go-to solution for DevOps teams using open-source telemetry. However, it requires managing multiple backends, which increases operational overhead.
Splunk AppDynamics: AppDynamics is recognized for deep application performance analytics under the Cisco ecosystem. It offers mature enterprise features for monitoring, troubleshooting, and business impact analysis. While powerful for large-scale operations, its high licensing costs and proprietary structure make it less accessible to smaller, agile teams.
Which Tool Is Best for You? Why Brands Choose CubeAPM
CubeAPM stands out as the most balanced observability platform—combining self-hosting flexibility, OpenTelemetry-native design, and predictable pricing under a single backend. While Grafana and Splunk AppDynamics deliver strong visualization and analytics, CubeAPM eliminates the trade-offs between control, compliance, and cost efficiency.
Benefits of Choosing CubeAPM
- Unified MELT Observability: Logs, metrics, events, and traces correlated in one backend.
- Multi-Agent Support: Works seamlessly with OpenTelemetry, Prometheus, Datadog, Elastic, and New Relic agents.
- Extensive API Access: Open APIs for automation, integrations, and custom dashboards.
- Predictable Pricing: Flat $0.15/GB ingestion model—no user, infra, or retention fees.
- Self-Hosted in Your VPC: Complete data residency and compliance control with zero egress costs.
- Smart Sampling Engine: 95% compression while preserving latency and error-driven traces.
- Real-Time Support: Direct Slack or WhatsApp access to engineers with minute-level response times.
- Unlimited Retention: Store all telemetry data indefinitely without hidden storage charges.
CubeAPM gives DevOps, SRE, and platform teams the observability freedom they expect from cloud SaaS—without surrendering data control or predictability.
Grafana vs SplunkAppDynamics vs CubeAPM: Use Cases
Choose CubeAPM if
- You want a single, full-stack observability platform with metrics, logs, events, and traces unified out of the box.
- Predictable, ingestion-based pricing and infinite retention matter more than tiered limits or add-ons.
- You need true interoperability with multiple agents (OpenTelemetry, Prometheus, Datadog, New Relic, Elastic) without changing existing pipelines.
- You prefer fast setup, minimal operational overhead, and ownership of your telemetry data.
Choose Grafana if
- Visualization and dashboards are your primary priority across multiple data sources.
- You already use Prometheus, Loki, Tempo, or OpenTelemetry and are comfortable managing collectors and exporters.
- You want flexibility to combine open-source components with a managed cloud offering.
- Short retention windows are acceptable, or long-term data is stored externally.
Choose Splunk AppDynamics if
- You run large-scale or enterprise environments that require deep APM and business transaction monitoring.
- Strong correlation between application performance and infrastructure is critical.
- You have a dedicated platform or IT teams to manage a more complex deployment.
- Enterprise-grade support SLAs, including fast P1 response times, are a key requirement.
Conclusion
Grafana and Splunk AppDynamics deliver strong visualization and enterprise analytics, but come with scaling costs and a complex pricing model.
CubeAPM removes these trade-offs by unifying observability under one OpenTelemetry-native backend with predictable pricing and full data control inside your VPC.
For teams seeking long-term retention, 800+ integrations, and instant visibility without layered billing, CubeAPM offers the simplest path to complete observability. Start your free trial or request a demo today.
Disclaimer: The information in this article reflects the latest details available at the time of publication and may change as technologies and products evolve.
FAQs
1. What is the main difference between Grafana, Splunk, AppDynamics, and CubeAPM?
Grafana focuses on visualization, Splunk AppDynamics targets enterprise APM and analytics, while CubeAPM delivers full-stack observability with OpenTelemetry support, predictable pricing, and self-hosting options inside your VPC.
2. Why do teams switch from Grafana or AppDynamics to CubeAPM?
Teams move to CubeAPM to reduce cost complexity, gain unlimited data retention, and maintain data residency. It offers 800+ integrations and runs entirely within your own cloud environment, removing compliance risks.
3. Does CubeAPM require agents to collect telemetry?
No, CubeAPM is agent-agnostic and supports OpenTelemetry, Prometheus, Datadog, and New Relic agents out of the box, simplifying migration from existing stacks.
4. Which tool is best for enterprises with strict compliance needs?
Enterprises handling sensitive or regulated data benefit most from CubeAPM, as it can be deployed inside private VPCs or on-prem environments with zero egress cost and complete data control.
5. What kind of support does CubeAPM provide?
CubeAPM offers real-time Slack and WhatsApp access to engineers, ensuring minute-level response times and faster issue resolution compared to ticket-based systems used by legacy APM vendors.


