The main difference between Grafana, Coralogix, and CubeAPM lies in how each platform handles data flow, deployment, and cost control. Grafana provides a flexible, modular observability stack that teams can self-host or consume as SaaS. Coralogix uses its Streama architecture, TCO Optimizer, and tiered pipelines to process data in-stream and reduce indexing costs. CubeAPM offers a unified OpenTelemetry-native backend with predictable ingestion pricing and optional self-hosting, making it the simplest and most affordable option at scale.
As systems expand across microservices and regions, teams often face a difficult trade-off: cloud platforms like Coralogix offer predictable, easy-to-understand pricing and fast onboarding, though costs raise with data growth. On the other hand Grafana provide flexibility but require ongoing maintenance, upgrades, and tuning.
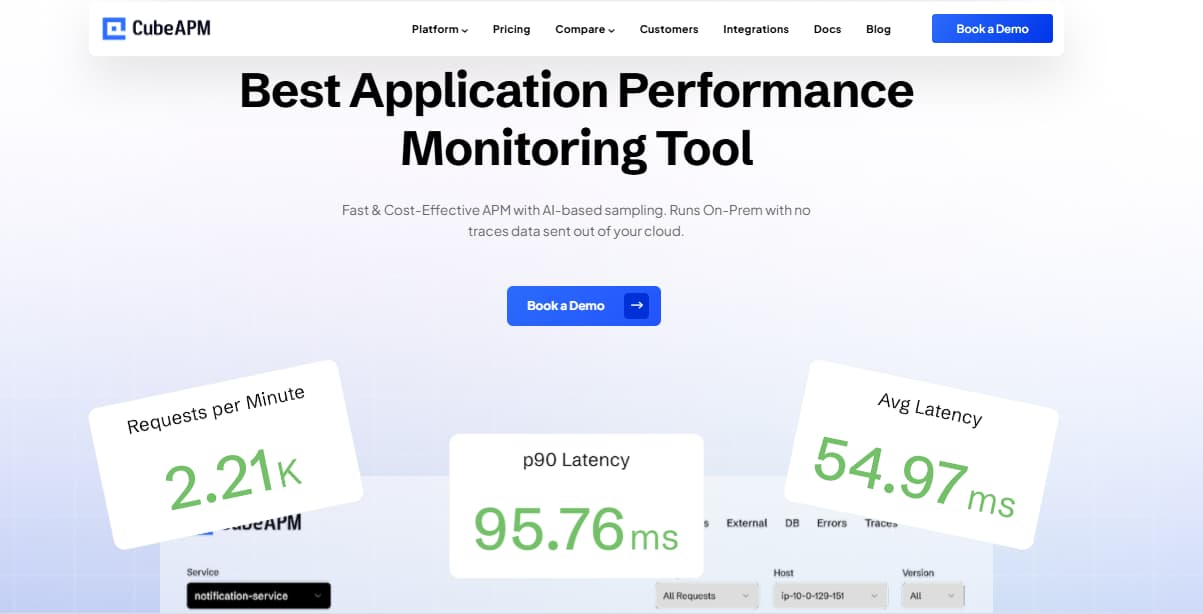
CubeAPM bridges this gap by delivering a self-hosted model with predictable costs and none of the operational overhead. It’s an OpenTelemetry-native, full-stack MELT platform that runs inside your own VPC but is vendor-managed. With smart sampling (≈95 % compression), unlimited retention, and predictable $0.15 / GB ingestion pricing, teams cut observability spend by up to 50% while keeping complete data control and achieving faster MTTR.
Grafana vs Coralogix vs CubeAPM Comparison
| Features | CubeAPM | Grafana | Coralogix |
| Multi-Agent Support | Yes (OTel, New Relic, Datadog, Elastic) | Partial(Not full multi-agent) | Yes(OTel, Prometheus) |
| MELT Support | Full MELT coverage | Full MELT coverage | Full MELT coverage |
| Setup | Self-hosted but vendor-managed | SaaS and Self-hosted | SaaS only |
| Pricing | Ingestion-based pricing of $0.15/GB for logs & traces | Pro Plan: $19/month + usage Logs: $0.50/GB Traces: $0.50/GB APM: $0.04/host/hour | Logs: $0.42/GB Traces: $0.16/GB Metrics: $0.05/GB AI: 1.5 per 1M tokens |
| Sampling Strategy | Smart sampling ( 95 % compression + context-aware retention) | Tail + Head-based sampling | Head-based + Tail-based + Conditional Error Sampling |
| Log Retention | Infinite Retention (no extra cost) | Free Plan: 15-day retention Pro Plan: 30-day retention | Infinite retention |
| Support Channel & TAT & Pricing | Slack +Email + WhatsApp direct to core engineers (< 10 min avg TAT) | Community + ticketed support (2hrs to 6hrs) | In-App Support Chat + Email(within minutes avg TAT) |
| Known for | OpenTelemetry-native full-stack observability + predictable pricing | Industry-leading visualization and dashboards that unify metrics, logs, and traces from any data source. | In-stream telemetry processing and cost-efficient archiving powered by its Streama™ architecture. |
Grafana vs Coralogix vs CubeAPM: Feature-by-Feature Breakdown
Multi-Agent Support
CubeAPM: Supports multiple agents out of the box including OpenTelemetry, Datadog, New Relic, Elastic, and Prometheus. For log-ingestion, it has integrations with data collectors and log processors like Logstash, FluentD, FluentBit, Filebeat and others. This makes it ideal for hybrid and migration use cases where teams gradually transition from legacy APMs to an OpenTelemetry-native setup.
Grafana: Supports OpenTelemetry and Prometheus collectors, but deeper integration often depends on configuring Loki, Tempo, and Mimir individually, which increases setup complexity.
Coralogix: Ingests telemetry via OpenTelemetry, Prometheus and few other agents as well. For log-ingestion, it has integrations with wide variety of log management tools like FluentD, FluentBit and others.
MELT Support (Metrics, Events, Logs & Traces)
CubeAPM: Delivers full-stack MELT coverage in a single backend — metrics, events, logs, and traces are correlated automatically. This unified view helps teams cut mean-time-to-resolution (MTTR) by up to 40% and achieve true full-stack visibility across microservices.
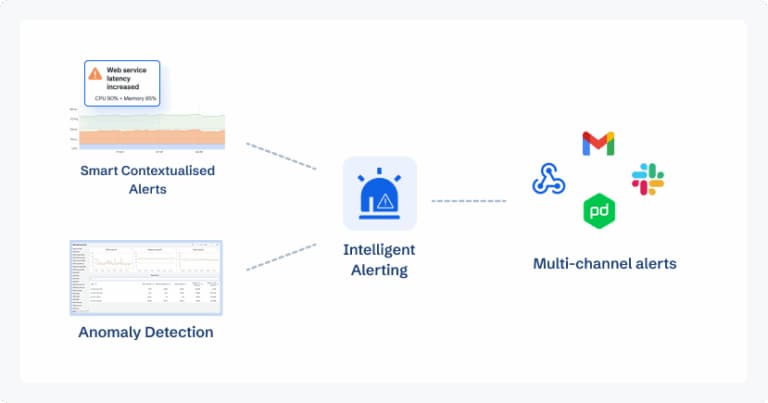
Grafana: Delivers full MELT observability through its LGTM stack (Loki for logs, Tempo for traces, Mimir/Prometheus for metrics, and Grafana Alerting for events). While it’s excellent for visualization and dashboards, configuring the LGTM stack can feel complex. New users often need time to understand the integrations, data sources, and backend setup required to get the most out of the platform.
Coralogix: Offers comprehensive MELT capabilities with a per-data-type pricing model for logs, traces, metrics, and AI features, with total spend depending on telemetry volume and usage patterns.
Setup and Deployment

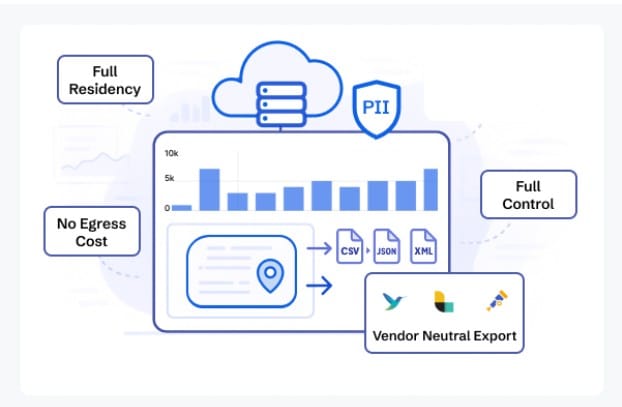
CubeAPM: Runs fully self-hosted inside your VPC or on-prem, giving teams complete data ownership. It behaves like SaaS — with automated scaling, upgrades, and patches — but without sending telemetry outside your environment.
Grafana: Can be deployed as a SaaS or self-hosted, but self-management demands significant infrastructure and tuning. Cloud hosting simplifies setup but stores telemetry outside your environment.
Coralogix: Cloud-managed observability with real-time indexing for priority data, and optional S3 archiving for lower-priority logs and traces through TCO Optimizer helping reduce storage costs but still requiring cloud-based data routing incurring costs.
Pricing and Cost for Different Team Sizes
*Disclaimer: Pricing comparisons are based on standardized Small/Medium/Large team profiles defined in our internal benchmarking sheet. Actual costs may vary by usage, region, and plan. Please verify current pricing with each vendor.
An APM host is a host that is actively generating traces data and an Infra host is any physical or virtual OS instance that you monitor with any observability tool.
CubeAPM offers the most predictable cost model at $0.15/GB ingestion — flat, transparent, and unified across all telemetry types. Here is a simple cost breakdown for small, medium, and large teams:
Cost for Small Teams (~30 hosts):
- CubeAPM: $2,080/month
- Grafana: ~$3,870/month
- Coralogix: ~$4,090/month
Cost for Mid-Sized Teams (~125 hosts):
- CubeAPM: $7,200/month
- Grafana: ~$11,875/month
- Coralogix: ~$13,200/month
Cost for Large Teams (~250 hosts):
- CubeAPM: $15,200/month
- Grafana: ~$26,750/month
- Coralogix: ~$29,000/month
Teams migrating to CubeAPM typically see 40–50% lower total cost of ownership compared to modular Grafana Cloud and Coralogix’s per-stream billing.
CubeAPM: Cost for Small, Medium, and Large Teams
CubeAPM keeps pricing simple — $0.15 per GB of data ingested, covering all telemetry types (logs, metrics, traces, and events). There are no user license fees, no hidden infrastructure costs and no retention limits. This transparent model makes CubeAPM ideal for teams that want predictable budgets without paying extra for scale or compliance.
CubeAPM Pricing
- Flat pricing of $0.15/GB ingested
Estimated Monthly Costs
- Small teams (~30 hosts): $2,080
- Mid-sized teams (~125 hosts): $7,200
- Large teams (~250 hosts): $15,200
Teams migrating from legacy APMs or cloud-hosted observability tools typically save 40–50% on total observability spend, while gaining complete data ownership inside their own VPC or on-prem setup.
Grafana Cloud: Cost for Small, Medium, and Large Teams
*Disclaimer: Pricing comparisons are based on standardized Small/Medium/Large team profiles defined in our internal benchmarking sheet. Actual costs may vary by usage, region, and plan. Please verify current pricing with each vendor.
Grafana follows a modular pricing approach where each service is billed separately — Grafana Cloud Pro ($19/month), Logs ($0.50/GB), and Traces ($0.50/GB). This flexibility works well for small or static workloads, but costs rise steeply as telemetry grows since every data stream adds to the bill.
Grafana Cloud Pricing
- Logs: $0.50/GB ingested
- Traces: $0.50/GB ingested
- Pro Plan Base: $19/month
- Retention: 13 months (Pro tier)
- Support: Community + paid enterprise SLAs
Estimated Monthly Costs
- Small teams (~30 hosts): $3,870
- Mid-sized teams (~125 hosts): $11,875
- Large teams (~250 hosts): $26,750
Grafana’s modular model offers great flexibility but becomes harder to control beyond a few terabytes of ingestion. It’s best suited for teams that prioritize visualization and dashboarding over end-to-end observability.
Coralogix: Cost for Small, Medium, and Large Teams
*Disclaimer: Pricing comparisons are based on standardized Small/Medium/Large team profiles defined in our internal benchmarking sheet. Actual costs may vary by usage, region, and plan. Please verify current pricing with each vendor.”
Coralogix uses a pipeline-based pricing model that routes telemetry into search, monitoring, or archive tiers. This offers flexible optimization, with logs, traces, metrics, and AI features priced separately so total cost scales based on actual data usage.
Coralogix Pricing
- Logs: $0.42/GB ingested
- Traces: $0.16/GB ingested
- Metrics: $0.05/GB ingested
- AI Features: $1.5 per 1M tokens
- Retention: 365 days (Essential plan)
- Support: Tiered SLA-based
Estimated Monthly Costs
- Small teams (~30 hosts): $4,090
- Mid-sized teams (~125 hosts): $13,200
- Large teams (~250 hosts): $29,000
Sampling Strategy
CubeAPM: uses Smart Sampling — context-aware retention that preserves latency , error, and anomaly traces while compressing redundant data by up to 95%. This helps maintain accuracy while controlling cost and storage.
Grafana: Supports both head-based and tail-based sampling via the OpenTelemetry collector (or Grafana Alloy). With head sampling, traces are sampled upfront at the start of a request; with tail sampling, the backend buffers full traces and then applies policies (e.g. error status, latency thresholds, identifiers) to decide which traces to keep.
Coralogix: Supports head-based, tail-based sampling for distributed traces and conditional error sampling for RUM. Tail sampling lets Coralogix retain important traces such as errors or high-latency requests after evaluating the full trace, while conditional error sampling captures all error sessions and only samples a percentage of normal sessions.
Data Retention
CubeAPM: Provides unlimited log and trace retention with zero additional storage fees — all data stays within your own cloud or data center.
Grafana Cloud: Retention depends on the plan. On Grafana Cloud, the free tier gives 14 days retention for metrics, logs, and traces, while Pro plan gives 3 months retention for metrics; 30 days retention for logs, traces, profiles, & k6 performance tests. The Enterprise plan has custom retention.
Coralogix: Supports long-term retention by archiving logs, traces, and metrics to your own cloud storage bucket. Retention is effectively unlimited, as you can store as much history as your bucket allows. However, you still incur the data-out cost (charged by your cloud provider like AWS) because you first send your telemetry data out from your cloud to Coralogix cloud.
Support and Response Time

CubeAPM: Provides real-time support through Slack and WhatsApp directly with core engineers — average response time under 5 minutes, ensuring quick issue resolution during incidents.
Grafana: Support varies by plan. The Free tier offers only community-level assistance with no guaranteed response time, often resulting in multi-day delays. Pro and Enterprise tiers include formal with response ranging between 2 business hours to 6 business hours.
Coralogix: Support is available through in-app chat and email, with a guaranteed first response within 5 minutes for incoming requests. Customers can open support cases 24/7, and Coralogix provides assistance through a dedicated support user created within the customer’s account for audit transparency and secure collaboration.
Which Tool Is Best for You? Why Brands Choose CubeAPM
Benefits of Choosing CubeAPM

- Predictable Pricing: A flat $0.15/GB ingestion rate across all telemetry types — no surprise bills, no user or feature fees.
- Unlimited Data Retention: Store metrics, traces, and logs indefinitely without paying extra for long-term storage.
- Smart Sampling Efficiency: Retain all critical latency and error data while achieving up to 95% compression, keeping costs low.
- Self-Hosted, Managed Like SaaS: Deploy inside your own VPC or on-prem for full data control — CubeAPM handles scaling, upgrades, and security patches.
- Unified MELT Coverage: One backend for Metrics, Events, Logs, and Traces, eliminating the need for multiple disconnected tools.
- Multi-Agent Compatibility: Seamless integration with OpenTelemetry, Datadog, New Relic, Elastic, and Prometheus agents.
- Real-Time Support: 24×7 Slack and WhatsApp access to CubeAPM engineers with sub-10-minute response time.
- API access: Access all your data via APIs without any additional cost.
Grafana vs Coralogix vs CubeAPM: Use Cases
Choose CubeAPM if
You want end-to-end observability without losing data control, retention, or cost predictability. CubeAPM combines the simplicity of SaaS with the sovereignty of on-prem — running inside your own VPC but managed entirely by CubeAPM. It’s ideal for SREs, DevOps, and platform teams running Kubernetes, microservices, or hybrid-cloud environments.
It’s best suited for teams that:
- Need OpenTelemetry-native MELT coverage (Metrics, Events, Logs, Traces) in one backend.
- Operate in regulated industries or regions requiring compliance.
- Want predictable pricing ($0.15/GB) and unlimited retention without host-based billing.
- Are consolidating multiple observability tools (like Datadog, Grafana, or Coralogix) into one unified solution.
CubeAPM is the go-to choice for teams seeking faster MTTR, full data ownership, and 50% lower total observability cost compared to legacy APMs or fragmented stacks
Choose Grafana if
You already use Prometheus, Loki, or Tempo and need a centralized visualization layer to build dashboards across metrics and logs. Grafana is perfect for DevOps teams managing self-hosted observability stacks who value flexibility and open-source customization.
It’s best suited for teams that:
- Want to visualize time-series data and metrics from multiple sources.
- Already maintain their own infrastructure and collectors.
- Prioritize dashboards and alerting.
Grafana is a solid choice for small to mid-sized organizations that can handle operational overhead and prefer open-source flexibility.
Choose Coralogix if
You want a fully managed SaaS observability platform that eliminates the need to run your own backend. Coralogix is a strong fit for teams that prefer cloud-hosted tooling and benefit from its streaming analytics engine, fast querying, AI-assisted insights, and pricing optimization features such as TCO Optimizer for predictable budgeting.
It’s best suited for teams that:
- You benefit from a streaming-first (Streama) architecture, which processes logs, metrics, and traces in-stream for fast correlation
- You need TCO Optimizer and tiered pipelines to route high-value data to hot storage and push lower-value data to cheaper archival storage.
- You prefer usage-based per-GB pricing that scales with ingestion volume rather than per-host or per-feature licensing.
Coralogix is ideal for SaaS companies, digital-native teams, and organizations prioritizing ease of use, and automated intelligence.
Conclusion
Both Grafana and Coralogix bring unique strengths to the observability landscape — Grafana offers deep visualization flexibility for open-source stacks, while Coralogix delivers powerful AI-driven log analytics through a fully managed SaaS platform.
However, both have considerations. Grafana adds operational effort as deployments expand, while Coralogix’s per-stream billing can scale with the amount of data processed.
CubeAPM removes those limits. It runs inside your VPC or on-prem, offers unlimited retention, and uses predictable $0.15/GB ingestion pricing with smart sampling and real-time support. For teams seeking full-stack observability, data sovereignty, and simplified scaling, CubeAPM stands as the most complete and future-ready choice.
Disclaimer: The information in this article reflects the latest details available at the time of publication and may change as technologies and products evolve.
FAQs
1. Which platform offers full-stack observability?
CubeAPM provides full MELT coverage — Metrics, Events, Logs, and Traces — in a single backend. Grafana requires separate components like Loki, Tempo, and Mimir, while Coralogix also delivers full-stack observability.
2. Which tool is more cost-effective for growing teams?
Based on verified pricing data, CubeAPM is the most predictable option at $0.15/GB of ingested data, including all telemetry types. Grafana and Coralogix both charge separately for logs, metrics, and traces, which increases costs as data volume grows.
3. Can these platforms be self-hosted?
CubeAPM can be fully deployed inside your own VPC or on-premise, ensuring total data control. Grafana supports self-hosting through its open-source edition, while Coralogix is cloud-only and does not offer on-prem deployment.
4. Which platform is better for AI-driven log analysis?
Coralogix leads in AI-based log analytics and pattern detection through its pipeline architecture. However, teams that require the same level of insight with data localization and unlimited retention often prefer CubeAPM’s OpenTelemetry-native design.
5. Why do enterprises switch to CubeAPM?
Enterprises choose CubeAPM for its SaaS-managed, self-hosted model, which combines unlimited data retention, 95% smart sampling compression, and real-time Slack/WhatsApp support. It offers full-stack observability without surging costs.


