The main difference between Better Stack, New Relic, and CubeAPM is the level of observability maturity each platform is designed to support.
Better Stack focuses on lightweight uptime monitoring, incident response, and log visibility. New Relic is a SaaS-first, full-stack observability platform built for fast onboarding and broad coverage. CubeAPM is a self-hosted, OpenTelemetry-native observability platform designed for predictable cost, data control, and deep system visibility at scale.
As services grow, many teams start re-evaluating observability to control cost and meet compliance. This article breaks down Better Stack vs New Relic vs CubeAPM across architecture, pricing behavior, deployment models, and real-world use cases.
Sumo Logic vs New Relic vs CubeAPM Comparison
Teams typically start comparing platforms like Better Stack and New Relic after production scale when telemetry volume grows faster than traffic, costs fluctuate month to month, and debugging depends on whether sampling or retention hides critical context.
| Feature | CubeAPM | Better Stack | New Relic |
| Known for | Unified MELT, native OTEL, self-hosting, cost predictability | Developer-friendly dashboards, uptime & incident monitoring | Full-stack APM with advanced analytics and service maps |
| Multi-Agent Support | Yes (OTel, New Relic, Datadog, Elastic, etc.) | Limited (Logtail agent, OTel, 3rd-party APIs) | Yes ( New Relic Agent, OTel, Prometheus) |
| MELT Support | Full MELT coverage | MELT Coverage | Full MELT coverage |
| Deployment | Self-hosted with vendor-managed | SaaS-only | SaaS-only |
| Pricing | Ingestion-based: $0.15/GB | Free; Paid: $29/user month; Logs & traces: $0.10-$0.35 per GB | Free 100 GB/month; beyond: $0.40/GB. User-based license: $49-$349 per user |
| Sampling Strategy | Smart sampling, automated, context-aware | User-configured log sampling; not built-in | Adaptive head-based & tail-based |
| Data Retention | Unlimited Retention (no extra cost) | Free; 3-30 days; Paid: 30d for logs, 13m for metrics | 30d for logs/events (120d in Data Plus); add-on retention |
| Support Channel & TAT | Slack, WhatsApp; response in minutes | Within hours | Community, docs, ticket; TAT: 2d to 2 hrs, 1 hr (priority) |
Better Stack vs New Relic vs CubeAPM: Feature Breakdown
Below is a feature-by-feature breakdown explaining how Better Stack, New Relic, and CubeAPM differ in practice. Each section focuses on what teams actually experience when using these platforms, based on their official websites and documentation.
Known for
CubeAPM is known for unified MELT observability built natively on OpenTelemetry, with a strong emphasis on infrastructure ownership and cost predictability. Its core positioning is observability as controlled infrastructure, where teams retain control over data location, retention, and ingestion costs while still getting full-stack visibility across metrics, events, logs, and traces.
Better Stack is known for developer-friendly dashboards, uptime monitoring, and incident management. The platform prioritizes fast onboarding, clear alerts, and operational simplicity, making it attractive for teams that want quick visibility into availability and logs without managing a complex observability stack.
New Relic is known as a full-stack APM platform with advanced analytics, service maps, and a broad SaaS ecosystem. It is positioned for organizations that want a single, fully managed observability platform with deep instrumentation, rich visualizations, and extensive integrations across cloud and application services.
Multi-Agent Support
When engineering teams talk about multi-agent support, they mean the ability to ingest telemetry from a variety of instrumentation sources without being locked into a single proprietary agent.
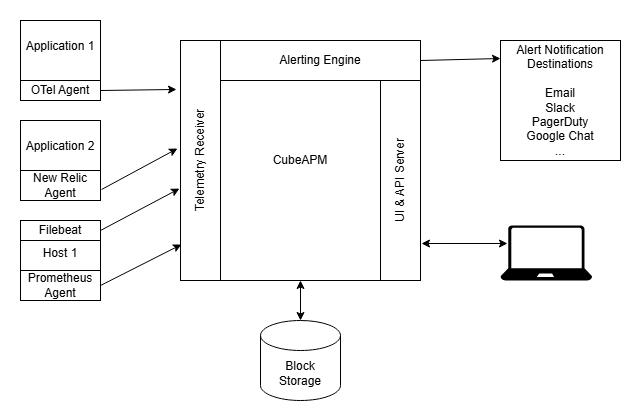
CubeAPM: CubeAPM is designed to accept telemetry from many different agents and formats out of the box. According to its official website and documentation, CubeAPM supports multiple agents including OpenTelemetry, New Relic, Datadog, Elastic, Prometheus, and more, allowing teams to ingest existing instrumentation or run heterogeneous observability pipelines without re-instrumenting their applications. This makes it easier to migrate from other tools or to operate mixed ecosystems.
Better Stack: Better Stack uses its own pipeline, primarily built around the Logtail agent, the Better Stack collector, and OpenTelemetry collector configurations. Official docs show that you can send logs, traces, and metrics to Better Stack using the OpenTelemetry collector or the Better Stack collector and forwarders like Vector, Fluent Bit, or HTTP APIs.
New Relic: New Relic supports its own proprietary New Relic agents for applications, as well as OpenTelemetry SDKs and collectors. It’s official OpenTelemetry docs state that you can export telemetry via OTLP into New Relic while also maintaining existing New Relic agent instrumentation. This lets teams mix agent choices depending on workload and migration strategy.
MELT support
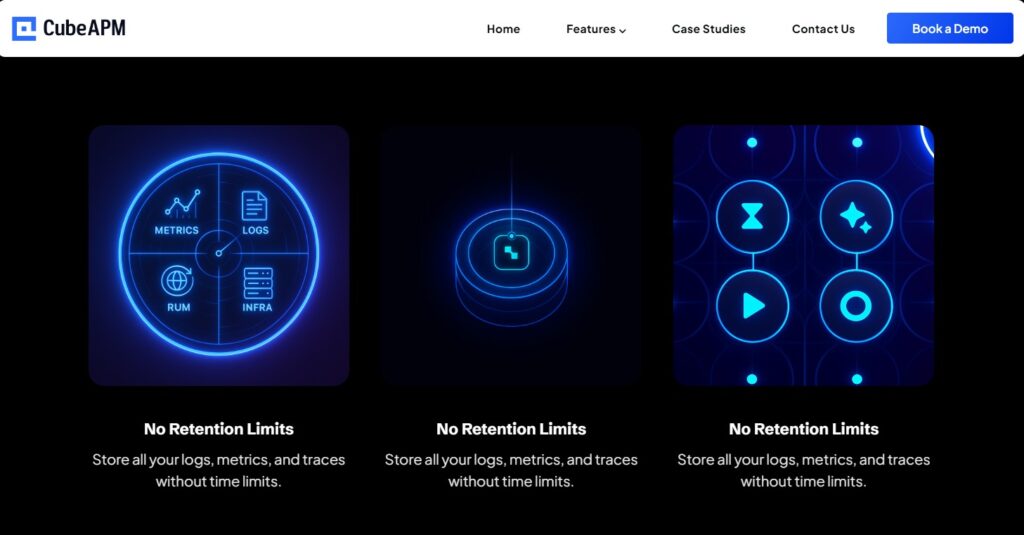
CubeAPM: Full MELT coverage is supported, meaning metrics, events, logs, and traces are ingested and correlated in a single platform. CubeAPM offers unified handling of all four signal types with OpenTelemetry as the default ingestion path, allowing engineers to move between traces, logs, metrics, and events during debugging without switching tools.
Better Stack: The platform supports logs, metrics, and traces, with documented workflows for correlating traces with logs and metrics using trace identifiers. Better Stack’s official documentation and product pages focus on these three signals in the context of uptime monitoring, incident response, and operational visibility. Events are not documented as a separate, first-class telemetry type in the same way as in full MELT platforms, based on Better Stack’s own tracing and logging documentation.
New Relic: Full MELT support is explicitly documented. New Relic’s official documentation defines metrics, events, logs, and traces as core data types used across its platform, including dashboards, querying, alerting, and service maps. These signals are treated as first-class primitives and are designed to be analyzed together within New Relic’s SaaS platform.
Deployment
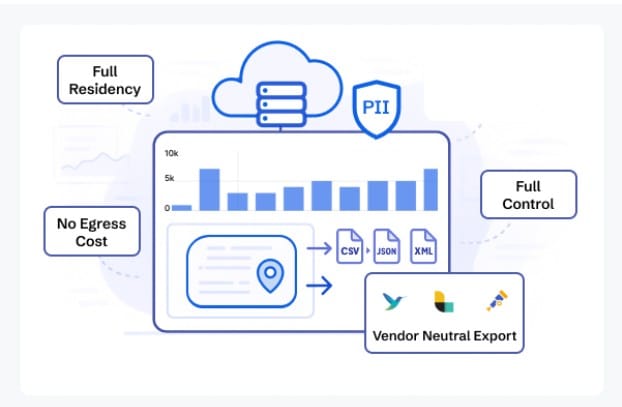
CubeAPM: CubeAPM is deployed as a self hosted platform with vendor managed operations. According to its official website and documentation, telemetry ingestion, processing, and storage run inside customer controlled infrastructure or a dedicated VPC, while CubeAPM handles upgrades and maintenance. This deployment model is commonly used by teams with data residency, compliance, or security requirements who still want a managed observability experience.
Better Stack: Better Stack is offered as a SaaS only platform. Its official documentation describes a hosted service where logs, metrics, traces, uptime checks, and incident management are operated entirely by Better Stack. Customers can choose from supported regions, but they cannot self-host or deploy Better Stack within their own infrastructure.
New Relic: New Relic is also delivered as a fully managed SaaS platform. Official New Relic documentation states that telemetry data is collected via agents or OpenTelemetry and processed in New Relic managed environments. While New Relic provides data residency options by region, it does not support customer managed or fully self-hosted deployments.
Pricing for Small, Mid, and Large Teams
To summarize the pricing:
*All pricing comparisons are calculated using standardized Small/Medium/Large team profiles defined in our internal benchmarking sheet, based on fixed log, metrics, trace, and retention assumptions. Actual pricing may vary by usage, region, and plan structure. Please confirm current pricing with each vendor.
| Approx. cost for teams (size) | Small (~30) | Mid-Sized (~125) | Large (~250) |
| CubeAPM | $2,080 | $7,200 | $15,200 |
| New Relic | $7,896 | $25,990 | $57,970 |
| Better Stack | $5,723 | $20,550 | $43,350 |
CubeAPM Costs in Detail
CubeAPM: CubeAPM uses ingestion based pricing at a flat rate of $0.15 per GB. According to CubeAPM’s official pricing pages and documentation, this model applies uniformly across telemetry types and does not introduce separate charges for users, hosts, or retention tiers. The intent is to keep observability costs predictable as data volume grows, with retention limited only by underlying storage rather than plan-level constraints. Cost for various team sizes:
- Small teams (~ 30): $2,080
- Mid-sized teams (~ 125): $7,200
- Large teams (~250): $15,200
New Relic Cost in Detail
New Relic: New Relic provides a free allowance of 100 GB per month, after which data ingestion is priced at $0.40 per GB. In addition, New Relic applies user based licensing, with prices ranging from $49 to $349 per user depending on role and plan. These pricing components are documented on New Relic’s official pricing and billing pages and can vary based on data volume, feature tier, and retention add ons. Cost for various team sizes:
- Small teams: $7,896
- Mid-size teams: $25,990
- Large teams: $57,970
Better Stack Cost in Detail
Better Stack: Better Stack offers a free tier and paid plans that start with per user pricing, alongside usage based charges for telemetry ingestion. Official pricing pages show paid plans starting at $29 per user per month, with logs and traces billed separately in the range of approximately $0.10 to $0.35 per GB depending on usage and plan. Pricing is usage driven and varies by signal type, as described on Better Stack’s own pricing and product pages.
- Small teams: $5,723
- Mid-size teams: $20,550
- Large teams: $43,350
Teams typically start noticing these cost differences once telemetry volume increases beyond early stage usage, especially in environments with sustained traffic, high cardinality logs, or multiple microservices. At this stage, observability spend often shifts from a fixed tooling cost to a variable expense that requires closer monitoring and forecasting.
Sampling Strategy

CubeAPM: CubeAPM supports smart sampling that is fully automated and context-aware. Sampling decisions are made after sufficient context is available, prioritizing error traces, high latency paths, and anomalous behavior rather than fixed percentages. This approach is designed to preserve diagnostically important data while controlling ingestion volume, without requiring users to manually tune sampling rules.
Better Stack: Better Stack does not provide a built-in, platform-level sampling engine for telemetry. Its official documentation and community guides explain that sampling, particularly for logs, is user-configured and applied at the application or collector level. Better Stack recommends standard techniques such as random, time-based, or hash-based log sampling to reduce ingestion volume, but these controls are implemented before data reaches the platform rather than being automatically managed by Better Stack itself.
New Relic: New Relic supports both adaptive head-based sampling through its APM agents and tail-based sampling via Infinite Tracing or OpenTelemetry pipelines. Official documentation describes how sampling can be configured to balance data volume and visibility, with tail-based sampling allowing teams to retain traces based on outcome or performance characteristics after execution.
Data retention
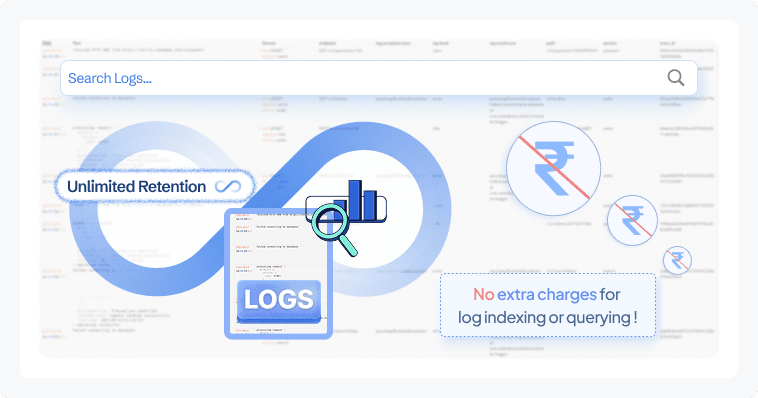
CubeAPM: CubeAPM supports unlimited data retention without additional platform-level charges, according to its official website and documentation. Retention is governed by the underlying storage configured by the customer rather than by plan-based limits, which allows teams to keep historical telemetry for audits, long-term trend analysis, or post-incident reviews as long as storage is available.
Better Stack: Better Stack applies retention limits that vary by plan and data type. Official pricing and documentation indicate that free plans retain logs for a short period (3 days for logs and 30 days for metrics and events). Paid plans or telemetry bundle plans typically retain logs for around 30 days and metrics for up to 13 months.
New Relic: New Relic enforces retention limits by data type and subscription tier. According to New Relic’s official documentation, logs and events are retained for 30 days by default, extended up to 120 days under Data Plus plans, with longer retention available through additional paid add-ons.
Support Channel and TAT
CubeAPM: According to CubeAPM’s official website and product pages, support is provided through direct messaging channels such as Slack and WhatsApp, with customers connected to engineers for real-time assistance. CubeAPM positions this support to deliver responses in minutes as part of standard support for active customers rather than through ticket queues.
Better Stack: Better Stack’s official support page states that you can reach the team via email at [email protected] and that they will normally reply “within a few hours.” This is the only numeric timeframe officially published on Better Stack’s Help & Support page, and there is no separate SLA matrix or guaranteed timing for paid vs free tiers documented publicly.
New Relic: New Relic publishes support response targets in its Global Technical Support offerings documentation. For paid customers on the usage-based pricing support plan, first response targets vary by plan level and severity, such as:
- Enterprise (P1 critical issues): ~1 hour
- Pro (P1): ~2 hours
- Standard (P1): ~2 business days
For lower priority issues (P2-P4), response times span from hours to 2 business days, depending on plan level. These targets are explicitly documented in New Relic’s official support plan tables, showing how response expectations change with subscription level.
How Teams Evaluate These Platforms at Scale
As observability moves from a developer convenience to critical infrastructure, decisions about platforms like CubeAPM, Better Stack, and New Relic are rarely made by a single person or based on feature checklists alone.
Who is Involved in the Decision Making
- Engineering teams typically lead the technical evaluation. They focus on trace depth, signal correlation, ease of instrumentation, and how quickly issues can be diagnosed across services.
- Finance teams become involved once telemetry volume grows, evaluating how pricing scales, how predictable monthly spend is, and whether costs can be forecast reliably.
- Security and compliance teams assess where telemetry data is stored, who has access to it, and whether the deployment model aligns with data residency or regulatory requirements.
What Questions Block Decisions
Common blockers include:
- How costs behave as log volume and trace cardinality increase
- Whether OpenTelemetry can be used without vendor lock-in
- How long the data can be retained without additional charges, and
- Whether the platform can run in a controlled environment or must be SaaS only
Teams also question how much operational overhead is introduced by sampling configuration, agent management, or migration from existing tools.
Why Comparisons Alone Are Not Enough
At a small scale, side-by-side comparisons of features and pricing often appear sufficient.
At a larger scale, teams discover that real-world factors like cost variability, retention limits, deployment constraints, and operational workflows matter more than individual features. As observability data grows alongside traffic and microservices, platform decisions increasingly hinge on long term ownership, cost control, and alignment with organizational governance, rather than on dashboards or integrations alone.
Better Stack vs New Relic vs CubeAPM: Use cases
Different teams choose different observability platforms depending on scale, architecture, and operational priorities. Below are common, real-world use cases where each tool tends to fit best, based on official documentation, product positioning, and observed customer patterns.
Choose CubeAPM if:
CubeAPM is typically chosen by teams that view observability as long-term infrastructure rather than a short-term SaaS add-on. It fits environments where control, predictability, and depth matter more than quick setup.
- You need full-stack observability with unified MELT across metrics, events, logs, and traces, with strong correlation for debugging complex distributed systems.
- You operate in strict data residency or compliance environments and require a self-hosted or VPC-controlled deployment model, based on CubeAPM’s documented deployment approach.
- You want an OpenTelemetry-native platform that works with existing OpenTelemetry, New Relic, Datadog, or Elastic agents, allowing gradual migration without re-instrumentation.
- You are running microservices or Kubernetes architectures and need end-to-end tracing across services to reduce mean time to resolution during incidents.
- You want predictable, ingestion-based pricing at $0.15 per GB, based on CubeAPM pricing pages and sales data, without user-based licensing or retention add-ons.
- You require unlimited data retention for audits, long-term performance analysis, or post-incident reviews, constrained only by storage.
- You run Java-heavy backends (Spring Boot, JVM microservices, asynchronous Java workloads) and need deep tracing, latency breakdowns, and error correlation across JVM services using OpenTelemetry instrumentation.
- You expect observability data volume to grow steadily and want costs to scale linearly rather than unpredictably as usage increases.
Choose Better Stack if:
Better Stack is commonly selected by teams that prioritize speed, simplicity, and operational visibility over deep APM workflows.
- You are a startup or small engineering team looking for a fast setup with minimal operational overhead.
- You primarily need uptime monitoring, incident response, and log visibility rather than advanced distributed tracing.
- You prefer a SaaS-only platform where infrastructure management is fully handled by the vendor.
- You want developer-friendly dashboards and alerting focused on availability and operational signals.
- Your workloads are relatively simple, and manual or collector-level log sampling is sufficient to manage data volume, based on Better Stack’s official documentation.
- Your observability usage is still early-stage, and shorter retention windows are acceptable.
Choose New Relic if:
New Relic is often chosen by organizations that want a broad, mature SaaS observability ecosystem with extensive integrations.
- You want a full-stack SaaS observability platform with advanced analytics, service maps, and a large integration marketplace.
- You operate at enterprise scale and have dedicated teams managing observability tooling.
- You are comfortable with usage-based pricing combined with user-based licensing, based on New Relic’s official pricing and billing model.
- You need adaptive head-based or tail-based sampling options for managing trace volume in large environments.
- You prefer a fully managed solution where deployment control is less critical than feature breadth.
- You already have a significant investment in the New Relic ecosystem and want to extend existing instrumentation rather than migrate.
Conclusion
Better Stack, New Relic, and self-hosted observability platforms represent different approaches to modern observability. Better Stack prioritizes simplicity, uptime monitoring, and fast onboarding. New Relic emphasizes a broad, fully managed SaaS ecosystem with deep instrumentation and analytics.
As systems scale, however, differences in pricing behavior, retention limits, sampling transparency, and deployment control become more pronounced. Teams evaluating observability platforms at this stage often focus on how costs behave under sustained load, how much historical data remains accessible, and where telemetry ultimately resides.
Understanding these trade-offs helps organizations choose an observability approach aligned with long-term reliability, compliance, and cost governance, rather than relying on feature comparisons alone.
Disclaimer: The information in this article reflects the latest details available at the time of publication and may change as technologies and products evolve.
FAQs
1. Can Better Stack, New Relic, and CubeAPM be used together during a migration phase?
Yes. Many teams run tools in parallel during migration. CubeAPM can ingest data from OpenTelemetry and other existing agents, which allows gradual transition. Better Stack and New Relic can continue operating during this phase while teams validate coverage and cost behavior, based on each platform’s official ingestion and agent support documentation.
2. Which tool is better suited for Kubernetes and container-heavy environments?
All three tools support Kubernetes, but they differ in depth. CubeAPM and New Relic provide deeper distributed tracing and service-level visibility across microservices, while Better Stack focuses more on uptime, logs, and operational signals. Teams running complex microservice meshes often evaluate how well traces, logs, and metrics correlate under sustained container churn.
3. How do these platforms differ in handling long-term historical analysis?
CubeAPM allows teams to retain telemetry as long as storage is available, enabling long-term trend analysis and audits. Better Stack and New Relic apply retention limits based on plan and data type, which means long-term analysis may require exporting data or upgrading plans, according to their official retention policies.
4. Is OpenTelemetry equally supported across all three platforms?
All three platforms support OpenTelemetry ingestion, but the level of integration differs. CubeAPM is designed around OpenTelemetry as a native foundation. New Relic supports OpenTelemetry alongside its own agents. Better Stack supports OpenTelemetry through collectors and exporters rather than a broad native agent ecosystem.
5. How do teams typically estimate observability costs before choosing a platform?
Teams usually model expected telemetry volume, signal mix, and retention needs. CubeAPM costs are estimated based on predictable ingestion volume. Better Stack and New Relic estimates often involve combining user licensing, ingestion charges, and retention tiers. Most teams reassess these estimates after running production workloads for several weeks to observe real data patterns.


