










Kafka Streams applications process millions of events per second, but without proper monitoring, a stuck consumer, memory leak, or partition lag can silently degrade throughput for hours before anyone notices.
Most teams start with JMX metrics and Grafana dashboards, then hit two walls: JMX exporter configuration becomes brittle as topologies grow, and Grafana lacks the trace correlation needed to debug why a specific partition is lagging or why a state store read is slow. This guide compares 10 Kafka Streams monitoring tools across open-source JMX exporters, SaaS platforms, and unified observability solutions. Each is evaluated on pricing transparency, OpenTelemetry compatibility, state store visibility, and whether it correlates Kafka metrics with application traces.
How we evaluated these tools: We assessed each platform on five dimensions: pricing model and total cost at scale, native Kafka Streams JMX metric support vs. generic monitoring, OpenTelemetry compatibility for trace correlation, deployment options (SaaS-only vs. on-prem vs. hybrid), and ease of migration from existing Prometheus/Grafana setups. CubeAPM is our own product and is included in this comparison. We have disclosed this transparently so you can weigh it accordingly. Pricing figures are sourced from each vendor’s public pricing pages as of early 2026.
Quick Comparison: 10 Kafka Streams Monitoring Tools
| Tool | Best For | Pricing Model | OTel-Native? | On-Prem? |
|---|---|---|---|---|
| CubeAPM | Unified streams + traces + logs, self-hosted | $0.20/GB · unlimited users | ✓ Native | ✓ Yes |
| Prometheus + Grafana | DIY JMX export, full control | Free OSS | ✓ Strong | ✓ Yes |
| Confluent Control Center | Confluent Platform users, native integration | Bundled with Confluent Enterprise | ✗ Proprietary | ✓ Yes |
| Datadog | Managed multi-cloud, 700+ integrations | $31/host/mo + per-metric costs | Partial | ✗ SaaS only |
| Dynatrace | Enterprise AI-automated root cause | Starts $74/host/mo (8 GiB host) | Partial | ✓ Yes |
| Elastic Stack (ELK) | Teams already on Elasticsearch/Kibana | Free OSS · Elastic Cloud from $95/mo | Partial | ✓ Self-hosted |
| New Relic | Broad observability platform, Kafka as add-on | $0.40/GB beyond 100 GB free | Strong | ✗ SaaS only |
| Splunk | Enterprise SIEM + log analytics | Starts at $150/GB ingestion | Native | ✓ Yes |
| LinkedIn Burrow | Consumer lag focus, lightweight | Free OSS | ✗ Lag-only | ✓ Yes |
| Kpow (Factor House) | Kafka-native UI, schema registry integration | Custom pricing · contact sales | ✗ Kafka-only | ✓ Yes |
Pricing based on standardized profile: 50 Kafka Streams hosts, 20 TB/month metrics + logs. Figures are directional estimates from public rate cards, early 2026. Actual pricing varies by retention, host size, support tier, and discounts. Verify with each vendor.
1. CubeAPM
CubeAPM is a self-hosted, OpenTelemetry-native observability platform covering APM, logs, infrastructure, and Kafka Streams monitoring in one unified stack. It runs inside your cloud or on-prem, so Kafka metrics never leave your environment. CubeAPM ingests Kafka Streams JMX metrics via OpenTelemetry collectors or Prometheus exporters, correlates them with distributed traces to show which application code caused a consumer lag spike, and surfaces state store read/write latencies alongside stream thread health.
Key Features:
- Native Kafka Streams JMX metrics via OpenTelemetry or Prometheus remote write
- Automatic trace correlation to link partition lag with slow processor nodes
- State store monitoring for RocksDB read/write latency, compaction, and memory usage
- Consumer lag tracking per topic and partition with alerting
- Unlimited retention at $0.20/GB pricing with no per-host or per-metric charges
Pricing: $0.20/GB data ingested. For 50 Kafka Streams hosts generating 20 TB/month metrics and logs, estimated cost is $4,000/month with unlimited retention. No user seat fees. Source: CubeAPM pricing page.
Pros:
- Unified APM + Kafka metrics means trace-to-lag correlation works out of the box
- Self-hosted deployment keeps Kafka telemetry private and eliminates egress fees
- Predictable flat-rate pricing with no surprise metric cardinality charges
- Compatible with existing Prometheus exporters and OpenTelemetry collectors
Cons:
- Requires bringing your own infrastructure (BYOC deployment)
- Less mature third-party integration ecosystem than Datadog or Splunk
- No autonomous anomaly detection for Kafka-specific patterns (manual alert setup required)
Best for: Teams running Kafka Streams in production who need unified observability across streams, traces, and logs without sending telemetry to external SaaS or paying per-host fees.
2. Prometheus + Grafana
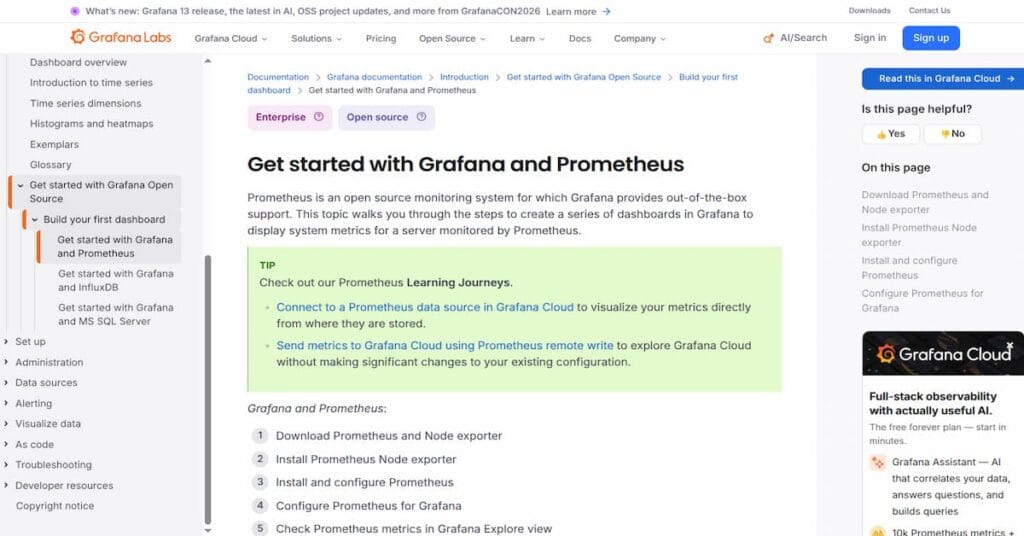
Prometheus is an open-source time series database designed for metrics collection, and Grafana is a visualization platform that connects to Prometheus (and other data sources). For Kafka Streams monitoring, teams deploy a JMX exporter as a Java agent alongside their Streams application, which converts JMX MBeans into Prometheus-readable metrics exposed over HTTP. Prometheus scrapes this endpoint, and Grafana dashboards query the stored metrics. This stack gives full control over data retention, query performance, and deployment architecture.
Key Features:
- Free and open source with no licensing costs
- JMX exporter converts Kafka Streams MBeans to Prometheus format automatically
- PromQL query language enables complex metric aggregation and alerting
- Pre-built Grafana dashboards available from the community (Confluent, LinkedIn)
- Full data ownership with self-hosted deployment
Pricing: Free OSS. Infrastructure costs for running Prometheus and Grafana depend on your environment. For 50 Kafka Streams hosts, expect ~$500–$1,000/month in compute and storage (AWS EC2/EBS equivalent). Source: Infrastructure costs are user-managed; no vendor pricing page.
Pros:
- No vendor lock-in, full control over data retention and query performance
- Strong community support with pre-built JMX exporter configurations and Grafana dashboards
- Works natively with existing Prometheus setups (no additional agents)
- OpenTelemetry compatible via Prometheus remote write
Cons:
- DIY operational burden: requires managing Prometheus high availability, storage, and Grafana upgrades
- JMX exporter regex configuration becomes brittle as Kafka topologies scale
- No trace correlation without manually integrating a separate APM tool like Jaeger or Tempo
- Alert fatigue is common without careful tuning (Prometheus alert rules are code, not UI)
Best for: Teams already running Prometheus for infrastructure monitoring who want full control and can handle the Day 2 operational overhead of self-managing storage and alerting.
3. Confluent Control Center
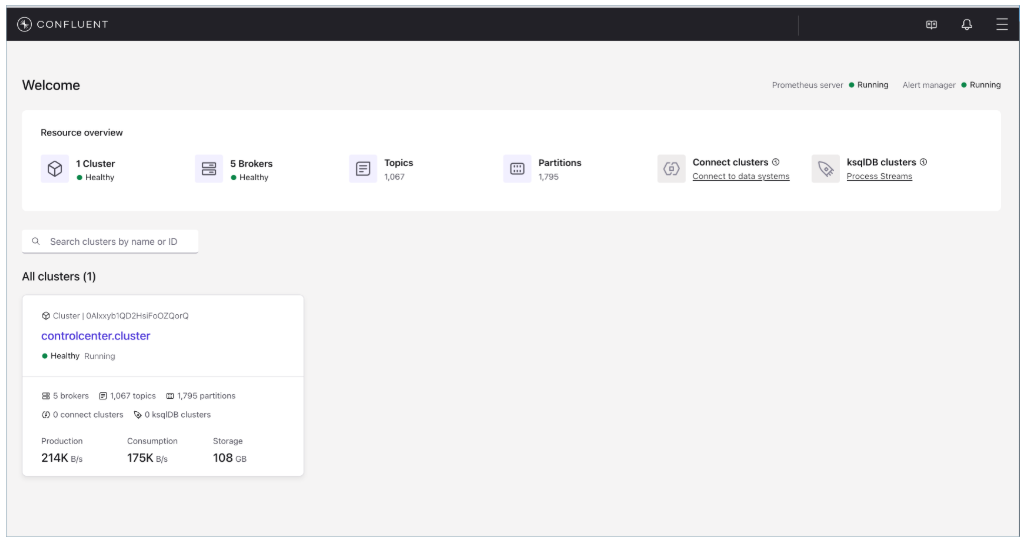
Confluent Control Center is Confluent’s native monitoring and management UI for Apache Kafka and Kafka Streams. It ships with Confluent Platform Enterprise and provides real-time cluster health, consumer lag tracking, stream topology visualization, and schema registry integration. Control Center collects Kafka metrics internally (not via JMX exporter) and surfaces them in a purpose-built UI optimized for Kafka operators.
Key Features:
- Native Kafka Streams topology visualization with task and thread health
- Consumer lag monitoring per partition with historical trend graphs
- Stream processing metrics: records processed, latency, error rates, state store stats
- Integrated alerting for lag spikes, under-replicated partitions, and broker failures
- Schema registry integration for Avro/Protobuf topic monitoring
Pricing: Bundled with Confluent Platform Enterprise. Confluent pricing is not publicly listed and requires contacting sales. Enterprise contracts typically start around $50,000/year for small deployments. Source: Pricing starts in the enterprise range – verify current rates on the Confluent pricing page.
Pros:
- Purpose-built for Kafka; no configuration needed for Streams JMX metrics
- Stream topology graph makes it easy to spot which processor node is slow
- Works seamlessly with Confluent Platform features like RBAC and Audit Logs
- Native integration with Confluent Cloud for hybrid monitoring
Cons:
- Only available with Confluent Enterprise (not open source Kafka)
- Cannot monitor non-Confluent Kafka distributions easily
- No APM trace correlation (metrics-only view, no distributed tracing)
- Expensive for teams running open source Kafka or small clusters
Best for: Teams already standardized on Confluent Platform Enterprise who need Kafka-native monitoring without building a custom Prometheus/Grafana stack.
4. Datadog
Datadog is a SaaS observability platform with 1,000+ integrations covering infrastructure, APM, logs, and specialized monitoring for Kafka. The Datadog Kafka integration uses a JMX check (part of the Datadog Agent) to collect broker, producer, and consumer metrics. For Kafka Streams, it surfaces JMX metrics like stream thread state, task latencies, and state store stats in Datadog’s unified dashboards. Datadog also correlates Kafka metrics with APM traces if both are instrumented.
Key Features:
- Automated Kafka metric discovery via Datadog Agent JMX integration
- Pre-built dashboards for Kafka broker, consumer, and Streams metrics
- APM trace correlation to link slow Kafka Streams processing with downstream services
- Anomaly detection uses machine learning to flag unusual consumer lag or throughput drops
- Integration with logs, infrastructure, and RUM for full-stack visibility
Pricing: Infrastructure Monitoring starts at $18/host/month (15-month retention). APM starts at $42/host/month. For 50 Kafka Streams hosts ingesting 20 TB/month metrics and traces, estimated cost is $3,000/month infrastructure + $2,100/month APM = $5,100/month base, before log ingestion ($0.10/GB ingest + $1.70/M events indexed). Total with logs: ~$7,500–$9,000/month. Source: Datadog pricing page.
Pros:
- Fully managed SaaS with no operational overhead
- Strong APM integration means trace-to-Kafka-metric correlation works out of the box
- Machine learning anomaly detection reduces manual alert tuning
- Pre-built Kafka Streams dashboards save setup time
Cons:
- Per-host pricing compounds fast as Kafka Streams deployments auto-scale
- Logs are double-billed: $0.10/GB ingest + $1.70/M events indexed, which adds $2,000–$4,000/month for 20 TB logs
- SaaS-only deployment means Kafka metrics leave your infrastructure (potential compliance issue)
- r/devops users report bills tripling overnight during traffic spikes due to per-host and per-metric cardinality charges
Best for: Teams already standardized on Datadog for multi-cloud observability who prioritize managed service convenience over cost predictability.
5. Dynatrace
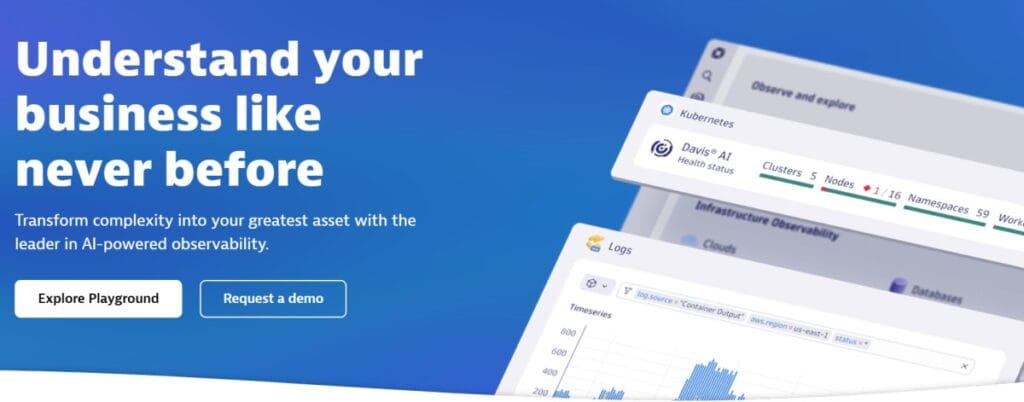
Dynatrace is an enterprise observability platform with AI-powered root cause analysis. Its Kafka monitoring extension ingests broker and consumer metrics via ActiveGate (Dynatrace’s data collector), and OneAgent can instrument Kafka Streams applications at the JVM level to capture thread state, task latencies, and state store performance. Dynatrace’s Davis AI correlates Kafka metrics with infrastructure and APM signals to automatically pinpoint root causes like JVM garbage collection pauses causing consumer lag.
Key Features:
- AI-automated root cause analysis correlates Kafka lag with JVM GC, CPU, or network issues
- Full stack monitoring: Kafka metrics + JVM traces + infrastructure in one view
- State store monitoring for RocksDB compaction, read/write latency, and memory usage
- Automatic topology mapping shows Kafka Streams dependencies on databases and external APIs
- Supports on-prem, SaaS, and hybrid deployment models
Pricing: Starts at $74/month per host (8 GiB host size) for Full Stack Monitoring. For 50 Kafka Streams hosts, the estimated cost is $3,700/month base. Add-ons for Davis AI and extended retention increase this to ~$5,000–$7,000/month. Source: Pricing starts from $74/host/month – verify current rates on the Dynatrace pricing page.
Pros:
- Davis AI reduces mean time to resolution by auto-correlating Kafka issues with infrastructure
- Full stack visibility from Kafka broker to JVM to OS in one unified view
- On-prem deployment option for regulated industries
- Strong enterprise support and professional services
Cons:
- Expensive for small to mid-size teams (enterprise pricing only)
- Complex licensing model with multiple SKUs (Full Stack, Davis, Log Management)
- Steep learning curve for configuring custom Kafka Streams dashboards
- Per-host pricing makes auto-scaling Kafka Streams clusters costly
Best for: Enterprise teams running mission-critical Kafka Streams workloads who need AI-automated root cause analysis and can justify premium pricing.
6. Elastic Stack (ELK)

The Elastic Stack (Elasticsearch, Logstash, Kibana) is a widely deployed open-source log management and search platform. For Kafka Streams monitoring, teams typically use Metricbeat or Filebeat to collect JMX metrics and logs from Kafka Streams applications, ship them to Elasticsearch, and visualize them in Kibana dashboards. Elastic also offers APM Server for distributed tracing, which can correlate Kafka metrics with application traces.
Key Features:
- Open source with self-hosted deployment (Elasticsearch, Kibana)
- Metricbeat Kafka module collects broker and consumer metrics automatically
- Elastic APM correlates Kafka Streams traces with JVM metrics and logs
- Kibana pre-built dashboards for Kafka broker, consumer, and streams health
- Full-text search across Kafka logs for debugging error messages
Pricing: Free OSS for self-hosted. Elastic Cloud (managed) starts at $95/month for a 4 GB RAM deployment. For 50 Kafka Streams hosts ingesting 20 TB/month metrics and logs, self-hosted infrastructure costs ~$2,000–$3,000/month (compute + storage). Elastic Cloud managed equivalent: ~$8,000–$12,000/month. Source: Elastic Cloud pricing page.
Pros:
- Free and open source for self-hosted deployment
- Strong log search and aggregation capabilities (best-in-class for text search)
- Elastic APM provides distributed tracing for Kafka Streams applications
- Large community with pre-built Kafka dashboards and Metricbeat modules
Cons:
- High operational complexity: managing Elasticsearch clusters at scale requires dedicated SRE effort
- Elasticsearch resource consumption is high (CPU, memory, disk I/O)
- JMX metric collection via Metricbeat requires manual configuration for custom Kafka Streams metrics
- No native anomaly detection for Kafka-specific patterns (requires Elastic Machine Learning license)
Best for: Teams already running the Elastic Stack for log management who want to consolidate Kafka Streams monitoring into their existing ELK setup.
7. New Relic

New Relic is a SaaS observability platform covering APM, infrastructure, logs, and specialized integrations. Its Kafka integration collects broker and consumer metrics via the New Relic Infrastructure Agent and JMX, surfacing them in pre-built dashboards. For Kafka Streams, teams instrument applications with the New Relic Java agent to capture JVM metrics, traces, and errors, then manually correlate with Kafka consumer lag metrics.
Key Features:
- Unified APM, logs, and infrastructure in one platform
- Pre-built Kafka broker and consumer dashboards
- Distributed tracing with New Relic Java agent for Kafka Streams applications
- NRQL query language for custom Kafka metric aggregation and alerting
- Incident intelligence uses machine learning to group related Kafka alerts
Pricing: New Relic uses consumption-based pricing: $0.40/GB ingested beyond the first 100 GB free per month, plus $99/user/month for Full Platform access. For 50 Kafka Streams hosts ingesting 20 TB/month of metrics and logs, the estimated cost is 20,000 GB × $0.40 = $8,000/month + (5 users × $99 = $495/month) = $8,495/month base. Source: New Relic pricing page.
Pros:
- Fully managed SaaS with no operational overhead
- Unified view of Kafka metrics, APM traces, and logs in one UI
- Strong NRQL query language for custom Kafka metric analysis
- Generous 100 GB free tier good for small Kafka deployments
Cons:
- $0.40/GB pricing compounds fast at scale (2x higher than CubeAPM’s $0.20/GB)
- Per-user Full Platform fees ($99/month) lock out junior engineers from Kafka monitoring dashboards
- NRQL proprietary query language creates lock-in (not portable to other tools)
- SaaS-only deployment means Kafka metrics leave your infrastructure
Best for: Teams already using New Relic for broader observability who want to consolidate Kafka Streams monitoring without managing separate tools.
8. Splunk
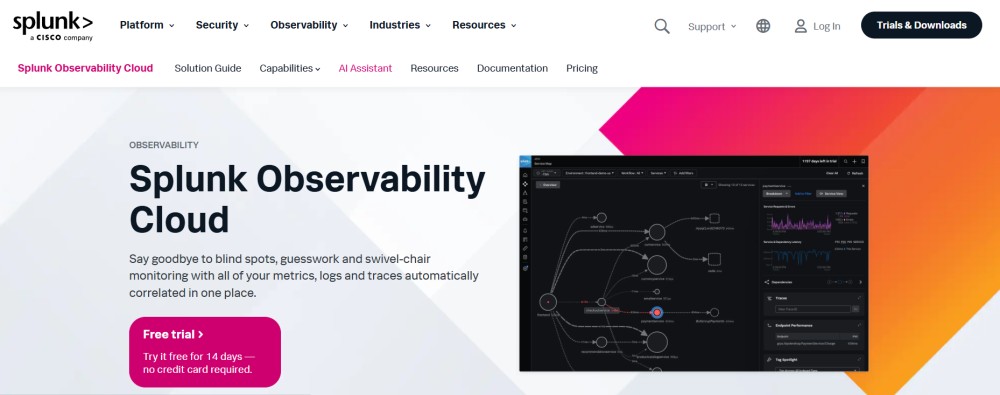
Splunk is an enterprise log management and SIEM platform with strong Kafka integration. The Splunk Add-on for Kafka collects broker metrics, producer stats, and consumer lag via JMX and Kafka REST APIs. For Kafka Streams, teams configure Splunk Universal Forwarder to ship JMX metrics and application logs to Splunk, then build custom dashboards and alerts in Splunk’s Search Processing Language (SPL).
Key Features:
- Enterprise-grade log aggregation and search (best for SIEM use cases)
- Splunk Add-on for Kafka collects broker, producer, and consumer metrics automatically
- Machine learning toolkit for anomaly detection on Kafka consumer lag and throughput
- Splunk Observability Cloud integrates Kafka metrics with APM traces and infrastructure
- On-prem and SaaS deployment options
Pricing: Splunk pricing is complex and typically based on data ingestion volume. Splunk Observability Cloud starts at $15/host/month for Infrastructure Monitoring and $75/host/month for APM. For 50 Kafka Streams hosts ingesting 20 TB/month of logs and metrics, the estimated cost is $750/month for infrastructure + $3,750/month for APM + $3,000/month for log ingestion (at ~$0.15/GB equivalent) = $7,500/month. Source: Pricing starts at $15/host/month. Verify current rates on the Splunk pricing page.
Pros:
- Best-in-class log search and aggregation for Kafka application logs
- Strong SIEM capabilities for security monitoring of Kafka infrastructure
- Machine learning toolkit provides anomaly detection for Kafka metrics
- On-prem deployment option for regulated industries
Cons:
- Expensive at scale (per-host + per-GB ingestion charges compound fast)
- Steep learning curve for SPL (Splunk’s proprietary query language)
- Kafka Streams-specific dashboards require manual configuration (not pre-built)
- High resource consumption for Splunk indexers and search heads
Best for: Enterprise teams already standardized on Splunk for SIEM who want to consolidate Kafka Streams monitoring into their existing Splunk deployment.
9. LinkedIn Burrow
Burrow is an open-source Kafka consumer lag monitoring tool created by LinkedIn. It focuses exclusively on tracking consumer offsets and calculating lag per partition, surfacing alerts when consumers fall behind. Burrow does not monitor broker health, producer performance, or Kafka Streams JMX metrics. It is a lightweight, single-purpose tool for consumer lag visibility.
Key Features:
- Lightweight consumer lag monitoring with minimal resource overhead
- HTTP API for querying lag per consumer group and partition
- Built-in lag evaluation algorithm (no manual threshold tuning required)
- Works with any Kafka cluster (not tied to Confluent or specific distributions)
- Free and open source
Pricing: Free OSS. Infrastructure costs for running Burrow are minimal (~$50–$100/month for a small EC2 instance). Source: No vendor pricing page (open source project).
Pros:
- Laser-focused on consumer lag (does one thing well)
- No JMX exporter configuration needed (reads directly from Kafka’s internal __consumer_offsets topic)
- Lightweight with minimal resource consumption
- Free and open source with active community
Cons:
- Lag-only monitoring: no broker health, producer metrics, or Kafka Streams JMX visibility
- No built-in UI (requires integrating with Grafana or custom dashboards)
- No trace correlation or APM integration
- Limited alerting capabilities (HTTP API only, requires external alert manager)
Best for: Teams who only need consumer lag monitoring and already have separate tools for broker health and application traces.
10. Kpow (Factor House)
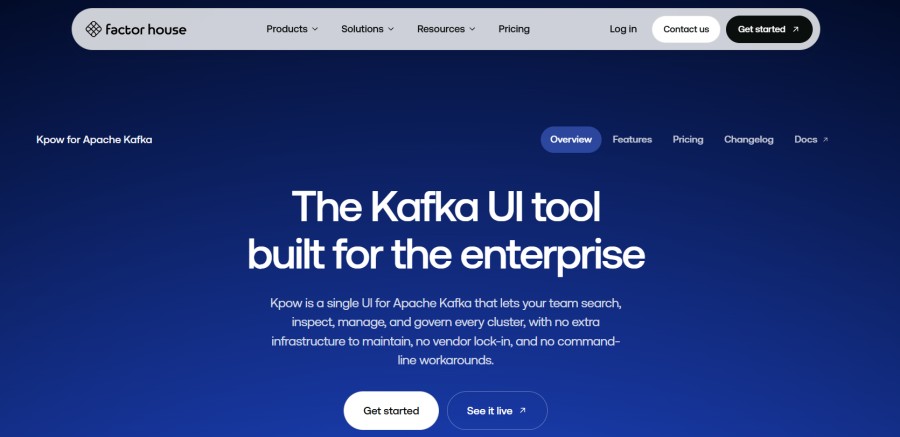
Kpow is a Kafka-native management and monitoring UI built by Factor House. It provides real-time cluster health, consumer lag tracking, schema registry integration, and Kafka Streams topology visualization. Kpow runs as a standalone JVM application and connects directly to Kafka clusters via native Kafka protocols (not JMX exporters).
Key Features:
- Kafka-native UI with real time cluster health and consumer lag tracking
- Schema registry integration for Avro, Protobuf, and JSON Schema topics
- Kafka Streams topology visualization with task and thread health
- RBAC and audit logging for production Kafka environments
- Data governance features (topic inspection, message sampling, tombstone detection)
Pricing: Custom pricing based on cluster size and feature requirements. Contact Factor House sales for a quote. Pricing starts from a custom range; verify current rates at the Kpow pricing page.
Pros:
- Purpose-built for Kafka operators (not a generic observability tool)
- No JMX exporter configuration needed (native Kafka protocol integration)
- Strong schema registry integration for teams using Avro/Protobuf
- RBAC and audit logs meet enterprise compliance requirements
Cons:
- Custom pricing model lacks transparency (requires a sales call)
- Kafka-only monitoring (no APM traces, logs, or infrastructure visibility)
- No anomaly detection or machine learning features
- Limited community support (commercial product with small user base)
Best for: Kafka-heavy teams running Confluent Platform or open source Kafka who need a Kafka-native UI with schema registry integration and RBAC.
How to Choose the Right Kafka Streams Monitoring Tool
Choosing the right Kafka Streams monitoring tool depends on five factors: deployment model (SaaS vs. self-hosted), pricing predictability, observability depth (metrics-only vs. traces + logs), OpenTelemetry compatibility, and operational overhead. Here’s a decision framework:
If you need full data sovereignty and predictable pricing: CubeAPM runs inside your cloud with $0.20/GB pricing. Prometheus + Grafana gives full control at the cost of operational overhead.
If you’re already on Confluent Enterprise: Confluent Control Center is the easiest path (bundled, native integration, no JMX exporter configuration).
If you need unified APM + Kafka metrics in one managed SaaS: Datadog or New Relic offer the broadest integration ecosystems, but at 2–3x the cost of self-hosted alternatives.
If you only care about consumer lag: LinkedIn Burrow is the lightest-weight solution, but requires integrating with separate tools for broker health and application traces.
If you’re already running the Elastic Stack: Elastic APM + Metricbeat consolidates Kafka monitoring into your existing ELK deployment, but adds operational complexity.
Migration tip: Most teams migrate incrementally by running new monitoring alongside existing tools for 2–4 weeks, validating alert parity, then cutting over. CubeAPM, Prometheus, and Elastic all support OpenTelemetry collectors for zero-downtime migration.
Frequently Asked Questions
What is Kafka Streams monitoring and why does it matter?
Kafka Streams monitoring tracks the health and performance of Kafka Streams applications by collecting JMX metrics like stream thread state, task latencies, state store read/write performance, and consumer lag. Without monitoring, a stuck consumer or memory leak can degrade throughput for hours before anyone notices, causing downstream SLA breaches. Monitoring surfaces these issues in real time with alerts and dashboards so teams can fix problems before they impact customers.
What are the most important Kafka Streams metrics to monitor?
The top five Kafka Streams metrics are: consumer lag per partition (how far behind consumers are from the latest offsets), stream thread state (running vs. rebalancing vs. dead), task processing latency (time to process one record), state store read/write latency (RocksDB performance), and error rate (failed records per second). These metrics surface the most common production issues: stuck consumers, slow state stores, and processing errors.
Can I monitor Kafka Streams with Prometheus and Grafana?
Yes. Deploy JMX Exporter as a Java agent alongside your Kafka Streams application to convert JMX MBeans into Prometheus metrics. Prometheus scrapes the exporter’s HTTP endpoint, and Grafana dashboards query Prometheus to visualize stream thread health, task latencies, and consumer lag. Pre-built Grafana dashboards are available from the community. This approach is free and open source but requires managing Prometheus storage and Grafana upgrades.
How does CubeAPM monitor Kafka Streams?
CubeAPM ingests Kafka Streams JMX metrics via OpenTelemetry collectors or Prometheus remote write, correlates them with distributed traces to show which application code caused consumer lag, and surfaces state store read/write latencies alongside stream thread health. CubeAPM runs inside your cloud or on-prem with $0.20/GB pricing and unlimited retention, making it cost-effective for teams processing 10+ TB/month telemetry.
What is the difference between Kafka monitoring and Kafka Streams monitoring?
Kafka monitoring tracks broker health (disk usage, partition replication, request latency), producer performance (send rate, batch size), and consumer lag. Kafka Streams monitoring adds stream processing-specific metrics: stream thread state, task latencies, state store performance (RocksDB read/write), and processor node metrics. Teams running Kafka Streams applications need both: broker-level visibility to detect under-replicated partitions and streams-level visibility to debug why a specific topology is slow.
Disclaimer: The information in this article reflects the latest details available at the time of publication and may change as technologies and products evolve. Features, pricing, and plan limits can change over time. Always verify the latest information directly with the vendor before making purchasing or deployment decisions.