










Chaos engineering is no longer optional for teams running distributed systems at scale. A single unhandled failure in Kubernetes pod scheduling, a degraded database connection pool, or a network partition between microservices can cascade into a full production outage. According to the 2024 CNCF Cloud Native Survey, 68% of organizations now run chaos experiments in production environments to validate resilience before incidents occur.
Without chaos engineering, failure modes remain theoretical until they cause customer-facing downtime. With chaos testing, teams discover vulnerabilities early, validate recovery paths, and build confidence that systems can withstand real-world turbulence. This guide compares 10 chaos engineering monitoring tools across open source, SaaS, and on-premises platforms, evaluated on fault injection depth, cost model, Kubernetes support, and ease of adoption for teams at every scale.
Quick Comparison: 10 Chaos Engineering Tools at a Glance
| Tool | Best For | Pricing | Kubernetes Native? | Open Source? |
|---|---|---|---|---|
| CubeAPM | Full-stack observability with on-premises chaos visibility | $0.20/GB ingestion, unlimited users | ✓ Yes | No (proprietary) |
| Gremlin | Commercial chaos engineering with enterprise support | Free trial, paid from $50/host/month | ✓ Yes | No |
| Litmus | Open source Kubernetes native chaos platform | Free (self-hosted), enterprise pricing available | ✓ Native | Yes |
| Chaos Mesh | Cloud native chaos engineering on Kubernetes | Free (open source) | ✓ Native | Yes |
| AWS Fault Injection Simulator | AWS native chaos for EC2, RDS, EKS | $0.10/minute per action | ✓ EKS support | No |
| Azure Chaos Studio | Azure native chaos testing | $0.20/experiment minute | ✓ AKS support | No |
| Steadybit | Commercial chaos with resilience policies | Custom pricing, demo required | ✓ Yes | No |
| Chaos Toolkit | Open source extensible chaos framework | Free (open source) | Partial | Yes |
| PowerfulSeal | Kubernetes-specific chaos testing | Free (open source) | ✓ Native | Yes |
| Pumba | Docker container chaos testing | Free (open source) | Docker focused | Yes |
Understanding Chaos Engineering and Why Monitoring Matters
Chaos engineering is the discipline of experimenting on distributed systems to build confidence in their ability to withstand turbulent production conditions. The practice originated at Netflix with Chaos Monkey, which randomly terminated EC2 instances during business hours to force engineering teams to design for failure. Modern chaos engineering goes beyond random instance termination. Teams inject specific failure modes, network latency spikes, CPU throttling, DNS failures, pod evictions, disk exhaustion, and observe how systems react. The goal is not to break systems but to discover weaknesses before they manifest as customer-facing incidents.
Monitoring is essential during chaos experiments because it provides the observability layer that captures system behavior under stress. Without monitoring, teams cannot see whether a chaos experiment caused a cascade failure, triggered alerts correctly, or revealed a hidden single point of failure. Effective chaos engineering requires infrastructure monitoring that tracks Kubernetes pods, nodes, services, databases, and application traces simultaneously.
The relationship between chaos engineering and monitoring is bidirectional. Chaos experiments validate that monitoring tools surface problems correctly. Monitoring tools provide the evidence that chaos experiments either succeeded or revealed vulnerabilities. Teams that adopt chaos engineering without proper observability run experiments blind and miss the insights that make chaos testing valuable.
1. CubeAPM
CubeAPM is a full-stack observability platform that runs inside your own cloud or on-premises infrastructure, providing APM, distributed tracing, logs, infrastructure monitoring, and Kubernetes observability in one unified system. While CubeAPM is not a dedicated chaos engineering tool, it provides the monitoring layer that chaos experiments depend on, capturing application traces, infrastructure metrics, pod health, and error rates in real time as chaos faults are injected.
Key Features:
- Unified APM, logs, and infrastructure metrics in one platform
- Native Kubernetes monitoring with pod, node, and cluster-level visibility
- Distributed tracing with full context correlation
- On-premises deployment keeps telemetry data inside your cloud
- $0.20/GB pricing with no per-user or per-host fees
Pricing:
$0.20/GB for data ingestion with unlimited retention. No per-user seat charges. Full pricing details at the CubeAPM pricing page.
Pros:
- Full observability stack eliminates tool sprawl during chaos testing
- On-premises deployment removes data egress costs
- Fast trace search with high cardinality indexing
- Direct engineering support via Slack and WhatsApp
Cons:
- Not a native chaos fault injection tool
- Requires BYOC or on-premises infrastructure
- Must pair with a dedicated chaos platform like Litmus or Chaos Mesh
Best for:
Teams running chaos experiments on Kubernetes who need unified observability to validate system behavior without sending telemetry to external SaaS platforms.
2. Gremlin

Gremlin is a commercial chaos engineering platform designed for enterprise teams. It provides a managed SaaS service with pre-built fault types including resource attacks (CPU, memory, disk), state attacks (shutdown, time travel, process killer), and network attacks (latency, packet loss, DNS). Gremlin supports Kubernetes, Docker, AWS, Azure, GCP, and bare metal hosts through lightweight agents.
Key Features:
- Pre-built fault library with resource, state, and network attacks
- Kubernetes native with namespace and label targeting
- Status page integration to track experiments
- GameDay automation for recurring chaos tests
- RBAC and audit logs for compliance
Pricing:
Free trial available. Paid plans start at $50 per host per month with annual contracts. Enterprise pricing requires custom quotes. Verify current rates at the Gremlin pricing page.
Pros:
- Mature commercial platform with enterprise support
- Simple UI reduces chaos engineering learning curve
- Strong safety controls prevent runaway experiments
- Integrates with PagerDuty, Slack, Datadog, New Relic
Cons:
- Per-host pricing scales expensively with infrastructure growth
- SaaS only, no on-premises deployment option
- Limited customization compared to open source tools
- Requires agents on every target host
Best for:
Enterprise teams adopting chaos engineering for the first time who need guardrails, support, and a managed service.
3. Litmus
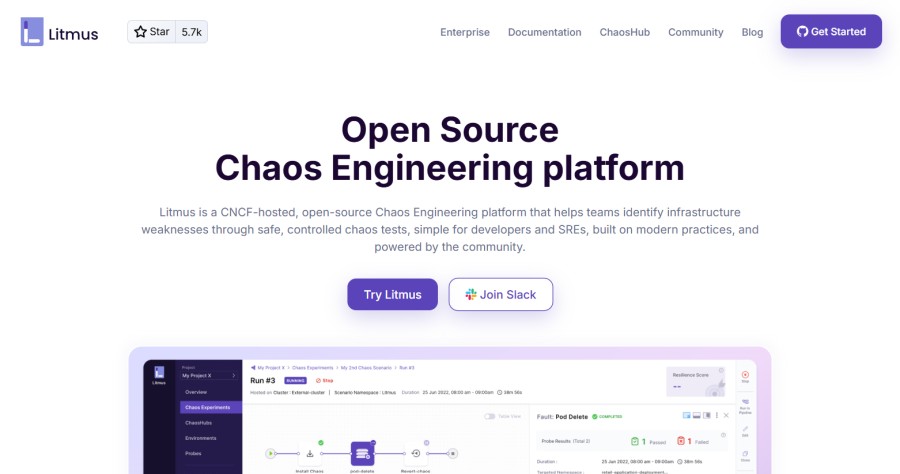
Litmus is an open source Kubernetes native chaos engineering platform originally built to test OpenEBS storage. It has grown into one of the largest cloud native chaos projects with native support for Kubernetes, AWS, Azure, GCP, and Apache Kafka. Litmus includes ChaosCenter, a web UI for managing experiments, and ChaosHub, a public repository of pre-built chaos experiments. Harness owns the Litmus project and offers a managed SaaS version called Harness Chaos Engineering.
Key Features:
- Kubernetes native with a CRD-based workflow engine
- ChaosHub library with 100+ pre-built experiments
- Litmus Probes for health checking before, during, and after experiments
- GitOps integration for declarative chaos workflows
- Supports AWS, Azure, GCP, Kafka, and bare metal
Pricing:
Open source (self-hosted) is free. Harness Chaos Engineering (managed SaaS) pricing starts from custom quotes. Verify current enterprise pricing on the Harness pricing page.
Pros:
- Fully open source with active CNCF community
- Native Kubernetes operator simplifies deployment
- Declarative YAML-based experiments fit GitOps workflows
- No vendor lock-in
Cons:
- Steep learning curve for teams new to Kubernetes CRDs
- Requires significant upfront configuration for each experiment
- ChaosCenter UI provides limited guidance on what to test
- Health probes require custom scripts or manual setup
Best for:
Kubernetes native teams who prefer open source tools and want full control over chaos experiment definitions.
4. Chaos Mesh
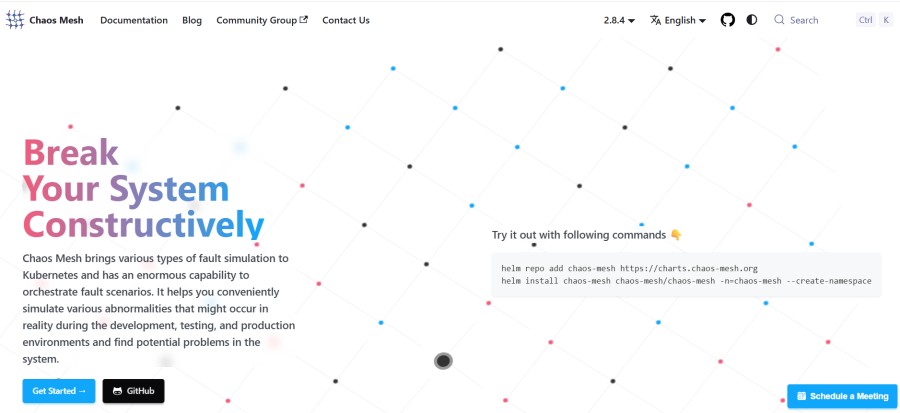
Chaos Mesh is a cloud native chaos engineering platform built by PingCAP and donated to the CNCF. It provides Kubernetes native fault injection with support for pod failures, network chaos, IO chaos, stress testing, and time skew. Chaos Mesh runs entirely inside Kubernetes using custom resource definitions and provides a web dashboard for experiment management.
Key Features:
- CNCF project with strong Kubernetes integration
- Pod kill, pod failure, container kill, network partition, and IO delay faults
- Scheduled chaos with cron-style timing
- Dashboard UI for visual experiment management
- Supports physical node chaos and cloud provider faults
Pricing:
Free (open source). No commercial managed version.
Pros:
- CNCF graduated project with strong community backing
- Clean CRD-based architecture fits Kubernetes patterns
- Dashboard simplifies experiment creation and visualization
- No external agents required
Cons:
- Kubernetes only, no support for VMs or bare metal
- Limited fault types compared to commercial platforms
- No built-in health checks or automatic rollback
- Requires Kubernetes expertise to deploy and maintain
Best for:
Teams running Kubernetes in production who want a lightweight open source chaos tool with CNCF community support.
5. AWS Fault Injection Simulator
AWS Fault Injection Simulator (FIS) is a managed chaos engineering service that injects faults directly into AWS infrastructure through the AWS control plane. It supports EC2 instance termination, RDS failover, ECS task disruption, API throttling, and SSM Run Command for custom host-level faults. FIS integrates with CloudWatch alarms for automatic experiment rollback.
Key Features:
- Native AWS service with control plane fault injection
- Supports EC2, RDS, ECS, EKS, API Gateway, and Lambda
- CloudWatch alarm integration for automatic stop conditions
- IAM-based access control and audit logging
- SSM integration for custom host-level scripts
Pricing:
$0.10 per minute per action. Costs accumulate for parallel actions. Example: 10-minute experiment with 5 parallel actions = $5.00. Verify current pricing on the AWS FIS pricing page.
Pros:
- Unique control plane access for AWS native faults
- No agents required on target hosts for service-level faults
- Automatic rollback via CloudWatch alarms
- Full IAM integration for access control
Cons:
- AWS only, no multi-cloud support
- Limited fault types compared to open source tools
- Requires IAM roles, SSM documents, and detailed resource targeting
- Cost per minute adds up quickly for complex experiments
Best for:
AWS native teams testing RDS failover, ECS task disruption, or EC2 instance termination without installing third-party agents.
6. Azure Chaos Studio

Azure Chaos Studio is Microsoft’s managed chaos engineering service for Azure infrastructure. It supports service-direct faults (run through the Azure API) and agent-based faults (executed inside virtual machines). Service-direct faults include VM shutdown, Cosmos DB throttling, and Azure Cache for Redis disruption. Agent-based faults require stress-ng to be pre-installed on target VMs.
Key Features:
- Native Azure service with API level fault injection
- Supports VMs, CosmosDB, AKS, Azure Cache for Redis
- Integrates with Chaos Mesh for Kubernetes experiments
- Experiments can run actions in parallel or sequence
- Resource targeting by tags, resource groups, or IDs
Pricing:
$0.20 per experiment minute. Pricing example: 15-minute experiment with 3 targets = $9.00. Verify current pricing at the Azure Chaos Studio pricing page.
Pros:
- Native Azure integration with zero agent setup for service-direct faults
- Strong targeting controls prevent accidental production impact
- Chaos Mesh integration for AKS clusters
- Built-in experiment templates
Cons:
- Azure only, no multi-cloud support
- Public preview stability may vary by region
- Agent-based faults require stress-ng pre-installation on every target VM
- Limited community resources compared to open source tools
Best for:
Azure native teams testing CosmosDB throttling, VM failures, or AKS disruption using first-party Azure tools.
7. Steadybit
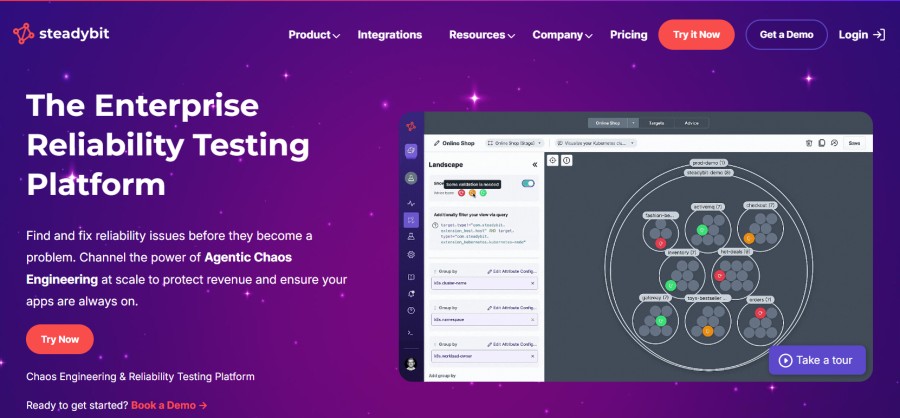
Steadybit is a commercial chaos engineering platform focused on resilience policies and automated safety checks. It provides pre-built experiments for Docker, Kubernetes, and Linux hosts with support for CPU stress, memory pressure, network latency, and process termination. Steadybit integrates with monitoring tools to halt experiments if systems become unhealthy.
Key Features:
- Resilience policies define expected system behavior
- Automatic health checks before, during, and after experiments
- Integrates with Datadog, Prometheus, and New Relic for monitoring
- Docker, Kubernetes, and Linux host support
- Experiment templates for common failure scenarios
Pricing:
Custom pricing. Requires demo and sales engagement. Pricing is not publicly listed.
Pros:
- Resilience policies make chaos testing more declarative
- Automatic rollback if monitoring detects unhealthy systems
- Strong focus on preventing runaway experiments
- Good documentation and onboarding support
Cons:
- No public pricing transparency
- Requires sales engagement to evaluate cost
- Limited fault types compared to Gremlin or open source tools
- SaaS only, no on-premises deployment
Best for:
Teams new to chaos engineering who want automated safety checks and resilience policy validation.
8. Chaos Toolkit
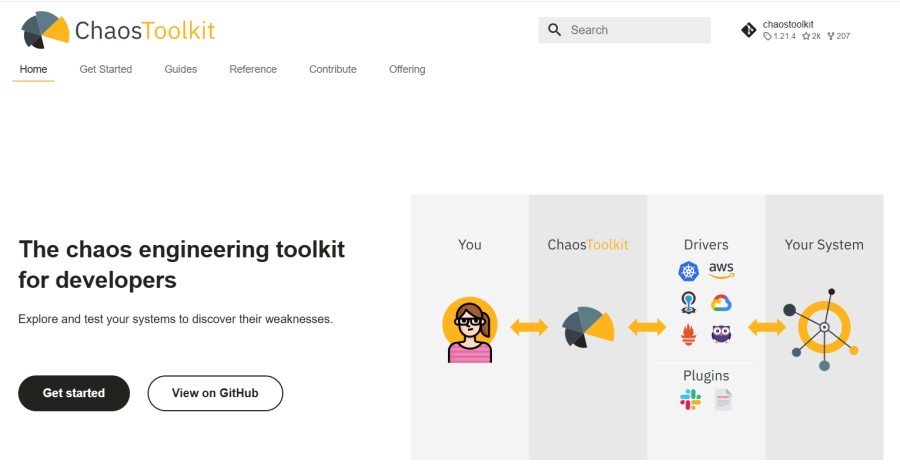
Chaos Toolkit is an open-source framework for building chaos experiments using declarative JSON or YAML definitions. It provides a plugin architecture for extending fault types and integrates with Kubernetes, AWS, Azure, GCP, and many Docker monitoring tools. Chaos Toolkit focuses on extensibility and allows teams to script custom experiments.
Key Features:
- Declarative experiment definitions in JSON or YAML
- Plugin architecture for custom fault injection
- Supports Kubernetes, AWS, Azure, GCP, and HTTP APIs
- CLI-driven execution fits CI/CD pipelines
- Active community with contributed experiments
Pricing:
Free (open source).
Pros:
- Highly extensible through plugin system
- Declarative experiments fit GitOps workflows
- No vendor lock-in
- Active community and public experiment library
Cons:
- Requires scripting knowledge to build experiments
- No graphical UI for experiment management
- Manual rollback if experiments fail
- Limited built-in fault types without plugins
Best for:
Platform engineering teams who want a scriptable chaos framework that integrates with existing CI/CD pipelines.
9. PowerfulSeal
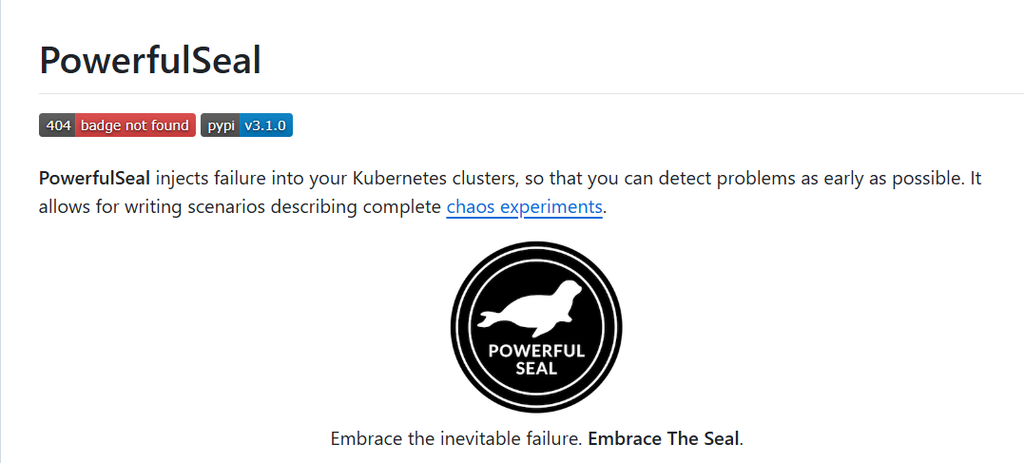
PowerfulSeal is an open-source Kubernetes-specific chaos tool designed to test pod resilience. It kills pods based on labels, namespaces, or node conditions and supports autonomous mode (random pod killing) and interactive mode (manual pod selection). PowerfulSeal integrates with Prometheus and Slack for alerts.
Key Features:
- Kubernetes native pod killing based on labels and filters
- Autonomous mode for continuous random chaos
- Interactive mode for controlled testing
- Prometheus metrics export
- Slack and webhook notifications
Pricing:
Free (open source).
Pros:
- Simple setup with minimal configuration
- Kubernetes native with no agents required
- Autonomous mode provides continuous resilience testing
- Integrates with Prometheus and alerting tools
Cons:
- Pod killing only, no network or resource chaos
- No web UI or dashboard
- Limited safety controls compared to commercial tools
- Kubernetes only
Best for:
Teams testing Kubernetes pod resilience who want a lightweight open source tool with minimal setup.
10. Pumba
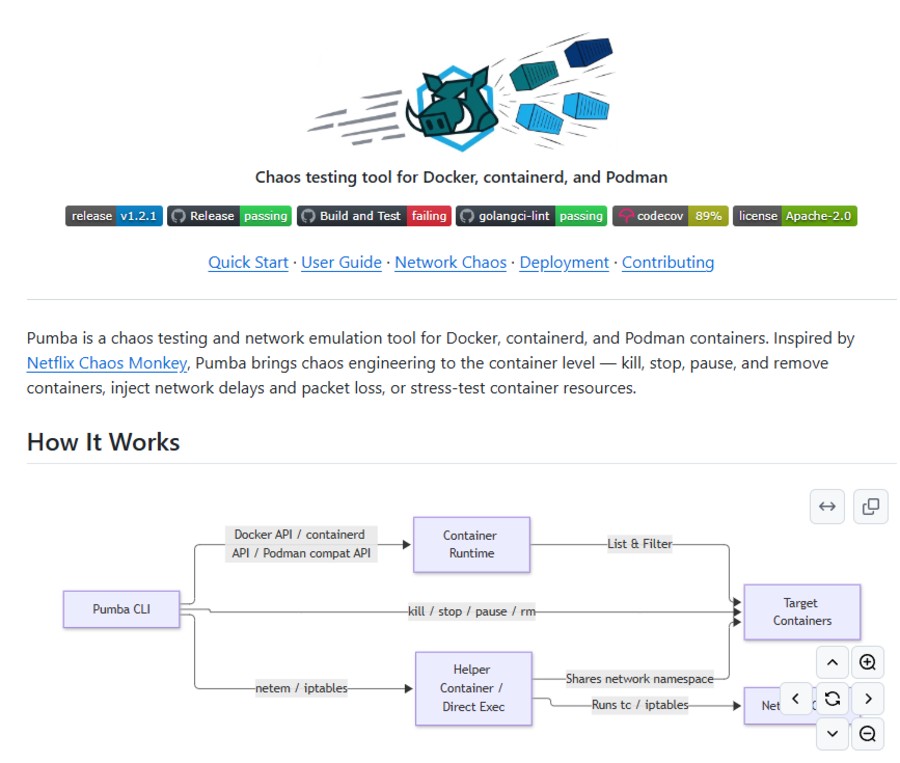
Pumba is an open-source Docker chaos testing tool that injects faults into containers. It supports container pause, stop, kill, and network chaos including latency, packet loss, and bandwidth limits. Pumba runs as a Docker container and targets other containers by name or label.
Key Features:
- Docker container chaos with pause, stop, kill, and remove
- Network chaos including latency, packet loss, and bandwidth throttling
- Supports container targeting by name, label, or regex
- Lightweight single binary deployment
- Integrates with CI/CD pipelines
Pricing:
Free (open source).
Pros:
- Simple Docker native chaos testing
- No agents or Kubernetes required
- Lightweight and fast to deploy
- Suitable for local development chaos testing
Cons:
- Docker only, no Kubernetes or VM support
- No web UI or dashboard
- Limited fault types compared to Kubernetes native tools
- No built-in safety controls
Best for:
Teams testing Docker container resilience in local or CI/CD environments before deploying to Kubernetes.
How to Choose the Right Chaos Engineering Tool
Selecting a chaos engineering platform depends on five factors: your infrastructure type (Kubernetes, VMs, cloud services), team size and chaos maturity, budget and cost model, deployment model (SaaS vs on-premises), and integration with existing monitoring tools.
Factor 1: Infrastructure Type
Kubernetes native teams should prioritize tools with CRD-based workflows like Litmus, Chaos Mesh, or PowerfulSeal. VM-heavy environments benefit from Gremlin or cloud provider tools like AWS FIS. Multi-cloud teams need cross-platform support from Gremlin or Chaos Toolkit.
Factor 2: Team Size and Chaos Maturity
Teams new to chaos engineering benefit from managed platforms like Gremlin or Steadybit that provide guardrails and pre-built experiments. Mature platform teams with chaos experience can leverage open-source tools like Litmus or Chaos Toolkit for full control.
Factor 3: Budget and Cost Model
Open source tools (Litmus, Chaos Mesh, Chaos Toolkit) eliminate licensing costs but require engineering time for setup and maintenance. Commercial tools charge per host (Gremlin $50/host/month), per minute (AWS FIS $0.10/minute), or custom enterprise pricing (Steadybit). Calculate total cost of ownership including engineering hours, not just license fees.
Factor 4: Deployment Model
Regulated industries with data residency requirements need on-premises chaos tools paired with self-hosted observability like CubeAPM. SaaS teams prioritize managed services like Gremlin or Harness Chaos Engineering.
Factor 5: Integration with Observability Tools
Chaos experiments require deep observability to validate system behavior. CubeAPM provides unified APM, logs, and Kubernetes monitoring that captures experiment impact across application and infrastructure layers. Datadog, New Relic, and Prometheus integrations are common across most chaos platforms.
Monitoring Chaos Experiments with CubeAPM

CubeAPM provides the observability layer that chaos experiments depend on to validate system resilience. While CubeAPM is not a fault injection tool, it captures the full stack telemetry needed to measure how applications and infrastructure respond under chaos testing. Teams using Litmus, Chaos Mesh, or Gremlin integrate CubeAPM to monitor pod restarts, service latency spikes, error rate changes, and resource saturation during experiments.
CubeAPM runs on-premises inside your Kubernetes cluster or cloud VPC, eliminating data egress costs and keeping telemetry local. Distributed tracing captures end-to-end request flows as chaos faults propagate through microservices. Kubernetes monitoring tracks pod evictions, node pressure, and deployment health in real time. Log aggregation centralizes error messages from failed services during chaos experiments. All telemetry is indexed and searchable with high cardinality filtering across service, pod, namespace, and experiment label dimensions.
Teams that pair CubeAPM with open-source chaos tools gain full visibility into system behavior during failure injection. Alert rules trigger when latency thresholds are breached during network chaos experiments. Trace correlation identifies which downstream services failed when upstream pods were terminated. Infrastructure dashboards surface CPU and memory saturation when resource chaos attacks run. The combination of chaos fault injection and unified observability creates confidence that systems behave correctly under production stress.
Integration requires adding OpenTelemetry or Prometheus exporters to chaos experiment pods. CubeAPM ingests telemetry at $0.15/GB with unlimited retention and no per-user fees. Unlike SaaS observability platforms that charge per host or seat, CubeAPM’s flat ingestion pricing removes cost unpredictability as chaos testing scales. Full deployment and integration details are available in the CubeAPM Kubernetes monitoring documentation.
Chaos experiments fail if teams cannot observe system behavior under stress. A fault injection tool without deep observability is like running medical tests without recording the results. CubeAPM closes that gap by providing the monitoring depth that validates whether chaos testing reveals real vulnerabilities or confirms resilience. Teams using CubeAPM during chaos experiments reduce mean time to recovery by correlating faults with application traces, infrastructure metrics, and error patterns in one unified platform.
Cost Breakdown: What Chaos Engineering Tools Really Cost at Scale
Chaos engineering tool pricing varies widely based on model type. Open source tools like Litmus and Chaos Mesh are free but require engineering time for setup, experiment creation, and maintenance. Commercial tools charge per host, per experiment minute, or custom enterprise contracts. Understanding total cost of ownership requires factoring both license fees and engineering hours.
Gremlin charges $50 per host per month on annual contracts. A 100-node Kubernetes cluster costs $5,000/month or $60,000/year before volume discounts. Enterprise features and support add undisclosed premiums.
AWS FIS charges $0.10 per minute per action. A 10-minute experiment terminating 20 EC2 instances in parallel costs $20.00. Running daily chaos tests across multiple AWS accounts accumulates $600/month minimum.
Azure Chaos Studio charges $0.20 per experiment minute. A 15-minute VM shutdown experiment targeting 10 VMs costs $30.00. Weekly chaos testing for 4 weeks costs $120/month per environment.
Litmus (open source) is free to deploy but requires Kubernetes expertise, YAML authoring, and ongoing experiment maintenance. Budget 40 to 80 engineering hours for initial setup and 10 to 20 hours monthly for experiment iteration. At a $150/hour engineering rate, first-year cost is $18,000 to $42,000 in labor.
CubeAPM observability during chaos experiments costs $0.20/GB ingested. A mid-sized team ingesting 10TB/month of traces, logs, and metrics pays $2,000/month with no per-user or per-host surcharges. This pricing remains constant regardless of chaos experiment frequency or infrastructure scale.
Cost estimates are based on publicly available pricing as of April 2026. Enterprise discounts, volume commitments, and negotiated contracts can significantly reduce per-unit costs. Verify current pricing directly with each vendor before procurement decisions.
Common Pitfalls in Chaos Engineering Adoption
Teams adopting chaos engineering make predictable mistakes that reduce experiment value or cause unintended production impact. The most common failures are running chaos without proper observability, testing outside production environments, injecting faults without defined success criteria, and failing to establish automatic rollback mechanisms.
Chaos experiments without observability are blind tests. Teams inject faults but cannot measure system response. This defeats the purpose of chaos testing, which is to validate that systems detect failures, alert correctly, and recover automatically. Always pair chaos tools with full-stack monitoring like CubeAPM, Datadog, or Linux application monitoring platforms that capture application traces, infrastructure metrics, and error rates during experiments.
Testing only in staging environments produces false confidence. Staging never replicates production scale, traffic patterns, or infrastructure diversity. Chaos experiments must run in production with proper targeting and safety controls. Use Kubernetes namespace isolation, feature flags, and canary deployments to limit blast radius during production chaos testing.
Experiments without defined success criteria waste engineering time. Before injecting faults, document what should happen. Example: “When 2 out of 3 database replicas fail, the application should continue serving requests with elevated latency but zero errors.” Measure actual behavior against expected behavior and document gaps.
Manual rollback during failed experiments increases incident duration. Chaos tools like Litmus, Steadybit, and AWS FIS support automatic stop conditions based on monitoring alerts. Configure CloudWatch alarms, Prometheus alerts, or CubeAPM thresholds to halt experiments when systems become unhealthy. Automatic rollback prevents chaos experiments from becoming outages.
Another failure mode is testing the wrong components. Teams often inject chaos into stateless microservices that recover automatically but ignore single points of failure like databases, message queues, and API gateways. Focus chaos testing on components where failure causes cascading impact. Use service dependency maps to identify critical paths and test those first.
Finally, teams abandon chaos engineering after a single failed experiment causes production impact. Chaos engineering is iterative. Start with low-risk experiments in isolated environments, validate safety controls, then expand to higher-risk scenarios. Build organizational muscle memory through GameDays and incident reviews. Treat chaos engineering as continuous practice, not a one-time project.
Disclaimer: The information in this article reflects the latest details available at the time of publication and may change as technologies and products evolve. Features, pricing, and plan limits can change over time. Always verify the latest information directly with the vendor before making purchasing or deployment decisions.
Frequently Asked Questions
What is the best chaos engineering tool for Kubernetes?
Litmus and Chaos Mesh are the top open source Kubernetes native chaos tools, both CNCF projects with strong community support. Gremlin offers the best commercial platform for teams needing enterprise guardrails and support. CubeAPM provides the observability layer needed to monitor chaos experiments across Kubernetes pods, nodes, and services.
How much do chaos engineering tools cost?
Open source tools like Litmus and Chaos Mesh are free but require engineering time for setup and maintenance. Commercial tools range from $50 per host per month (Gremlin) to $0.10 to $0.20 per experiment minute (AWS FIS, Azure Chaos Studio). Total cost of ownership includes both licensing and engineering hours.
Do I need chaos engineering if I already have monitoring?
Yes. Monitoring tells you when failures happen. Chaos engineering validates that monitoring detects failures correctly, alerts fire as expected, and systems recover automatically. The two practices are complementary, not redundant.
Can chaos engineering cause production outages?
Improperly configured chaos experiments can cause outages if safety controls are missing. Use automatic rollback via monitoring alerts, start experiments in isolated namespaces, and test during low traffic periods. Tools like Gremlin, Steadybit, and AWS FIS provide built in safety mechanisms.
Should I run chaos experiments in production or staging?
Production. Staging environments never replicate production scale, traffic patterns, or infrastructure diversity. Use namespace isolation, canary deployments, and automatic rollback to limit blast radius during production chaos testing.
How does CubeAPM help with chaos engineering?
CubeAPM provides the unified observability layer that chaos experiments depend on to validate system behavior under stress. It captures distributed traces, infrastructure metrics, Kubernetes pod health, and error rates in real time during fault injection. CubeAPM runs on premises to eliminate data egress costs and keep telemetry local.
What is the difference between chaos engineering and fault injection?
Fault injection is the technical act of introducing failures. Chaos engineering is the discipline of using fault injection systematically to validate resilience hypotheses, measure system behavior, and improve architecture. Chaos engineering includes experiment design, observability, analysis, and continuous improvement.