










Apache Airflow orchestrates data pipelines for 85.5% of ETL/ELT workflows according to the 2024 Airflow Survey, but monitoring those pipelines introduces a new problem: visibility gaps that only appear after DAGs run in production. Task failures cascade silently, scheduler bottlenecks emerge under load, and worker pool saturation causes unpredictable delays.
Built-in Airflow UI metrics show DAG status and task duration, but they do not surface why a task failed, how infrastructure behaved during execution, or what external dependencies caused latency. Most production Airflow environments need observability that connects DAG runs to infrastructure metrics, logs, distributed traces, and external API calls.
This guide compares 8 Airflow monitoring tools across pricing models, signal depth (metrics, logs, traces, infrastructure), deployment options, and integration complexity. Each tool is evaluated on how well it handles task failure diagnosis, scheduler health tracking, worker pool monitoring, and cross-service tracing for data pipelines that call external APIs or services.
Quick Comparison: 8 Airflow Monitoring Tools at a Glance
| Tool | Best For | Pricing Model | OTel Native? | Self-hosted? |
|---|---|---|---|---|
| CubeAPM | Full stack Airflow + infra + traces in one platform | $0.20/GB · unlimited users | ✓ Native | ✓ Self-hosted |
| Datadog | Managed monitoring with pre-built Airflow dashboards | $31/host/month + $0.10/GB logs | Partial | ✗ SaaS only |
| Prometheus + Grafana | Teams already running Prometheus and want customization | Free OSS · DIY infra cost | ✓ Native | ✓ Self-hosted |
| New Relic | Logs + APM in broader observability platform | $0.40/GB beyond 100 GB free | Strong | ✗ SaaS only |
| Dynatrace | Enterprise AI-assisted root cause analysis | Host-based · starts $74/host/month | Partial | ✓ On-prem option |
| Sentry | Error tracking for Python task exceptions | Free tier · Team $26/month | Strong | ✗ SaaS only |
| Better Stack | Fast setup for startup teams with simple pipelines | Free tier · paid from $29/month | ✓ Native | ✗ SaaS only |
| Elastic APM | Teams already on ELK stack for log centralization | Free OSS · Elastic Cloud $95/month | Partial | ✓ Self-hosted |
Pricing estimates based on standardized profile: 50 hosts running Airflow, 10 TB/month telemetry, 30-day retention. Figures are directional based on public rate cards as of April 2026. Verify current rates with each vendor.
Why Built-in Airflow Monitoring Is Not Enough
Airflow ships with basic observability: the web UI shows DAG run history, task durations, and failure states. StatsD integration exports counters and gauges for scheduler lag, task success rate, and pool utilization. These give surface-level visibility but break down in three common production scenarios.
Scenario 1: Task fails with a generic timeout. The Airflow UI shows the task failed. Logs show “task exceeded timeout.” What caused it? Was the database slow? Did an external API hang? Without correlated infrastructure metrics and distributed traces, you guess.
Scenario 2: Scheduler becomes unresponsive during peak load. DAGs stop scheduling. The UI is slow. StatsD shows high scheduler.heartbeat latency, but not why. Did the metadata database connection pool saturate? Did a rogue DAG with 10,000 tasks flood the scheduler? You restart the scheduler and hope.
Scenario 3: Worker pool saturation causes unpredictable delays. Tasks queue longer than expected. Some complete fast, others wait 20 minutes. Worker metrics show CPU at 60%, memory at 40%. What is bottlenecking task assignment? CeleryExecutor broker lag? KubernetesExecutor pod scheduling delays? The built-in metrics do not tell you.
Production Airflow monitoring needs four signal types that built-in tools do not provide together: infrastructure metrics (CPU, memory, disk I/O for scheduler, workers, database), application traces (task execution spans, external API calls, database queries), structured logs (task stdout/stderr, scheduler decisions, executor events), and real-time alerting (task SLA breaches, scheduler lag anomalies, worker saturation).
1. CubeAPM
CubeAPM provides full-stack observability for Airflow environments with unified metrics, logs, traces, and infrastructure monitoring deployed inside your own cloud or on-premises. It runs as a managed service in your VPC, keeping all Airflow telemetry data within your infrastructure with no external egress.
Key Features:
- Native OpenTelemetry collection for Airflow StatsD metrics, task logs, and execution traces
- Automatic correlation of task failures with infrastructure metrics (scheduler CPU spikes, database connection pool exhaustion)
- Pre-built dashboards for DAG run duration, task success rate, scheduler lag, and worker pool health
- Trace spans for external API calls made during task execution with full context linking back to DAG and task instance
- Unlimited retention at $0.20/GB with no separate fees for indexing, users, or hosts
Pricing: $0.20/GB data ingestion. For a 50-host Airflow cluster generating 10 TB/month of metrics, logs, and traces, total monthly cost is approximately $2,000. No per-seat fees, no per-host charges, no egress costs.
Pros:
- Single platform for Airflow metrics, task logs, infrastructure monitoring, and distributed tracing
- Self-hosted deployment keeps sensitive DAG logs and metadata inside your VPC
- Flat pricing model with no surprise overages from high cardinality metrics or verbose task logs
- Fast search across all telemetry types with automatic indexing
Cons:
- Requires BYOC deployment; your team provisions the infrastructure
- No autonomous anomaly detection; alerts require manual threshold configuration
- Smaller ecosystem compared to Datadog or New Relic for third-party integrations
Best for: Teams running Airflow at scale that need full stack observability with data sovereignty and predictable pricing.
2. Datadog
Datadog offers a managed Airflow integration with pre-built dashboards, automatic metric collection via the Datadog Agent, and anomaly detection. The platform correlates Airflow metrics with logs, APM traces, and infrastructure monitoring across your entire stack.
Key Features:
- Datadog Airflow integration collects StatsD metrics automatically
- Pre-built dashboards for DAG success rates, task durations, scheduler performance, and executor health
- Log collection from Airflow task stdout/stderr with automatic parsing
- APM tracing for Python operators if you instrument with ddtrace
- Anomaly detection alerts for scheduler lag, task failure spikes, and pool saturation
Pricing: Infrastructure monitoring at $18/host/month for 50 hosts equals $900/month. APM at $42/host/month adds $2,100/month. Log ingestion at $0.10/GB for 5 TB/month adds $500/month. Total estimated cost: $3,500/month before data egress fees, which add approximately $0.10/GB when logs leave your cloud to Datadog.
Pros:
- Fully managed SaaS with zero infrastructure overhead
- Strong ecosystem with 700+ integrations for downstream systems Airflow orchestrates
- Powerful dashboarding and anomaly detection out of the box
- Comprehensive APM for Python task execution if instrumented
Cons:
- Per-host pricing compounds fast as Airflow clusters scale to 100+ workers
- Log ingestion costs escalate with verbose DAGs that log heavily during execution
- Data egress fees when sending logs and metrics from your cloud to Datadog SaaS
- No on-premises deployment; all telemetry leaves your infrastructure
Users on r/dataengineering report Datadog bills jumping from $2,000 to $8,000/month after scaling worker pools during peak ingestion windows.
Best for: Large enterprises already standardized on Datadog for infrastructure monitoring who need turnkey Airflow visibility.
3. Prometheus + Grafana
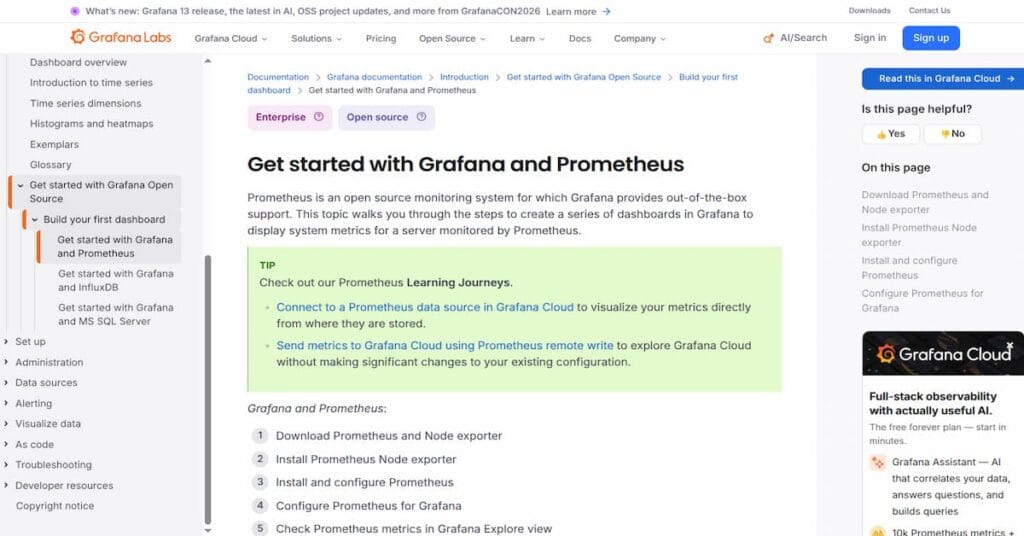
Prometheus scrapes Airflow StatsD metrics via an exporter, stores them as time series data, and Grafana visualizes them in custom dashboards. This open-source stack gives full control over metrics collection, retention, and alerting rules.
Key Features:
- Airflow Prometheus exporter converts StatsD metrics to Prometheus format
- Full control over metric retention policies and storage backend
- Grafana dashboards for DAG run frequency, task duration percentiles, scheduler heartbeat lag, and worker queue depth
- Alertmanager integration for routing alerts to Slack, PagerDuty, or email
- Compatible with existing Prometheus setups for unified infrastructure monitoring
Pricing: Free open-source software. Infrastructure cost depends on your deployment. A modest Prometheus + Grafana setup for 50 hosts typically costs $200 to $500/month in compute and storage on AWS or GCP.
Pros:
- Zero vendor lock-in, full control over telemetry data
- Highly customizable dashboards and alerting rules
- Strong community support and extensive documentation
- No per-host or per-GB fees, only infrastructure cost
Cons:
- Prometheus does not natively collect logs or traces; it requires additional tooling like Loki and Tempo
- Steep learning curve for teams unfamiliar with PromQL query language
- Manual setup required for exporters, dashboards, and alert rules
- No automatic correlation between Airflow metrics and infrastructure events
Best for: Engineering teams already running Prometheus and Grafana who want full control over Airflow monitoring without SaaS costs.
4. New Relic

New Relic provides Airflow monitoring through its logs, APM, and infrastructure products. Airflow logs are ingested via the New Relic logging agent, and APM traces Python task execution if you instrument with the New Relic Python agent.
Key Features:
- Log ingestion from Airflow scheduler, workers, and task output
- APM tracing for Python operators instrumented with the New Relic agent
- Infrastructure monitoring for hosts running Airflow components
- Query language (NRQL) for custom dashboards and alerts
- Anomaly detection for log patterns and metric spikes
Pricing: New Relic charges $0.40/GB for logs beyond the first 100 GB free per month. For 10 TB/month, that equals $4,000/month in log ingestion alone. Add infrastructure monitoring and APM, total cost approaches $6,000 to $8,000/month for a mid-sized Airflow environment.
Pros:
- Unified platform for logs, metrics, APM, and infrastructure
- Strong log search and pattern analysis
- Good integration with cloud platforms like AWS, GCP, Azure
- Real-time alerting with flexible notification channels
Cons:
- Expensive at scale; log ingestion costs grow linearly with verbose DAGs
- NRQL query language creates lock-in; dashboards not portable
- SaaS only deployment, no on-premises option for regulated industries
- Per-seat fees for full platform users compound as teams grow
A Reddit thread documents New Relic bills increasing from $1,200 to $7,500/month after adding detailed task logging across 200 DAGs.
Best for: Teams already using New Relic for broader application monitoring who want Airflow visibility in the same platform.
5. Dynatrace
Dynatrace offers AI-powered observability with automatic discovery of Airflow components, anomaly detection, and root cause analysis. It monitors infrastructure, application performance, and logs with minimal manual configuration.
Key Features:
- OneAgent automatically discovers Airflow scheduler, workers, and database dependencies
- AI engine (Davis) correlates task failures with infrastructure anomalies
- Full stack monitoring including host metrics, process details, and network traffic
- Log ingestion with automatic parsing and anomaly detection
- APM for Python tasks if instrumented with OneAgent
Pricing: Dynatrace pricing starts at approximately $74/host/month for full stack monitoring. For 50 hosts, that equals $3,700/month. Add log ingestion at $0.20/GiB for 10 TB/month ($2,048/month), total cost approaches $5,750/month before add-ons like synthetic monitoring or session replay.
Pros:
- Strong AI-driven root cause analysis reduces manual investigation time
- Automatic dependency mapping shows how Airflow components interact
- Comprehensive infrastructure monitoring with deep process visibility
- On-premises deployment option available for regulated environments
Cons:
- Expensive at scale; per-host pricing compounds with large worker pools
- Complex pricing model with multiple SKUs for different features
- Steeper learning curve compared to simpler tools like Better Stack
- Overkill for small teams running basic Airflow pipelines
Best for: Enterprise teams with complex Airflow environments who need AI-assisted troubleshooting and have budget for premium tooling.
6. Sentry
Sentry specializes in error tracking for Python applications, making it a natural fit for capturing exceptions thrown by Airflow tasks. It surfaces stack traces, contextual variables, and error frequency to help debug task failures.
Key Features:
- Python SDK captures unhandled exceptions in Airflow operators
- Stack traces with local variable context for failed tasks
- Error grouping by fingerprint to identify recurring issues
- Breadcrumbs showing execution flow leading up to errors
- Integrations with Slack, Jira, GitHub for incident response
Pricing: Free tier includes 5,000 errors/month. Team plan at $26/month covers 50,000 errors/month. Business plan pricing scales with error volume, typically $80 to $200/month for mid-sized Airflow environments.
Pros:
- Fast setup, add Sentry SDK to Airflow task code in minutes
- Excellent error context with stack traces and local variables
- Low cost for error-only monitoring compared to full observability platforms
- Strong Python ecosystem support
Cons:
- Covers only errors, no metrics, logs, or infrastructure monitoring
- Does not track scheduler health, worker pool saturation, or DAG execution times
- Requires code instrumentation in every task that you want monitored
- SaaS only, no self-hosted option for sensitive environments
Best for: Small teams that need fast error tracking for Airflow tasks without investing in full observability infrastructure.
7. Better Stack
Better Stack provides uptime monitoring, log management, and incident response in a developer-friendly interface. For Airflow, it collects logs from tasks and the scheduler, alerts on failures, and provides centralized log search.
Key Features:
- Log collection from Airflow via syslog or HTTP ingestion
- Real-time alerts for task failures, scheduler downtime, or custom log patterns
- Incident management workflow with on-call scheduling and escalation
- Uptime monitoring for Airflow webserver and scheduler endpoints
- Integrations with Slack, PagerDuty, Opsgenie for notifications
Pricing: Free tier includes 1 GB of logs/month. Paid plans start at $29/month for 10 GB logs/month and scale to $149/month for 100 GB/month. For 500 GB/month (typical for mid-sized Airflow), cost is approximately $500/month.
Pros:
- Clean, fast UI optimized for log search and incident response
- Simple pricing with no per-host or per-user fees
- Quick setup; integrate Airflow logs in under 30 minutes
- Good uptime monitoring for Airflow web UI and API endpoints
Cons:
- Limited metrics collection, focuses primarily on logs and uptime checks
- No APM or distributed tracing for task execution
- Does not monitor infrastructure (CPU, memory, disk) for scheduler or workers
- SaaS only, no self-hosted deployment option
Best for: Startup teams running lightweight Airflow pipelines who need fast log search and incident alerting without infrastructure monitoring.
8. Elastic APM
Elastic APM integrates with the Elastic Stack (Elasticsearch, Logstash, Kibana) to provide application performance monitoring, log aggregation, and infrastructure metrics. For Airflow, it collects logs via Filebeat or Logstash, metrics via Metricbeat, and Python traces via the Elastic APM agent.
Key Features:
- Centralized log storage in Elasticsearch with full-text search
- Metricbeat collects system metrics from Airflow hosts
- Elastic APM Python agent traces task execution with distributed tracing
- Kibana dashboards for visualizing DAG runs, task durations, and error rates
- Machine learning features for anomaly detection in logs and metrics
Pricing: Free open source version includes all core features. Elastic Cloud starts at $95/month for managed Elasticsearch with 8 GB RAM and 240 GB storage. For larger Airflow environments generating 10 TB/month, Elastic Cloud costs scale to $1,000 to $2,000/month depending on retention and query volume.
Pros:
- Powerful log search with Elasticsearch full-text indexing
- Unified platform for logs, metrics, APM, and infrastructure
- Self-hosted option available for data sovereignty
- Strong community and extensive plugin ecosystem
Cons:
- Steep learning curve; Elastic Stack setup and tuning requires expertise
- Resource-intensive; Elasticsearch clusters need significant CPU and memory
- Complex pricing on Elastic Cloud with multiple variables (storage, ingestion, queries)
- APM tracing requires manual instrumentation in Python tasks
Best for: Teams already running the ELK stack for centralized logging who want to extend it with Airflow metrics and APM.
How to Choose the Right Airflow Monitoring Tool
Selecting an Airflow monitoring tool depends on five factors: team size and budget, deployment model (SaaS vs. self-hosted), observability depth needed (metrics only vs. full stack), integration complexity, and existing tooling.
For teams under 10 engineers with simple pipelines, Better Stack or Sentry provide fast setup and low cost. Better Stack covers logs and uptime monitoring. Sentry focuses on error tracking. Both integrate in under an hour and cost less than $100/month for small scale Airflow environments.
For mid-sized teams (10 to 50 engineers) running production data pipelines, CubeAPM or Datadog offer full-stack observability with infrastructure monitoring, logs, and traces. CubeAPM costs 60% less than Datadog at scale and keeps data in your VPC. Datadog provides broader integrations and fully managed service if budget allows.
For large enterprises with complex Airflow orchestration, Dynatrace or Elastic APM deliver deep visibility with AI-assisted root cause analysis (Dynatrace) or powerful log search (Elastic). Both support on-premises deployment for regulated industries. Expect $5,000 to $10,000/month for 50+ host environments.
For teams already running Prometheus and Grafana, extend your existing Prometheus setup with the Airflow StatsD exporter. Add Loki for logs and Tempo for traces if needed. This keeps monitoring open source and avoids SaaS vendor lock-in, but requires DIY setup and maintenance.
For teams with strict data residency or compliance requirements, CubeAPM, Elastic APM (self-hosted), or Prometheus + Grafana allow full control over where telemetry data resides. All three support deployment inside your VPC or on-premises data center with no external data egress.
Migrating from Built-in Airflow Monitoring to a Full Observability Platform
Most teams start with Airflow UI and StatsD metrics, then hit a wall when troubleshooting task failures or scheduler bottlenecks in production. Migration to a dedicated observability tool typically follows this sequence.
Phase 1: Add metrics collection. Deploy a metrics exporter (Prometheus, Datadog Agent, or OpenTelemetry Collector) to scrape Airflow StatsD metrics. Configure basic dashboards for DAG run success rate, task duration percentiles, and scheduler lag. This phase takes 1 to 2 days and immediately surfaces high-level trends.
Phase 2: Centralize logs. Configure Airflow to ship task logs and scheduler logs to your observability platform via Filebeat, Fluentd, or native log forwarding. Enable log search and create alerts for common error patterns (database timeouts, external API failures). This phase takes 2 to 5 days depending on log volume and retention requirements.
Phase 3: Add infrastructure monitoring. Install agents (Datadog Agent, Prometheus Node Exporter, or OpenTelemetry Collector) on scheduler and worker hosts to collect CPU, memory, disk I/O, and network metrics. Correlate infrastructure spikes with task failures or scheduler lag. This phase takes 1 to 3 days.
Phase 4: Instrument for distributed tracing. Add APM agents (OpenTelemetry, Datadog ddtrace, or New Relic) to Python operators that call external APIs or databases. This surfaces end-to-end latency for data pipeline tasks and pinpoints slow dependencies. This phase takes 3 to 7 days depending on codebase size and number of custom operators.
Total migration timeline: 1 to 3 weeks with zero downtime if done incrementally. Run the new observability stack in parallel with built-in Airflow monitoring until validated.
Frequently Asked Questions
What metrics should I monitor for Airflow in production?
Track DAG run success rate, task duration by operator type, scheduler heartbeat latency, executor queue depth, worker CPU and memory utilization, database connection pool usage, and task failure rate by DAG. Set alerts for scheduler lag exceeding 10 seconds, task success rate dropping below 95%, and worker CPU sustained above 80%.
How much does Airflow monitoring typically cost?
For a 50-host cluster generating 10 TB/month telemetry, expect around $2,000/month with CubeAPM or Prometheus, $3,500 to $5,000/month with Datadog, $6,000 to $8,000/month with New Relic or Dynatrace. Costs scale with host count, log verbosity, and retention period.
Can I monitor Airflow with Prometheus and Grafana for free?
Yes, both are open source. Install the Airflow Prometheus StatsD exporter, configure Prometheus to scrape it, and build Grafana dashboards. Infrastructure cost for a basic setup is $200 to $500/month on AWS or GCP. You own all data and avoid SaaS vendor lock-in.
Does CubeAPM support Airflow monitoring?
Yes, CubeAPM collects Airflow metrics via OpenTelemetry, ingests task logs, monitors scheduler and worker infrastructure, and traces Python task execution. It correlates all signals in one platform deployed inside your cloud at $0.20/GB with unlimited retention.
What is the difference between Airflow monitoring and observability?
Monitoring tracks known metrics like task success rate and scheduler lag. Observability adds logs, traces, and infrastructure context to diagnose unknown failures. Full observability answers why a task failed, not just that it failed.
How do I monitor Airflow scheduler performance?
Collect scheduler.heartbeat metric to track responsiveness, dag_processing metrics to measure DAG parsing time, and pool utilization to detect bottlenecks. Monitor metadata database connection pool exhaustion and CPU usage spikes that indicate scheduler overload.
Should I use Datadog or CubeAPM for Airflow monitoring?
Datadog offers broader integrations and a fully managed service but costs 60% more at scale and requires all telemetry to leave your cloud. CubeAPM provides comparable observability depth at lower cost with self-hosted deployment inside your VPC. Choose based on budget and data residency requirements.
Disclaimer: The information in this article reflects the latest details available at the time of publication and may change as technologies and products evolve. Features, pricing, and plan limits can change over time. Always verify the latest information directly with the vendor before making purchasing or deployment decisions.