The main difference between Amazon CloudWatch, Dynatrace, and CubeAPM is that Amazon CloudWatch is a fully managed AWS-native monitoring service optimized for AWS workloads, Dynatrace is an AI-driven full-stack observability platform built around automatic instrumentation and enterprise-scale analytics, and CubeAPM is an OpenTelemetry-native observability backend designed for unified signal control and predictable ingestion-based pricing.
Amazon CloudWatch is tightly integrated into the AWS ecosystem, making it a natural fit for teams operating primarily inside AWS. Dynatrace focuses on automatic discovery, topology mapping, and AI-assisted root cause analysis across complex enterprise systems. CubeAPM centers on OpenTelemetry-native ingestion, centralized smart sampling to control trace volume without sacrificing visibility, and consistent cross-environment telemetry semantics without being tied to a single cloud provider.
This article compares Amazon CloudWatch vs Dynatrace vs CubeAPM across deployment model, MELT coverage, sampling strategy, retention control, cost behavior, and operational ownership in production environments.
Amazon CloudWatch vs Dynatrace vs CubeAPM: Feature Comparison
The comparison below is based on publicly available documentation and typical production deployment patterns. Actual pricing, retention, and sampling behavior may vary depending on configuration and workload characteristics.
| Features | CubeAPM | AWS CloudWatch | Dynatrace |
| Known for | OpenTelemetry-native observability with predictable costs | Deeply integrated AWS monitoring service aligned with IAM, regions, and native AWS telemetry | Enterprise-grade full-stack observability with automated discovery |
| Multi-Agent Support | Yes (OTel, New Relic, Datadog, Elastic) | Limited (CloudWatch Agent, AWS SDKs, OpenTelemetry, AWS X-Ray) | Limited (OpenTelemetry,OneAgent SDK) |
| MELT Support | Full MELT | Full MELT | Full MELT |
| Setup | Self-hosted but vendor-managed | SaaS (Fully managed AWS service) | SaaS & Self-hosted |
| Pricing | Ingestion-based pricing of $0.15/GB | Logs: $0.50 per GB Traces(Over 30TB): $0.15/GB | Infra: $29 /mo per host* Full-Stack: $58/mo/ 8 GiB host* |
| Sampling Strategy | Smart sampling (95% compression) | Tail-based + Adaptive | Tail + Head-based + adaptive traffic management |
| Log Retention | Unlimited Retention | Logs: Indefinite retention | Log monitoring: 35 days |
| Support TAT | < 10 minutes | Enterprise Plan: 15 minutes | 30 minutes to 4 days |
Amazon CloudWatch vs Dynatrace vs CubeAPM: Feature-by-Feature Breakdown
Known For
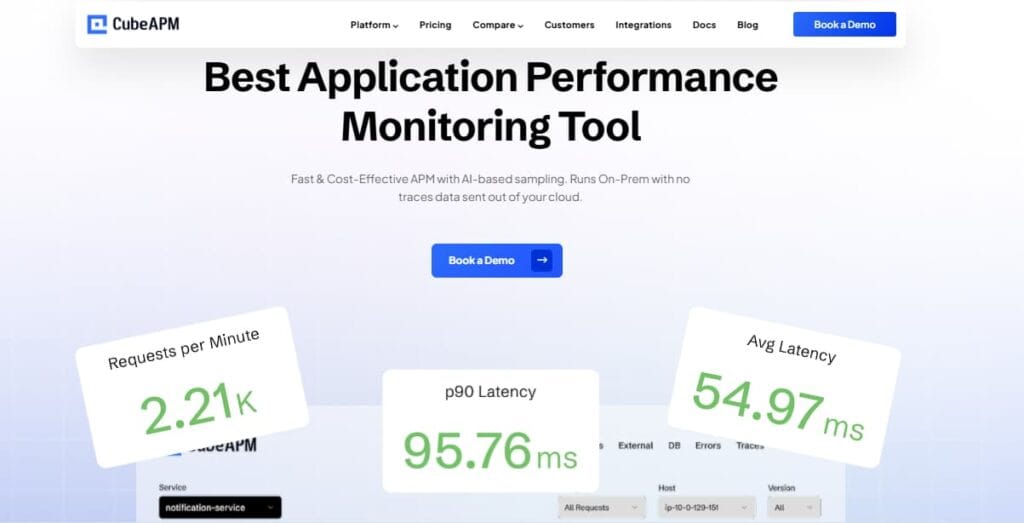
CubeAPM: Built around an OpenTelemetry-first architecture. Instead of centering around a proprietary agent model, it focuses on ingesting standardized telemetry and correlating metrics, events, logs, and traces within a unified backend. The platform emphasizes smart sampling control and predictable ingestion-based pricing, making it architecturally aligned with multi-cloud and Kubernetes-heavy environments.
Amazon CloudWatch: Known as the native monitoring and observability service within AWS. It automatically collects metrics and logs from AWS services and integrates tightly with IAM, regional deployments, and AWS-native alarms. For organizations operating primarily inside AWS, CloudWatch provides seamless service-level visibility without additional infrastructure management.
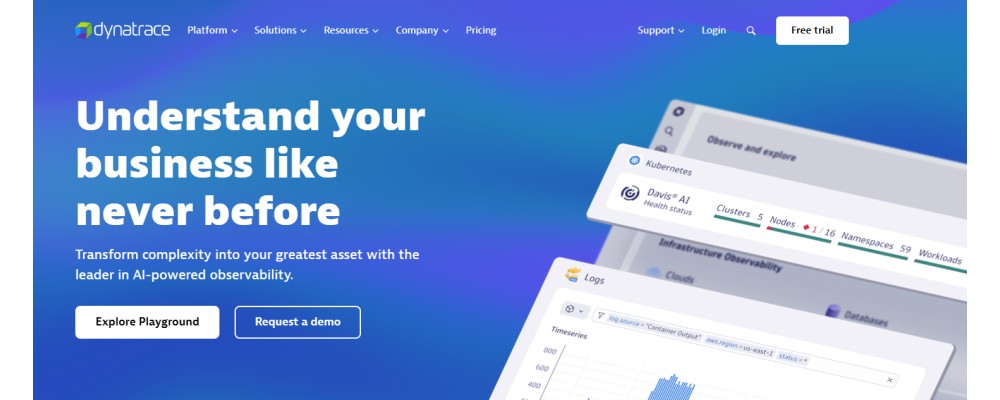
Dynatrace: Recognized for its AI-driven full-stack observability approach. Its OneAgent automatically instruments applications, infrastructure, and services, building a real-time topology map of dependencies. The platform’s core strength lies in automated discovery, anomaly detection, and root cause analysis across complex enterprise systems.
Multi-Agent Support
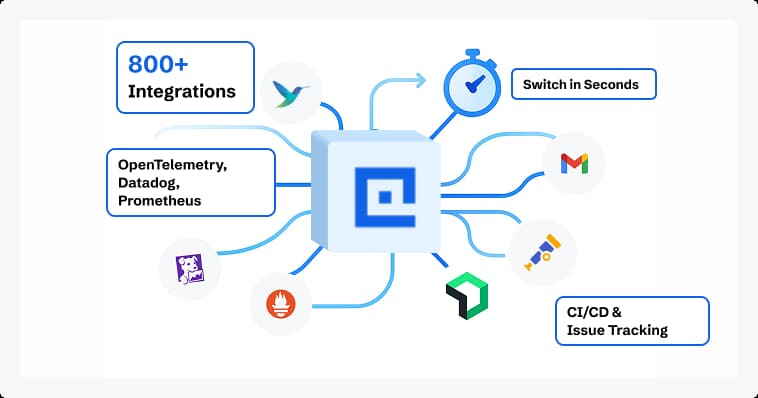
CubeAPM: Designed for heterogeneous environments and OpenTelemetry-native ingestion. It accepts telemetry from OpenTelemetry collectors and SDKs and can ingest data generated by existing vendor agents such as New Relic, Datadog, and Elastic. This allows teams to migrate incrementally without immediate re-instrumentation, supporting mixed-agent environments during transition phases.
Amazon CloudWatch: Collects telemetry through the CloudWatch Agent, AWS Distro for OpenTelemetry, and AWS X-Ray for distributed tracing. Applications can be instrumented using OpenTelemetry, and telemetry can be exported into AWS-native monitoring services. This enables standardized instrumentation while maintaining tight integration with AWS service metadata, IAM policies, and regional deployments.
Dynatrace: Provides automatic instrumentation through its OneAgent and fully supports OpenTelemetry for metrics, logs, and traces. Teams can use OpenTelemetry SDKs and collectors alongside Dynatrace ingestion pipelines. This flexibility allows organizations to adopt open standards while leveraging Dynatrace’s automated topology discovery, dependency mapping, and analytics capabilities.
MELT Support
CubeAPM: Provides unified coverage across metrics, events, logs, and traces within a single backend built on OpenTelemetry semantics. Signals share consistent resource attributes and trace context, enabling direct navigation from high-level metrics to correlated traces and logs within the same platform. Because all telemetry is processed under a consistent data model, cross-signal investigation does not require reconciling separate indexing systems or schema translations.
Amazon CloudWatch: Supports metrics, logs, events, and distributed traces through CloudWatch Metrics, CloudWatch Logs, CloudWatch Events, and AWS X-Ray. All four signal types are available within the AWS ecosystem, allowing teams to monitor infrastructure, applications, and service interactions using native AWS observability components. Signal analysis aligns closely with AWS service constructs, making it particularly suited for environments heavily centered on AWS-managed resources.
Dynatrace: Delivers full-stack MELT coverage through a unified platform. Metrics, logs, traces, and events are automatically correlated through its Smartscape topology model, which maps real-time service dependencies and infrastructure relationships. This topology-aware correlation enables automated root cause analysis and contextual navigation across layers without requiring manual trace-log stitching.
Deployment Model

CubeAPM: Operates as a self-hosted deployment with vendor-managed operations. Infrastructure runs within the customer’s environment, providing full control over data residency, storage, and access policies. Operational management, updates, and platform health are handled by the vendor, reducing internal overhead while preserving ownership of telemetry data. This model is particularly relevant for organizations with compliance, data sovereignty, or regulatory requirements.
Amazon CloudWatch: Delivered exclusively as a fully managed SaaS service within AWS. All infrastructure, scaling, and availability are handled by AWS, and customers do not manage observability backend components directly. This simplifies operations for AWS-centric environments but does not provide a self-hosted deployment option.
Dynatrace: Available as both SaaS and self-hosted through Dynatrace Managed. The SaaS model is operated by Dynatrace, while Dynatrace Managed allows deployment within customer-controlled infrastructure, including Kubernetes-supported environments. This provides flexibility for organizations that require data control while still leveraging Dynatrace’s full-stack observability capabilities.
Pricing: Approximate Cost for Small, Mid-Sized & Large Teams
*All pricing comparisons are calculated using standardized Small/Medium/Large team profiles defined in our internal benchmarking sheet, based on fixed log, metrics, trace, and retention assumptions. Actual pricing may vary by usage, region, and plan structure. Please confirm current pricing with each vendor.
*An APM host is a host that is actively generating trace data, and an Infra host is any physical or virtual OS instance that you monitor with any observability tool.
Below is a cost comparison for small, mid-sized, and large teams.
| Approx. Cost for Teams | Small (~30 APM Hosts) | Mid-sized (~125 APM Hosts) | Large (~250 APM Hosts) |
| CubeAPM | $2,080 | $7,200 | $15,200 |
| Amazon CloudWatch | $5,343.50 | $15,637 | $30,018 |
| Dynatrace | $7,740 | $21,850 | $46,000 |
What This Comparison Reveals at Scale
At small team sizes, cost differences between platforms exist but are rarely disruptive. Infrastructure footprints are limited, telemetry volume is manageable, and observability coverage is often focused on core services. At this stage, ecosystem alignment and deployment preference tend to weigh more heavily than long-term pricing behavior.
As organizations grow into mid-sized environments, pricing architecture begins to matter more than entry-level positioning. Increased service count, broader log retention, deeper trace coverage, and multi-environment duplication introduce compounding effects. The way a platform measures consumption, whether by host, ingestion, or enterprise licensing units, starts to materially influence total spend.
At large scale, the gap becomes structural. Kubernetes expansion, autoscaling volatility, distributed tracing depth, and environment replication amplify cost behavior across pricing models. Observability spend becomes less about feature access and more about how predictably the model handles growth under sustained production load.
The key takeaway is that observability cost is not tested at adoption. It is tested at scale. CTOs and DevOps leaders evaluating long-term sustainability must analyze how pricing behaves when infrastructure, telemetry volume, and operational complexity expand simultaneously.
CubeAPM: Cost for Small, Medium, and Large Teams
CubeAPM operates on a ingestion-based pricing model where observability spend scales with the amount of telemetry ingested. Rather than billing per host, per seat, or per feature tier, pricing is directly tied to data processed. This structure aligns cost with system activity instead of infrastructure footprint, which becomes increasingly important in Kubernetes and autoscaling environments.
Pricing:
- $0.15 per GB ingested
Using standardized workload assumptions across comparable production environments, estimated monthly costs typically fall into the following ranges:
- Small teams (~30 APM hosts): around $2,080
- Mid-sized teams (~125 APM hosts): around $7,200
- Large teams (~250 APM hosts): around $15,200
As environments expand, cost growth is primarily driven by telemetry design decisions such as log verbosity, sampling configuration, and retention policy. Because pricing scales with ingestion rather than host multiplication, forecasting remains stable even as clusters scale horizontally. This makes cost behavior more predictable as traffic, service count, and distributed tracing depth increase.
Amazon CloudWatch: Cost for Small, Medium, and Large Teams
Amazon CloudWatch follows a ingestion-based pricing model where costs are driven by telemetry volume across logs, metrics, and traces. Rather than a single pricing dimension, billing is distributed across multiple AWS services, including log ingestion, metric storage, API calls, and AWS X-Ray tracing.
Pricing typically includes:
- Logs: $0.50 per GB ingested
- Traces (AWS X-Ray): $0.15 per GB
Using standardized workload assumptions across comparable production environments, estimated monthly costs typically fall into the following ranges:
- Small teams (~30 APM hosts): $5,343.50
- Mid-sized teams (~125 APM hosts): $15,637
- Large teams (~250 APM hosts): $30,018
As environments scale, cost behavior becomes sensitive to telemetry verbosity, custom metric cardinality, trace depth, and retention configuration. Because pricing spans multiple AWS services rather than a single ingestion metric, forecasting requires modeling several consumption variables.
Dynatrace: Cost for Small, Medium, and Large Teams
Dynatrace uses a host-unit and consumption-based pricing model. Licensing is generally tied to monitored infrastructure capacity, including host size and application workload, along with additional usage components such as log ingestion.
Pricing typically includes:
- Infrastructure Monitoring: $29 per host per month
- Full-Stack Monitoring: $58 per host per month (per 8 GiB host)
Using standardized workload assumptions across comparable production environments, estimated monthly costs typically fall into the following ranges:
- Small teams (~30 APM hosts): around $7,740
- Mid-sized teams (~125 APM hosts): around $21,850
- Large teams (~250 APM hosts): around $46,000
As environments scale, cost growth reflects both infrastructure expansion and telemetry depth. Because licensing is linked to monitored host capacity, Kubernetes expansion, autoscaling groups, and multi-environment duplication directly influence spend. For large enterprise deployments, forecasting requires modeling infrastructure growth alongside telemetry consumption and enabled feature modules.
For a detailed breakdown of how Dynatrace pricing changes based on host size, environment scale, and enabled capabilities, you can estimate costs using our Dynatrace pricing calculator.
Sampling Strategy
CubeAPM: Uses centralized, context-aware smart sampling to reduce trace volume while preserving high-value requests. Sampling policies can evaluate attributes such as latency, error conditions, and service context rather than relying solely on fixed percentages. Because sampling is managed at the backend layer, adjustments can be made without redeploying instrumentation across services. This helps maintain stable ingestion behavior as traffic and service count grow.
Amazon CloudWatch: Relies on AWS X-Ray and AWS Distro for OpenTelemetry for distributed tracing. AWS supports advanced tail-based sampling, where sampling decisions are made after a trace completes, allowing selection based on latency or error conditions. AWS X-Ray also includes adaptive sampling, which dynamically adjusts sampling rates in response to traffic volume. This enables trace throughput to remain controlled during traffic spikes while preserving representative trace visibility.
Dynatrace: Supports both head-based and tail-based sampling, including OpenTelemetry collector-based configurations. In addition, Dynatrace incorporates adaptive traffic management to balance trace coverage with system load. Sampling decisions can be influenced by request characteristics such as duration or error state. This allows trace visibility to remain meaningful during high-volume conditions while managing ingestion overhead.
Data Retention
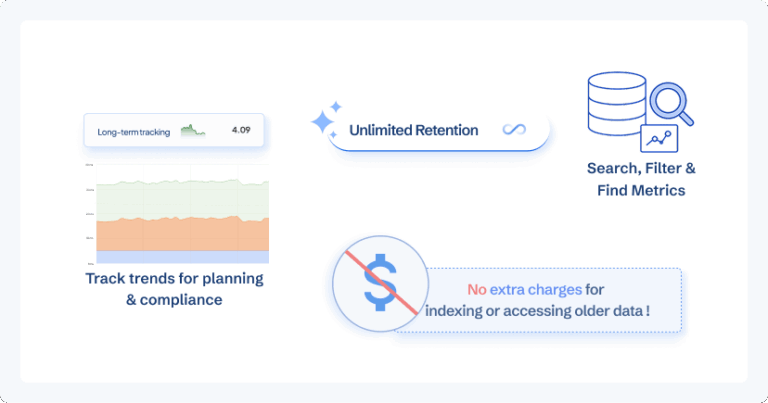
CubeAPM: Offers unlimited retention for metrics, logs, and traces. Retention policies are controlled at the platform level, allowing organizations to store telemetry for as long as operational, investigative, or compliance requirements demand. Because retention is not restricted by predefined signal tiers, teams can apply consistent policies across all telemetry types without separate expiration windows.
Amazon CloudWatch: Provides configurable retention for logs at the log group level, ranging from 1 day up to 10 years, with the option to retain logs indefinitely if no expiration is defined. Metric retention follows AWS-defined aggregation tiers: one-minute resolution metrics are retained for 15 days, five-minute resolution metrics for 63 days, and one-hour aggregated metrics for approximately 455 days. Retention policies are managed per service, meaning logs, metrics, and traces follow separate configurations rather than a single unified retention model.
Dynatrace: Retention periods vary by signal type and licensing tier. Log retention typically defaults to 35 days, metrics retention can extend up to 15 months depending on aggregation level, and distributed traces are commonly retained for up to 10 days under standard configurations. Retention settings can be adjusted based on plan and environment requirements, allowing organizations to balance historical visibility with storage considerations.
Support & Response Time (TAT)
CubeAPM: Provides direct support through Slack and email, with engineering-led assistance. For production-impacting issues, typical response times are under 10 minutes. Support is not segmented across multiple pricing tiers, allowing teams to access rapid assistance without navigating separate support contracts.
Amazon CloudWatch: Support for CloudWatch is delivered through AWS Support plans rather than as a standalone product service. Response times depend on the selected AWS Support tier and the severity classification of the issue. Under Enterprise Support, critical production-impacting cases have a target initial response time of 15 minutes. Business Support provides a target response time of under 1 hour for critical issues. Developer and Basic plans offer longer response targets. Response commitments vary based on both support tier and case severity.
Dynatrace: Support response times depend on the customer’s service agreement and issue severity. For the highest severity production incidents, Dynatrace offers target response times as low as 30 minutes for critical issues under enterprise support plans. Lower-severity issues have progressively longer response windows, which may extend to 4 business days for Standard support plans and 2 business daya for enterprise support.Support SLAs are tied to contractual support tiers and severity levels.
How Teams Evaluate These Platforms at Scale
As observability programs mature, evaluation shifts from feature comparison to architectural behavior under sustained load. Early decisions are often influenced by ecosystem familiarity or deployment convenience. At scale, the focus changes to operational stability, cost predictability, and governance control.
Infrastructure growth introduces nonlinear complexity. Kubernetes expansion increases service count. Autoscaling multiplies ephemeral compute. Distributed tracing depth grows with microservice fan-out. At this stage, teams begin asking different questions: How does pricing behave when traffic doubles? How does sampling adapt during incident spikes? How much operational effort is required to manage retention, cardinality, and telemetry sprawl?
Deployment flexibility also becomes more consequential. Organizations with regulatory requirements assess data residency and control. Multi-cloud environments evaluate telemetry standardization across platforms. Enterprise teams consider whether automated discovery, OpenTelemetry alignment, or native cloud integration better fits their architecture.
Ultimately, large-scale evaluation is less about feature breadth and more about long-term control. Platforms are assessed on how predictably they scale across infrastructure growth, how transparently they align cost with telemetry behavior, and how effectively they support production-grade incident response without introducing architectural or financial instability.
Amazon CloudWatch vs Dynatrace vs CubeAPM: Use Cases
Choose CubeAPM if:
- You operate Kubernetes-heavy or autoscaling environments and want cost to scale with telemetry volume rather than host multiplication.
- You require full control over data residency and retention for compliance or regulatory reasons.
- You are standardizing on OpenTelemetry and want a backend aligned with open instrumentation.
- You prefer predictable ingestion-based pricing with centralized sampling control.
- You value direct, engineering-led support with rapid response during production incidents.
Choose Amazon CloudWatch if:
- Your workloads run primarily inside AWS and depend on AWS-managed services.
- You want a fully managed SaaS monitoring solution with no additional operational overhead.
- You rely on native AWS integrations, IAM alignment, and service-level telemetry.
- Your operational workflows are built around AWS-native tooling and service constructs.
Choose Dynatrace if:
- You manage large, distributed enterprise environments requiring automatic topology discovery.
- You want AI-assisted anomaly detection and automated root cause analysis.
- You need deployment flexibility through both SaaS and Dynatrace Managed options.
- You prioritize full-stack observability with integrated analytics across infrastructure and applications.
Conclusion
Amazon CloudWatch, Dynatrace, and CubeAPM represent three distinct architectural approaches to observability.
CloudWatch is tightly integrated into the AWS ecosystem and is optimized for organizations operating primarily within AWS-managed environments. Dynatrace emphasizes automated discovery, AI-assisted analysis, and full-stack visibility across complex enterprise systems. CubeAPM centers on OpenTelemetry-native ingestion, centralized control over sampling and retention, and predictable volume-based pricing.
At small scale, differences between these platforms may appear incremental. As environments expand, however, architectural alignment becomes more important than feature lists. Kubernetes growth, autoscaling volatility, distributed tracing depth, and multi-environment duplication place pressure on pricing models, sampling strategies, retention policies, and operational ownership.
The right choice ultimately depends on where workloads run, how much infrastructure control is required, and how telemetry volume is expected to evolve. For CTOs and DevOps leaders, observability selection is less about short-term capability and more about long-term stability under sustained production scale.
Disclaimer: The information in this article reflects the latest details available at the time of publication and may change as technologies and products evolve.
FAQs
1. What is the main difference between Amazon CloudWatch, Dynatrace, and CubeAPM?
The main difference lies in architecture and deployment philosophy. Amazon CloudWatch is a fully managed AWS-native monitoring service optimized for AWS workloads. Dynatrace is an AI-driven full-stack observability platform with automated instrumentation and topology mapping. CubeAPM is an OpenTelemetry-native observability backend designed around ingestion-based pricing and centralized control over sampling and retention.
2. Which is better for Kubernetes environments: CloudWatch, Dynatrace, or CubeAPM?
All three support Kubernetes, but their approaches differ. CloudWatch integrates Kubernetes telemetry through AWS services and AWS Distro for OpenTelemetry. Dynatrace provides automatic discovery and dependency mapping across Kubernetes clusters. CubeAPM focuses on OpenTelemetry-native ingestion and centralized trace control, which can be beneficial in autoscaling and multi-cluster environments. The best choice depends on infrastructure ownership and scaling strategy.
3. Is Dynatrace more expensive than Amazon CloudWatch or CubeAPM?
Dynatrace typically uses host-unit and enterprise licensing models, which can increase costs as infrastructure expands. CloudWatch follows usage-based billing across logs, metrics, and traces. CubeAPM uses a predictable ingestion-based pricing model of $0.15 per GB. Cost differences become more pronounced as environments grow and telemetry volume increases.
4. Do Amazon CloudWatch, Dynatrace, and CubeAPM all support OpenTelemetry?
Yes. Amazon CloudWatch supports OpenTelemetry through AWS Distro for OpenTelemetry and integration with AWS X-Ray. Dynatrace fully supports OpenTelemetry ingestion alongside its native instrumentation. CubeAPM is built as an OpenTelemetry-native backend, using OTel semantics for metrics, logs, and traces.
5. Which platform offers the most predictable pricing at scale?
CubeAPM offers a more predictbale ingestion-based pricing tied directly to data processed. CloudWatch charges across multiple service dimensions. Dynatrace pricing depends on licensed host capacity and enabled capabilities.


