The main difference between Azure Monitor, Dynatrace, and CubeAPM is that Azure Monitor is a cloud-native monitoring service built primarily for Microsoft Azure environments. Dynatrace is an AI-driven enterprise SaaS observability platform designed for large-scale hybrid and multi-cloud systems.
CubeAPM is a self-hosted, OpenTelemetry-native observability platform focused on predictable ingestion-based pricing, unlimited data retention, and full data control inside your own cloud. Teams comparing these tools are usually balancing Azure integration, AI-powered automation, compliance requirements, cost predictability, and end-to-end tracing across distributed systems.
In this Azure Monitor vs Dynatrace vs CubeAPM comparison, we break down key differences in architecture, pricing models, deployment options, sampling strategies, retention policies, and real-world use cases.
Azure Monitor vs Dynatrace vs CubeAPM Comparison
The comparison below is based on publicly available vendor documentation, official pricing pages, and typical production deployment patterns. Actual pricing, sampling behavior, data retention windows, and support response times may vary depending on region, workload volume, configuration choices, enterprise agreements, and the specific plan or support tier selected.
| Feature | CubeAPM | Azure Monitor | Dynatrace |
| Known for | Unified MELT, native OTEL, self-hosting, cost predictability | Native Azure monitoring and diagnostics | Enterprise observability, AI-driven automation, deep visibility |
| Multi-Agent Support | Yes (OTel, New Relic, Datadog, Elastic, etc.) | Limited (Azure Monitor Agent, OTel) | Limited (OneAgent, OTel) |
| MELT Support | Full MELT coverage | Full MELT coverage | Full MELT coverage |
| Deployment | Self-hosted with vendor-managed | SaaS (Fully managed AWS service) | SaaS-based & self-managed |
| Pricing | Ingestion-based: $0.15/GB | Logs: $0.50/GBMetrics: $0.16/10 million samples ingested | Full-stack:$0.01/GiB-hour; infra:$0.04/ host-hour; Logs: $0.20/GiB; RUM: $0.00225/session |
| Sampling Strategy | Smart sampling, automated, context-aware | Fixed-percentage, rate-limited sampling | Adaptive Traffic Management (ATM), head/tail-based sampling via OTel |
| Data Retention | Unlimited Retention | Basic Logs: 30dCustom Metrics: 90d | Metrics: 15m; logs: 35d; Traces: 10d; RUM/synthetics: 35d |
| Support Channel & TAT | Slack, WhatsApp; response in minutes | Email, chat, phone; TAT: 8 hr to 15 min (plan-based) | Chat & web ticket; Standard: 4d-4 hrs; Enterprise: 2d-30min |
Azure Monitor vs Dynatrace vs CubeAPM: Feature Breakdown
Known for

CubeAPM is positioned as a full-stack observability and APM platform built around OpenTelemetry that unifies metrics, logs, traces, and events (MELT) while giving teams deployment flexibility and complete data control inside their own cloud. It emphasizes predictable ingestion-based pricing, unlimited retention, self-hosted or vendor-managed deployment, and deep full-stack insights, including real-user and synthetic monitoring.
Azure Monitor is Microsoft’s comprehensive monitoring solution designed to collect, analyze, and act on telemetry data from cloud and on-premises resources. It forms the backbone of Azure observability by aggregating metrics, logs, and traces into a centralized data platform. It correlates signals across Azure resources to help teams understand performance, maximize availability, and respond to system events.
Dynatrace is an enterprise observability platform built to analyze, automate, and innovate with AI-driven insights. It combines full-stack monitoring, distributed tracing, and real-time analytics with automated dependency discovery and causal AI to help teams prevent problems and optimize performance across complex hybrid and multi-cloud environments.
Multi-Agent Support

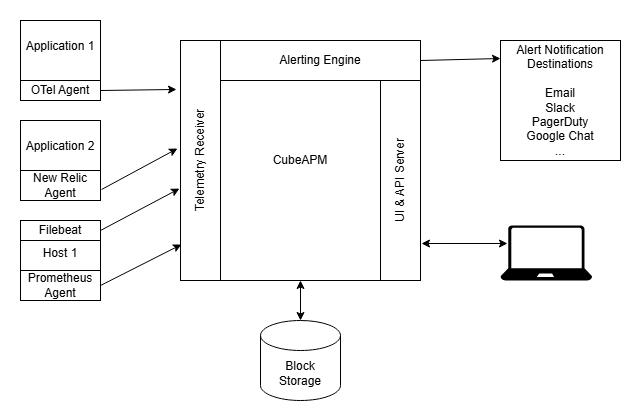
CubeAPM accepts telemetry from a wide range of sources because it’s built around OpenTelemetry and community-supported instrumentations. It can receive data directly from applications instrumented with OpenTelemetry SDKs and also from many existing agents such as Datadog and Elastic, which makes migration easier and reduces the need to re-instrument entirely.
Azure Monitor primarily uses the Azure Monitor Agent (AMA) to collect telemetry from Azure VMs, containers, and OS-level sources, as well as custom data via diagnostic settings. Azure Monitor also offers OpenTelemetry support through Application Insights, enabling applications instrumented with OTEL to send telemetry into the Azure ecosystem, though the focus remains on Azure-centric integrations.
Dynatrace uses its proprietary OneAgent for deep instrumentation of infrastructure, applications, and services. OneAgent automatically discovers dependencies and collects metrics, traces, and logs with minimal configuration, and Dynatrace also supports ingesting OpenTelemetry data through OTLP endpoints when configured.
MELT Support

CubeAPM offers unified MELT coverage by ingesting metrics, logs, events, and distributed traces into a single backend with OpenTelemetry as the foundation. This allows teams to correlate different signal types, perform holistic root-cause analysis, and link infrastructure, application, and user experience data without separating pricing or storage by signal type.
Azure Monitor collects and stores metrics, logs, and distributed traces within its core data platform, enabling consolidated observability across Azure resources. This includes application performance monitoring via Application Insights with OpenTelemetry support, where metrics, logs, and trace data can be analyzed, visualized, and acted upon in a unified way.
Dynatrace also provides full MELT observability by collecting metrics, logs, events, and traces through its OneAgent instrumentation and ingestion mechanisms (including OTLP support). Collected data is enriched and correlated within the platform, enabling integrated dashboards and contextual insights that help teams quickly understand performance and root causes across architectures.
Deployment

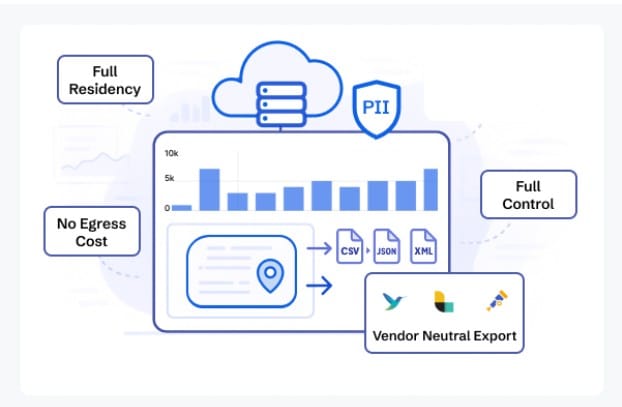
CubeAPM is deployed inside your own environment (VPC or on-prem) while remaining vendor-managed for updates and support. According to CubeAPM’s official documentation and product pages, all telemetry data is stored within the customer’s infrastructure, which supports data residency requirements and internal compliance controls. This model combines self-hosting with managed maintenance rather than fully external SaaS hosting.
Azure Monitor is delivered as a fully managed SaaS service within Microsoft Azure. Telemetry is collected through Azure Monitor Agent, diagnostic settings, and Application Insights, and data is stored in Azure regions selected by the customer. There is no self-hosted deployment model; it operates entirely as part of the Azure platform.
Dynatrace offers both SaaS and managed/self-managed deployment options. In the SaaS model, Dynatrace hosts and operates the platform in its own cloud infrastructure. In the Managed deployment model, Dynatrace components are installed in the customer’s environment while still being centrally operated. OneAgent runs within monitored hosts in both models.
Pricing for Small, Mid, and Large Teams
*All pricing comparisons are calculated using standardized Small/Medium/Large team profiles defined in our internal benchmarking sheet, based on fixed log, metrics, trace, and retention assumptions. Actual pricing may vary by usage, region, and plan structure. Please confirm current pricing with each vendor.
| Approx. cost for teams (size) | Small (~30) | Mid-Sized (~125) | Large (~250) |
| CubeAPM | $2,080 | $7,200 | $15,200 |
| Azure Monitor | $2,064 | $5,232 | $13,228 |
| Dynatrace | $7,740 | $21,850 | $46,000 |
CubeAPM Costs in Detail
CubeAPM uses a predictable ingestion-based pricing model without per-user or host fees. Based on official CubeAPM pricing details:
- $0.15 per GB of telemetry ingested
- No separate charges for metrics, traces, logs
- No per-host or per-user licensing costs
This model aims to make cost estimation at scale simpler, especially for high-volume observability needs such as 10TB+ per month. Pricing for different teams:
- Small teams (~ 30): $2,080
- Mid-sized teams (~ 125): $7,200
- Large teams (~250): $15,200
Azure Monitor Cost in Detail
Azure Monitor pricing is consumption-based across signals and services. As documented by Microsoft:
- Logs: ~$0.50 per GB ingested into Log Analytics workspaces
- Metrics: ~$0.16 per 10 million metric samples
- Additional charges can apply for retention beyond default tiers
Because Azure Monitor is built into the Azure billing ecosystem, actual costs depend on resource configurations, retention settings, and whether Azure Cost Management budgets/alerts are in use.
Pricing for different teams:
- Small teams: $2,064
- Mid-size teams: $5,232
- Large teams: $13,228
Dynatrace Cost in Detail
Dynatrace pricing is multi-component and tends to be higher for enterprise use cases. As listed on Dynatrace’s official pricing pages:
- Full-stack monitoring: ~$0.01 per GiB-hour
- Infrastructure monitoring: ~$0.04 per host-hour
- Logs: ~$0.20 per GiB ingested
- RUM: ~$0.00225 per session
- Additional usage tiers may apply for extended retention or AI insights
Dynatrace pricing scales with monitored host count and signal volume. Enterprise support and longer retention also contribute to higher annual spend.
Pricing for different teams:
- Small teams: $7,740
- Mid-size teams: $21,850
- Large teams: $46,000
Check out our Dynatrace pricing calculator to understand how its pricing scales.
Teams typically begin noticing pricing differences once telemetry volume moves beyond early-stage usage, particularly in environments with sustained traffic, high-cardinality logs, or multiple microservices. At that point, observability spend often shifts from a predictable line item to a variable operational expense that requires active monitoring, retention planning, and ingestion control.
Sampling Strategy
Sampling determines how much telemetry is retained versus dropped, directly impacting observability depth, ingestion cost, and incident visibility.

CubeAPM uses Smart Sampling, a context-aware approach that prioritizes retaining traces with higher latency, errors, or anomalous characteristics instead of relying only on fixed-percentage rules. Built on OpenTelemetry pipelines, CubeAPM allows collector-level sampling decisions that help reduce cost while preserving high-value traces for debugging and MTTR reduction.
Azure Monitor supports fixed-rate (percentage-based) sampling and rate-limited sampling through its OpenTelemetry configuration. According to Microsoft’s official documentation, developers can configure a sampling ratio or define a maximum number of traces per second to control ingestion volume. Azure Monitor also includes optional trace-based sampling for logs, which drops logs associated with unsampled traces when sampling is enabled.
Dynatrace uses Adaptive Traffic Management (ATM), which dynamically adjusts trace capture based on traffic behavior and workload characteristics. This allows Dynatrace to automatically balance observability depth and performance overhead. Dynatrace also supports OpenTelemetry head- and tail-based sampling configurations when ingesting OTEL data streams.
Data Retention

CubeAPM is deployed inside your own cloud or VPC and, according to its official documentation, offers unlimited data retention without additional vendor pricing tiers. Because data is stored in your infrastructure, you control how long metrics, logs, traces, real-user data, and synthetic results are kept based on your own retention policies and compliance needs.
Azure Monitor’s retention policies are signal-specific and configured at the workspace or service level. Based on Microsoft’s official documentation:
- Basic Logs: Retained for up to 30 days at no additional cost.
- Analytics Logs: Retained for up to 31 days at no additional cost.
- Custom Metrics: Retained for up to 90 days at no additional cost.
- Extended Retention: Data retained beyond these included periods is billed per GB per month, pro-rated daily, and can be archived for longer durations through Log Analytics workspace configuration.
These retention settings are configurable and charges apply only if you extend beyond the free default windows.
Dynatrace uses its Grail data platform with specific default retention windows for different telemetry types, which are also configurable for long-term analysis:
- Metrics: Retained for 15 months by default.
- Logs: Retained for 35 days by default.
- RUM & Synthetic Monitoring Data: Retained for 35 days by default.
- Distributed Traces: Retained for 10 days by default.
Using Dynatrace Grail buckets, customers can create custom retention policies that extend retention for logs and traces from 1 day up to 10 years, depending on compliance needs and storage planning. Extended retention configurations typically incur incremental storage costs.
Support Channel & Response Times
CubeAPM provides direct support channels designed for engineering teams:
- Support Channels: Slack, WhatsApp, Email
- Response Time: Reported response in minutes via direct messaging channels
CubeAPM positions its support as engineering-led and direct, allowing customers to communicate with core product teams rather than relying solely on ticket queues.
Azure Monitor (Microsoft Azure Support) is delivered through Microsoft Azure Support plans. Response times depend on both the support tier and the severity level of the issue.
- Support Channels: Azure Portal ticketing, Email, Chat, Phone
- Response Time SLAs (Severity A / Critical Production Issues):
- Standard Support: Initial response within 8 hours
- Professional Direct: Initial response within 4 hours
- Unified / Premier: Initial response within 15 minutes
Dynatrace provides tiered support programs with SLAs based on subscription level.
- Support Channels: Customer Support Portal (web tickets), Live Chat, Phone (enterprise tiers)
- Response Time SLAs:
- Standard Support: 4 business days to 4 hours, depending on severity
- Enterprise/Priority Support: 2 business days to 30 minutes for critical severity issues
Response commitments vary by contract and service tier.
How Teams Evaluate These Platforms at Scale
At a small scale, feature comparisons are enough. At production scale, decisions are driven by architecture, governance, and cost modeling. As telemetry volume grows and compliance requirements tighten, teams move beyond checklists and start evaluating long-term operational impact.
Who Is Involved
Platform decisions typically involve multiple stakeholders:
- Engineering evaluates instrumentation effort, OpenTelemetry compatibility, MTTR impact, and how well the platform handles distributed tracing across microservices.
- Finance focuses on cost predictability, ingestion growth curves, and whether pricing scales linearly or compounds across hosts, signals, and retention tiers.
- Security and compliance teams assess data residency, storage location, encryption controls, and whether telemetry leaves the organization’s cloud boundary.
This is why Azure-native organizations may lean toward Azure Monitor, enterprises prioritizing automation may shortlist Dynatrace, and teams requiring self-hosted data control evaluate platforms like CubeAPM.
What Questions Block Decisions
At scale, teams usually pause around a few core concerns:
- What will this cost at 5TB, 10TB, or 50TB per month?
- How does sampling affect visibility during incidents?
- Can we retain logs or traces long enough for compliance or audits?
- Does telemetry remain inside our cloud or leave our environment?
- How difficult is migration from our current APM tooling?
These questions matter more than feature lists once systems grow beyond early-stage deployments.
Why Comparisons Alone Aren’t Enough
Side-by-side feature comparisons help narrow options, but they rarely reflect production realities. Actual cost depends on ingestion patterns, log cardinality, trace volume, and retention settings. Sampling behavior only becomes visible during high-traffic incidents. Support SLAs matter most when outages occur.
For that reason, mature teams typically run controlled proofs of concept, simulate realistic telemetry loads, and model multi-month cost projections before committing to a platform.
Azure Monitor vs Dynatrace vs CubeAPM: Use Cases
Different platforms solve different operational problems. The right choice depends on your cloud footprint, compliance posture, cost sensitivity, and how complex your production environment has become.
Choose CubeAPM if:
CubeAPM is typically selected by teams that prioritize data control, OpenTelemetry-native architecture, and predictable ingestion-based pricing at scale.
- You need a self-hosted, OpenTelemetry-based alternative
If your organization wants telemetry stored inside your own VPC or on-prem infrastructure for compliance or data residency reasons, CubeAPM’s deployment model keeps data within your cloud boundary. - You want predictable pricing as telemetry grows
Based on CubeAPM’s official pricing page, billing is $0.15/GB ingestion with no per-host or per-user charges. For teams scaling from a few GB per day to multi-terabyte ingestion, this simplifies forecasting compared to host-based or multi-signal billing models. - You are a startup looking for lightweight, easy-to-deploy APM
For early-stage teams running Kubernetes or containerized workloads, OpenTelemetry-native ingestion allows fast instrumentation without proprietary agent lock-in. - You want full-stack observability without splitting tools
CubeAPM supports metrics, logs, traces, RUM, synthetic monitoring, and error tracking under one backend, which reduces integration complexity across separate products. - You need strict data residency and compliance support
Since data resides inside your own infrastructure, organizations operating under localization or regulatory constraints often prefer this architecture. - You want to reduce MTTR using context-aware sampling
CubeAPM’s Smart Sampling approach prioritizes retaining high-latency and error traces (based on their documentation), which helps during production incidents where losing critical traces increases debugging time. - You run Java-heavy microservices architectures
For JVM-based systems using Spring Boot, Micronaut, or Jakarta EE, OpenTelemetry Java instrumentation can send traces and metrics directly into CubeAPM without proprietary agents, making it suitable for end-to-end tracing across distributed Java services. - You are migrating from Datadog or New Relic
Based on CubeAPM’s compatibility documentation, it supports ingestion from OpenTelemetry and common ecosystem agents, reducing re-instrumentation effort during migration.
Choose Azure Monitor if:
Azure Monitor is best suited for organizations deeply integrated into the Microsoft Azure ecosystem.
- You run primarily on Azure
If your infrastructure relies heavily on Azure VMs, AKS, App Services, and Azure-native services, Azure Monitor integrates directly with platform diagnostics and resource logs. - You want unified Azure billing and governance
Azure Monitor costs roll into Azure’s broader consumption billing model, simplifying procurement for enterprises already operating under Azure enterprise agreements. - You need tight integration with Microsoft tooling
Azure Monitor connects natively with Azure Security Center, Defender, and other Microsoft services, making it easier to centralize monitoring, security, and compliance workflows. - You prefer fully managed SaaS without self-hosting
Azure Monitor operates as a managed Azure service, eliminating the need to maintain your own observability backend. - You require built-in support for Azure PaaS services
Many Azure services emit diagnostic logs and metrics directly into Azure Monitor without additional instrumentation.
Choose Dynatrace if:
Dynatrace is often chosen by enterprises running complex, hybrid, or multi-cloud systems that require automation and AI-assisted diagnostics.
- You operate large-scale hybrid or multi-cloud environments
Dynatrace’s OneAgent automatically discovers services and dependencies across environments, reducing manual configuration in complex infrastructures. - You need AI-driven root cause analysis
Dynatrace’s causal AI and Adaptive Traffic Management are designed to correlate signals and automatically surface probable root causes in distributed systems. - You want automated topology mapping
In environments with hundreds of services, automated dependency discovery reduces operational overhead compared to manual instrumentation tracking. - You are less sensitive to variable pricing at scale
Based on Dynatrace’s official pricing structure (host-hour and signal-based components), costs scale with monitored hosts and telemetry volume, which may be acceptable for enterprises prioritizing automation depth over ingestion simplicity. - You need structured enterprise support tiers
Dynatrace offers tiered enterprise support SLAs with defined response commitments for critical production systems.
This use-case breakdown helps align platform selection with operational maturity, compliance needs, and cost modeling rather than focusing solely on feature checklists.
Conclusion
Azure Monitor, Dynatrace, and CubeAPM each address observability from different architectural and operational angles. Azure Monitor integrates deeply with the Azure ecosystem, Dynatrace emphasizes AI-driven automation for complex environments, and CubeAPM focuses on OpenTelemetry-native ingestion, predictable pricing, and data control.
At scale, the decision typically comes down to deployment model, retention needs, sampling behavior, and long-term cost forecasting rather than feature lists alone. Teams must balance integration depth, automation, and governance requirements.
For organizations seeking self-hosted control with predictable ingestion-based pricing, CubeAPM presents a strong alternative. Explore a demo to evaluate how it fits your production environment.
Disclaimer: The information in this article reflects the latest details available at the time of publication and may change as technologies and products evolve.
FAQs
1. Can Azure Monitor, Dynatrace, and CubeAPM be used in multi-cloud environments?
Yes, but with differences. Azure Monitor works best in Azure-centric environments, though it can collect telemetry from on-prem and other clouds. Dynatrace is designed for hybrid and multi-cloud deployments with automatic discovery across environments. CubeAPM can ingest OpenTelemetry data from any cloud or on-prem system, making it cloud-agnostic as long as telemetry is properly instrumented.
2. Which platform is better for Kubernetes monitoring?
All three support Kubernetes. Azure Monitor integrates natively with AKS. Dynatrace’s OneAgent provides automatic Kubernetes discovery and topology mapping. CubeAPM supports Kubernetes via OpenTelemetry collectors and Prometheus-compatible ingestion, which can suit teams preferring standards-based instrumentation and self-hosted control.
3. Do these tools require proprietary agents?
Azure Monitor primarily uses Azure Monitor Agent but supports OpenTelemetry. Dynatrace relies heavily on its proprietary OneAgent, although it can ingest OpenTelemetry data. CubeAPM is built around OpenTelemetry and does not require a proprietary agent, which can reduce vendor lock-in.
4. Which platform is more suitable for regulated industries?
It depends on deployment preferences. Azure Monitor stores data within Azure regions selected by the customer. Dynatrace SaaS stores data in Dynatrace-managed environments, while managed deployments provide more control. CubeAPM, being deployed inside the customer’s own cloud or infrastructure, can support strict data residency and internal governance requirements.
5. How do these platforms impact long-term observability costs?
Azure Monitor and Dynatrace costs scale based on ingestion volume, host usage, and retention configuration. CubeAPM uses a predictable ingestion-based model ($0.15/GB as per its official pricing), which may simplify forecasting for teams handling growing telemetry volumes. Actual spend depends on workload characteristics, sampling configuration, and retention settings.


