The main difference between Amazon CloudWatch, Splunk AppDynamics, and CubeAPM is that Amazon CloudWatch is an AWS-native monitoring service optimized for infrastructure and service-level telemetry inside AWS, Splunk AppDynamics is an application performance monitoring platform focused on deep business transaction tracing, and CubeAPM is an OpenTelemetry-native observability platform designed for predictable ingestion-based pricing and cross-environment consistency.
Amazon CloudWatch is best suited for organizations operating primarily within AWS that need native visibility across infrastructure and managed services. Splunk AppDynamics is best aligned with enterprises that prioritize deep application performance analysis and business transaction monitoring across complex distributed systems. CubeAPM is best positioned for teams that require cross-environment telemetry standardization, vendor-managed self-hosting, and cost control.
This guide compares Amazon CloudWatch vs Splunk AppDynamics vs CubeAPM across architecture, MELT coverage, sampling, retention, support response times, and cost behavior at production scale.
Amazon CloudWatch vs Splunk AppDynamics vs CubeAPM: Feature Comparison
The comparison below is based on publicly available documentation and typical production usage patterns. Actual pricing, sampling, and retention behavior may vary depending on workload characteristics and system configuration.
| Features | CubeAPM | AWS CloudWatch | Splunk AppDynamics |
| Known for | OpenTelemetry-native observability with predictable costs | Native AWS monitoring for infrastructure, logs, metrics, alarms | Enterprise-grade application performance and business transaction monitoring |
| Multi-Agent Support | Yes (OTel, New Relic, Datadog, Elastic) | Limited (CloudWatch Agent, AWS SDKs, OpenTelemetry, AWS X-Ray) | Limited (OTel, Prometheus) |
| MELT Support | Full MELT | Full MELT | Full MELT |
| Setup | Self-hosted but vendor-managed | SaaS (Fully managed AWS service) | SaaS and Self-hosted |
| Pricing | Ingestion-based pricing of $0.15/GB | Logs: $0.50 per GB Traces: $0.15/GB | APM: $33/month/CPU core Infra: $6/month/CPU |
| Sampling Strategy | Smart sampling (95% compression) | Tail-based + Adaptive | Adaptive Head + Tail + RUM session-based |
| Log Retention | Unlimited Retention | Logs: Indefinite retention | Raw Traces: 8 days Spans/RUM sessions: 8 days |
| Support TAT | < 10 minutes | Business Plan: 15 minutes | 30mins to 1 day |
Amazon CloudWatch vs Splunk AppDynamics vs CubeAPM: Feature-by-Feature Breakdown
Known For
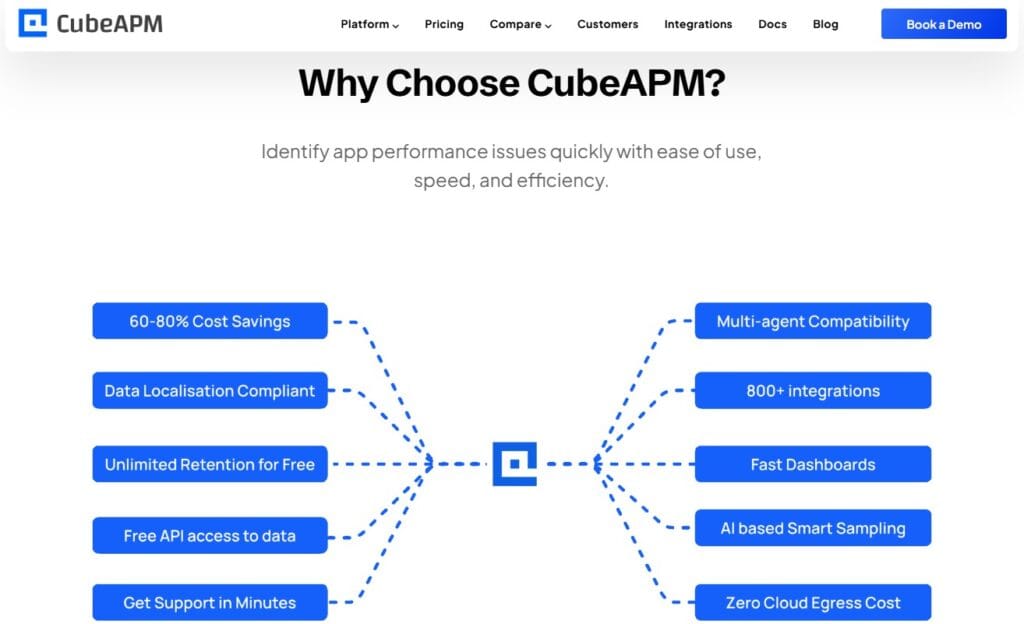
CubeAPM: Known for being OpenTelemetry-native by design and built around ingestion-based pricing. CubeAPM standardizes metrics, logs, events, and traces under a consistent telemetry model, allowing teams to operate across cloud, hybrid, and on-prem environments without being tied to a single infrastructure provider. It emphasizes smart sampling, predictable cost behavior, and vendor-managed self-hosted deployment for teams that need portability and control.
Amazon CloudWatch: Known as the native monitoring and observability service within AWS. Amazon CloudWatch provides infrastructure metrics, logs, alarms, and events tightly integrated with AWS services, IAM policies, regions, and operational workflows. It is optimized for teams running production workloads primarily inside AWS and needing immediate visibility into managed services without deploying additional tooling.
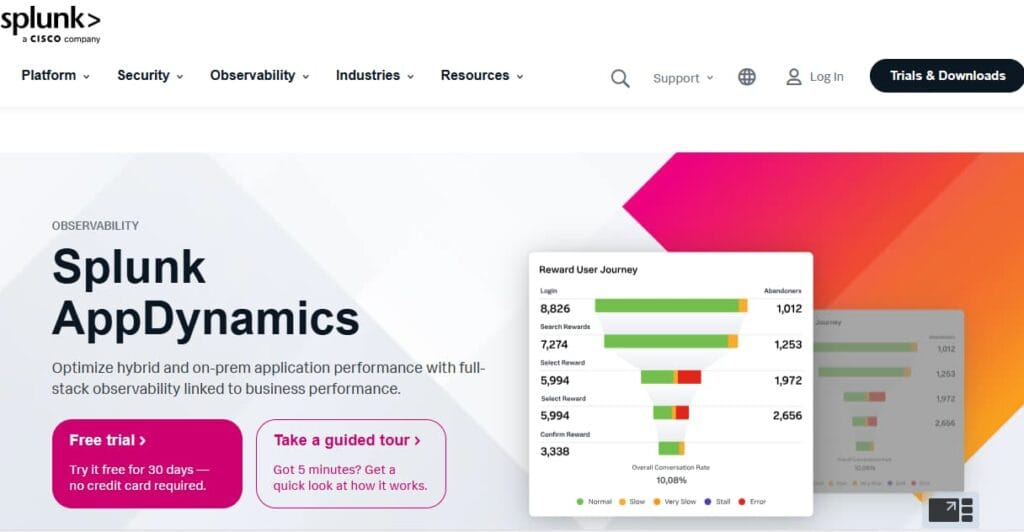
Splunk AppDynamics: Known for deep application performance monitoring and business transaction visibility in complex enterprise systems. Splunk AppDynamics focuses on tracing application flows end-to-end, correlating performance issues with business impact, and providing detailed insight into code-level bottlenecks. It is commonly adopted by large organizations that prioritize transaction-level monitoring across distributed architectures.
Multi-Agent Support
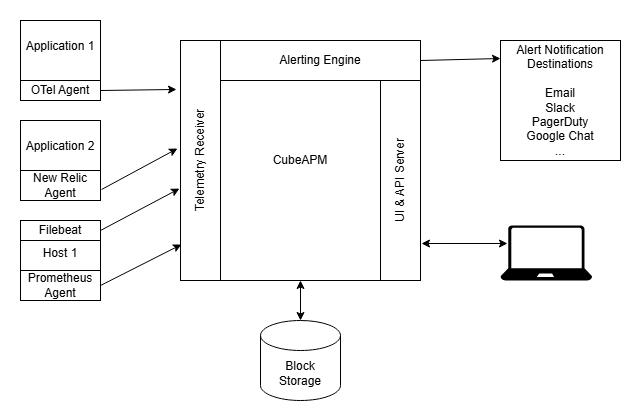
CubeAPM: Designed to support heterogeneous telemetry environments. OpenTelemetry collectors and language SDKs are first-class citizens, allowing teams to standardize data collection across cloud, hybrid, and on-prem systems. CubeAPM can also ingest telemetry from existing vendor agents such as Datadog, New Relic, Elastic, and Prometheus. This enables incremental migration without re-instrumenting workloads or running parallel observability stacks during transition.
Amazon CloudWatch: Optimized for AWS-native telemetry collection. Data is gathered through the CloudWatch Agent, AWS SDK integrations, managed AWS service emitters, and the AWS Distro for OpenTelemetry. Distributed tracing is handled through AWS X-Ray. OpenTelemetry is supported, particularly through AWS’s distribution and exporters, enabling standardized instrumentation within AWS environments.
Splunk AppDynamics: Supports both native AppDynamics agents and OpenTelemetry-based instrumentation. Splunk AppDynamics for OpenTelemetry enables collection of metrics, logs, and traces using OpenTelemetry SDKs and collectors while integrating them into the AppDynamics backend. This allows teams to adopt OpenTelemetry standards while retaining deep application performance and transaction-level visibility.
MELT Coverage and Signal Correlation
CubeAPM: Supports full MELT coverage built on a unified OpenTelemetry data model. Metrics, events, logs, and traces share consistent resource attributes and context propagation. This allows teams to move from high-level signals, such as latency spikes or error rates, directly into request-level trace analysis without switching tools or data schemas. Correlation is based on OpenTelemetry context rather than cloud-specific resource hierarchies.
Amazon CloudWatch: Provides native support for metrics, logs, alarms, and events emitted by AWS services. Distributed tracing is delivered through AWS X-Ray and can be used alongside CloudWatch metrics and logs for investigation workflows. Signal correlation is largely centered around AWS resource metadata, service identifiers, and account-level context. This model works efficiently inside AWS-centric environments where infrastructure and application telemetry are tightly coupled to AWS services.
Splunk AppDynamics: Delivers full MELT coverage with strong emphasis on application traces and business transaction flows. Metrics, logs, and traces are correlated within the context of application tiers and business transactions. AppDynamics is particularly strong at mapping request paths across services and tying performance degradation to specific application components or business operations. Correlation is structured around application topology and transaction modeling.
Deployment Model
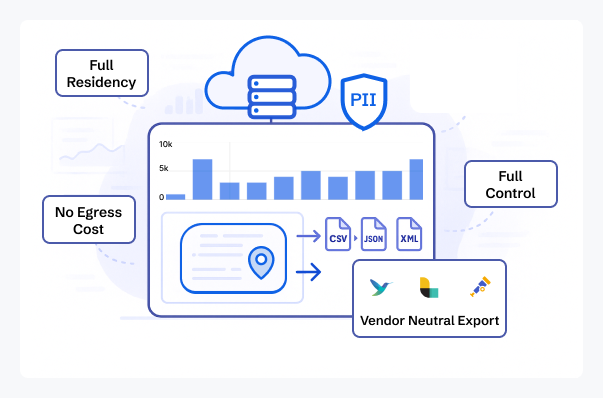
CubeAPM: Provides a self-hosted or BYOC deployment model that is vendor-managed. Telemetry storage and processing remain within the customer’s infrastructure or cloud account, while operational responsibilities such as upgrades, scaling, and maintenance are handled by the CubeAPM team. This model is designed for organizations that require data control, portability, or compliance alignment without running the observability backend entirely on their own.
Amazon CloudWatch: Delivered exclusively as a fully managed SaaS service within AWS. There is no self-hosted deployment option. CloudWatch is tightly integrated into AWS infrastructure, and telemetry collection, scaling, and maintenance are managed entirely by AWS. This approach minimizes operational overhead but inherently couples observability to the AWS ecosystem.
Splunk AppDynamics: Available in both SaaS and self-hosted (on-premises or virtual appliance) deployment models. The SaaS option provides a managed experience similar to other cloud-based APM platforms. The self-hosted option gives organizations control over the controller and data residency, which can be important for regulatory or governance reasons. However, self-hosted deployments require additional operational effort, including initial installation, controller configuration, upgrades, infrastructure provisioning, scaling management, and ongoing maintenance. This introduces infrastructure and operational overhead compared to SaaS-only models.
Pricing: Approximate Cost for Small, Mid-Sized & Large Teams
*All pricing comparisons are calculated using standardized Small/Medium/Large team profiles defined in our internal benchmarking sheet, based on fixed log, metrics, trace, and retention assumptions. Actual pricing may vary by usage, region, and plan structure. Please confirm current pricing with each vendor.
*An APM host is a host that is actively generating trace data, and an Infra host is any physical or virtual OS instance that you monitor with any observability tool.
Below is a cost comparison for small, mid-sized, and large teams.
| Approx. Cost for Teams | Small (~30 APM Hosts) | Mid-sized (~125 APM Hosts) | Large (~250 APM Hosts) |
| CubeAPM | $2,080 | $7,200 | $15,200 |
| Amazon CloudWatch | $5,343.50 | $15,637 | $30,018 |
| Splunk AppDynamics | $2,290 | $8,625 | $17,750 |
As observability deployments mature, cost and operational dynamics evolve in measurable ways. What initially appears to be a straightforward monitoring implementation becomes more complex as telemetry volume scales, service count increases, distributed tracing expands, and retention requirements grow. Engineering teams begin allocating more time to sampling strategy, data lifecycle management, and cost governance. Variability in monthly spend becomes more visible, especially during traffic spikes or incident investigations.
At this stage, observability shifts from being a tooling selection exercise to an operational discipline. It influences architectural decisions, telemetry design standards, budgeting models, and incident response depth. For DevOps leaders and CTOs, the question is no longer only which platform offers the right features, but which pricing and deployment model remains predictable and controllable under sustained production load.
What This Comparison Reveals at Scale
At small team size, cost differences appear marginal. Observability spends sits within a narrow band, and pricing architecture does not yet exert meaningful pressure on decision-making. At this stage, cost rarely overrides platform familiarity or ecosystem alignment.
At mid-sized scale, pricing behavior starts to diverge. The underlying billing model begins to matter more than the entry price. Telemetry volume increases steadily, log verbosity expands, and trace collection becomes more consistent. Monthly spend becomes influenced not just by usage, but by how that usage is measured and billed.
At large scale, the distinction becomes structural. Differences of several thousand dollars per month are no longer rounding errors. Cost is driven less by the number of hosts and more by ingestion patterns, sampling strategy, retention duration, and how telemetry spikes during incidents. Pricing architecture, not feature count, determines long-term predictability.
This comparison is intentionally focused on cost behavior rather than platform capability. All three platforms provide mature observability features. The real differentiator at scale is how pricing models respond under sustained production load, incident traffic, and growing telemetry volume. Over time, that economic behavior often has more operational impact than feature parity.
CubeAPM: Cost for Small, Medium, and Large Teams
CubeAPM uses a pure ingestion-based pricing model, where observability spend is directly tied to the volume of telemetry processed.This structure is designed to keep cost predictable as environments become more distributed and telemetry volume increases.
Pricing:
- Flat ingestion pricing of $0.15 per GB
Using standardized workload assumptions across comparable production environments, typical monthly cost ranges are:
- Small teams (~30 APM hosts): approximately $2,080
- Mid-sized teams (~125 APM hosts): approximately $7,200
- Large teams (~250 APM hosts): approximately $15,200
At a higher scale, cost variability is primarily influenced by trace volume, log verbosity, sampling configuration, and retention duration rather than agent count or license tiers. This shifts cost control toward telemetry design decisions instead of infrastructure expansion.
Amazon CloudWatch: Cost for Small, Medium, and Large Teams
Amazon CloudWatch uses a multi-dimensional ingestion-based pricing model, where charges are not confined to a single telemetry type but span logs, metrics, alarms, traces, and optional features like Insights and Synthetics. Pricing components include log ingestion and storage, custom metric counts, API request volumes, tracing recorded via AWS X-Ray, and any advanced monitoring features you enable.
Pricing drivers typically include:
- Logs: $0.50 per GB
- Application Observability (Traces): $0.15/GB
Using comparable production workload assumptions, typical monthly cost ranges are:
- Small teams (~30 APM hosts): $5,343.50
- Mid-sized teams (~125 APM hosts): $15,637
- Large teams (~250 APM hosts): $30,018
At scale, cost behavior becomes increasingly sensitive to log verbosity, custom metric growth, and trace sampling configuration. Because multiple billing dimensions are involved, forecasting requires careful monitoring of ingestion patterns, metric cardinality, and retention policies. During traffic spikes or incident investigations, increased telemetry volume can materially impact monthly spend if not actively governed.
Splunk AppDynamics: Cost for Small, Medium, and Large Teams
Splunk AppDynamics’ pricing follows an enterprise observability licensing model that is typically structured around monitored units (CPU core) and subscription tiers rather than a single per-GB ingestion metric. This model often includes defined entitlements for APM, infrastructure monitoring, and other observability modules under a unified contract.
Pricing components that influence spend include:
- APM: $33/month/CPU core
- Infra: $6/month/CPU core
Using aligned workload assumptions for mid-sized production environments, typical monthly cost estimates fall within the following ranges:
- Small teams (~30 APM hosts): approximately $2,290
- Mid-sized teams (~125 APM hosts): approximately $8,625
- Large teams (~250 APM hosts): approximately $17,750
Unlike pure ingestion-based models, cost behavior for Splunk AppDynamics is driven by agent count, license tier decisions, and CPU cores. In self-hosted controller deployments, additional operational costs for infrastructure management, provisioning, and controller scaling should also be factored into total cost of ownership.
Sampling Strategy
CubeAPM: CubeAPM applies a smart sampling approach that aims to retain high-value telemetry while reducing noise and cost. Instead of a fixed percentage drop rate, sampling decisions consider trace context, performance anomalies, and request importance. This context-aware sampling preserves significant traces during incidents and high-impact requests while reducing volume in normal traffic patterns. The result is more efficient data retention without losing meaningful investigative signals.
Amazon CloudWatch: Amazon CloudWatch supports adaptive sampling and tail-based sampling through AWS X-Ray and the AWS Distro for OpenTelemetry. Tail-based sampling allows sampling decisions to be made after seeing the trace behavior, which improves the likelihood that important or anomalous requests are captured. Adaptive sampling automatically adjusts sampling rates based on traffic volume to maintain a target throughput of traces. This helps stabilize trace costs while ensuring coverage remains consistent as load fluctuates.
Splunk AppDynamics: Splunk AppDynamics combines multiple sampling strategies across signal types. For application traces, both head-based sampling and tail-based sampling are supported, balancing volume control with retention of meaningful performance data. In addition, Splunk AppDynamics applies session-based sampling for real-user monitoring (RUM), which governs how browser sessions are captured and retained based on configured session criteria.
Data Retention
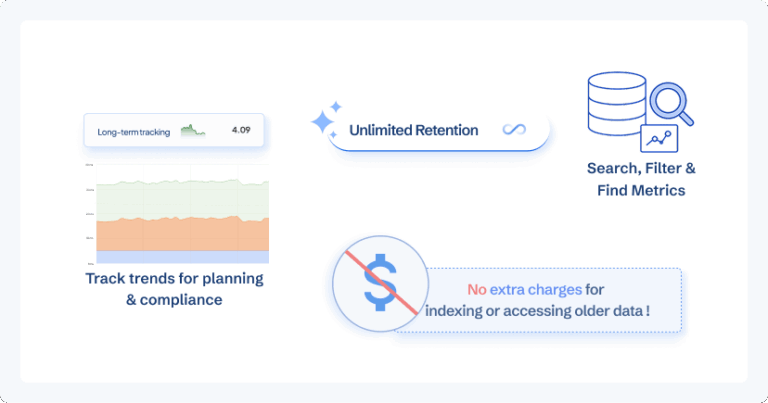
CubeAPM: CubeAPM supports unlimited retention across metrics, logs, and traces, allowing teams to define data lifecycle policies based on operational, compliance, or investigative needs rather than fixed vendor windows. This enables long-term historical analysis without exporting data to secondary storage, preserves full trace context for deep post-incident reviews, and reduces the need for rehydration workflows. As systems mature and audits or multi-quarter investigations become necessary, unlimited retention provides continuity that short-term trace windows cannot support.
Amazon CloudWatch: Amazon CloudWatch allows configurable log retention at the log group level. By default, logs are retained indefinitely and never expire, but teams can configure retention from 1 day up to 10 years depending on requirements. Metric retention follows AWS-defined tiers: one-minute metrics are retained for 15 days, five-minute metrics for 63 days, and one-hour aggregated metrics for approximately 455 days. Retention flexibility exists, but it is signal-specific and governed by AWS service policies rather than a unified retention model across metrics, logs, and traces.
Splunk AppDynamics: Splunk AppDynamics applies retention windows that vary by telemetry type. Raw traces, spans, profiling data, and high-resolution metrics are typically retained for approximately 8 days, while aggregated metric rollups can be retained for up to 13 months depending on configuration. Real user monitoring session data follows similar short-term retention behavior. Extended retention options may be available based on entitlements, but default behavior emphasizes short-term raw data retention with longer-term aggregated metric storage.
Support Channel and Response Time (TAT)
CubeAPM: CubeAPM provides direct engineering support through Slack and email, with typical response times under 10 minutes for active production issues. The support model is designed for real-time operational environments where incident response speed directly impacts system reliability. There are no separate paid tiers required to access engineering-level assistance.
Amazon CloudWatch: Amazon CloudWatch support is delivered through AWS Premium Support plans rather than as a standalone service. Response times depend on the selected support tier. Under Enterprise Support, critical (Severity 1) cases target response times as low as 15 minutes. Business Support typically targets response within one hour for critical issues. Lower-severity cases have longer response windows, and response guarantees vary by plan level and severity classification.
Splunk AppDynamics: Splunk AppDynamics support is structured by severity level (P1–P4) and support tier. Under Premium Support, P1 (critical production outage) cases target a 30-minute response time with 24/7 availability. P2 issues target a 1-hour response, and P3 cases target 4 hours. Under Standard Support, P1 response time is 2 hours, P2 is 1 business day, and P3 is 2 business days. Availability and update cadence also vary by tier, with Premium offering continuous coverage and more frequent updates.
How Teams Evaluate These Platforms at Scale
As observability programs mature, evaluation shifts from feature comparison to operational resilience. DevOps leaders and CTOs begin focusing on how a platform behaves under sustained production load rather than how quickly it can be deployed. The central questions change: How predictable is cost when telemetry volume spikes? How well does sampling preserve high-value traces during incidents? How much effort is required to manage retention, cardinality, and governance as systems scale?
At mid to large scale, pricing architecture becomes as important as technical capability. Teams analyze whether spend scales linearly with workload growth or increases in step changes based on agent count, feature tiers, or licensing thresholds. They assess how retention limits impact historical investigations and whether sampling strategies reduce noise without eliminating critical signals. Operational overhead, particularly in self-managed deployments, also becomes part of total cost of ownership discussions.
Ultimately, mature teams evaluate these platforms through the lens of long-term control. They prioritize predictability, governance flexibility, and support responsiveness over surface-level feature parity. At scale, observability is no longer just about collecting data. It becomes a financial and architectural discipline that directly influences system design, incident response depth, and long-term growth strategy.
Amazon CloudWatch vs Splunk AppDynamics vs CubeAPM: Use Cases
Choose CubeAPM if:
- You need OpenTelemetry-native observability across cloud, hybrid, and on-prem environments.
- You want predictable ingestion-based pricing aligned with telemetry volume rather than host count.
- You require vendor-managed self-hosting for data control and compliance needs.
- You want centralized sampling and retention control without fixed vendor-imposed limits.
- You need engineering-level support with fast response times during production incidents.
Choose Amazon CloudWatch if:
- You need deep integration with AWS services, IAM, and regional infrastructure.
- You want a fully managed SaaS monitoring service with minimal deployment overhead.
- You need native visibility into AWS-managed services and infrastructure metrics.
- You want configurable log retention from one day up to ten years or indefinite storage.
- You need observability tightly embedded into AWS operational workflows.
Choose Splunk AppDynamics if:
- You need deep application performance monitoring with business transaction visibility.
- You want end-to-end trace analysis across complex distributed architectures.
- You need SLA-backed enterprise support with defined severity response targets.
- You want the flexibility of SaaS or self-hosted controller deployment.
- You need enterprise-grade APM aligned with application node scaling strategies.
Conclusion
Amazon CloudWatch, Splunk AppDynamics, and CubeAPM each address observability from different architectural perspectives. Amazon CloudWatch is closely aligned with AWS-native environments, Splunk AppDynamics emphasizes deep application performance and transaction visibility, and CubeAPM focuses on OpenTelemetry-based observability with ingestion-driven pricing and vendor-managed deployment.
At scale, the distinction between these platforms is less about feature availability and more about pricing structure, sampling control, retention flexibility, and operational overhead. The appropriate choice depends on workload location, governance requirements, and how your organization prioritizes cost predictability versus ecosystem integration.
Disclaimer: The information in this article reflects the latest details available at the time of publication and may change as technologies and products evolve.
FAQs
1. What is the main difference between Amazon CloudWatch, Splunk AppDynamics, and CubeAPM?
Amazon CloudWatch is a native AWS monitoring service focused on infrastructure and service-level telemetry within the AWS ecosystem. Splunk AppDynamics is an enterprise application performance monitoring platform centered on business transactions and deep trace visibility. CubeAPM is an OpenTelemetry-native observability platform with predictable ingestion-based pricing, vendor-managed self-hosting, and cross-environment consistency.
2. Which is better for AWS-native environments?
Amazon CloudWatch is typically the most tightly integrated option for AWS-centric workloads. It provides native metrics, logs, alarms, and tracing through AWS X-Ray with minimal setup. Organizations operating primarily within AWS often prefer it for its seamless integration with IAM, regions, and managed services.
3. Which platform offers better cost predictability at scale?
Cost predictability depends on the pricing model. Amazon CloudWatch bills across multiple dimensions such as logs, metrics, and traces, while Splunk AppDynamics typically scales with agent count and license tier. CubeAPM uses ingestion-based pricing tied directly to telemetry volume, which can make forecasting more straightforward as environments grow.
4. Do all three platforms support distributed tracing?
Yes. Amazon CloudWatch supports distributed tracing through AWS X-Ray. Splunk AppDynamics provides deep application-level tracing and business transaction monitoring, including head-based and tail-based sampling. CubeAPM supports distributed tracing natively through OpenTelemetry and context-aware smart sampling.
5. Which platform is better for multi-cloud or hybrid environments?
CubeAPM is designed to operate consistently across multi-cloud, hybrid, and on-prem environments using OpenTelemetry standards. Splunk AppDynamics supports multi-environment deployments through agents and flexible controller options. Amazon CloudWatch is optimized primarily for AWS environments, although external telemetry ingestion is possible with additional configuration.


