For nearly 40% of teams, complexity and excessive noise are the biggest challenges in observability.
Their observability systems may show everything is fine with their services, but users face service downtimes or failures. Similarly, engineers may have plenty of logs and charts to refer to, yet finding useful insight is still difficult. Traditional approaches that focus on one signal at the expense of others no longer hold up in modern systems.
Metrics, Events, Logs, and Traces (MELT) in observability bring these signals together in a coherent model to give a complete idea of system behavior. This article explains what each MELT signal represents, when it matters most, and how teams can use MELT effectively.
What is MELT in Observability?
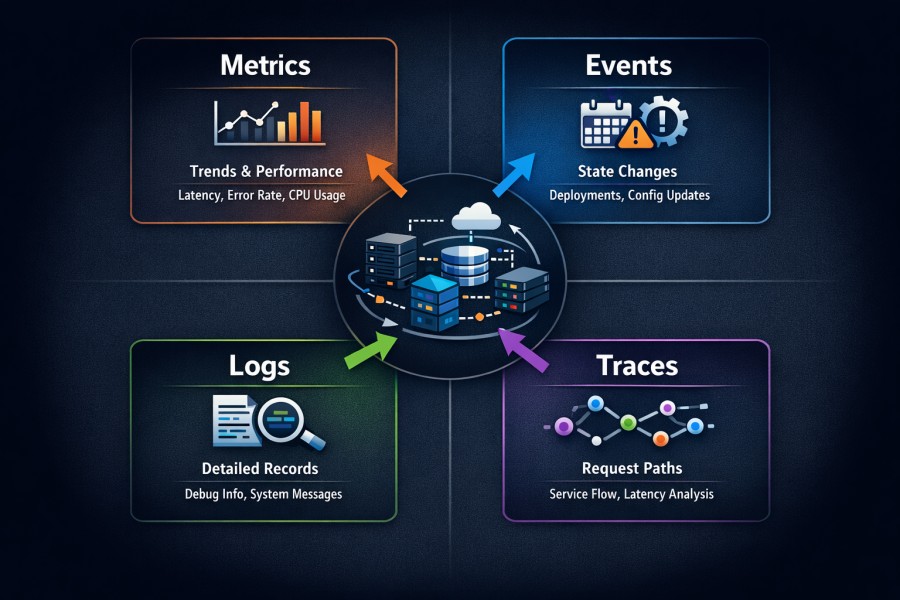
MELT stands for Metrics, Events, Logs, and Traces. Together, these four telemetry signals describe how a distributed system behaves. Each signal captures a different dimension of system activity, and each is designed to answer a different type of question.
- Metrics: measure system behavior over time. They aggregate values such as latency, error rate, throughput, CPU usage, or queue depth. Metrics are optimized for trend detection and alerting.
- Events: represent discrete state changes. A deployment, configuration update, scaling action, or feature flag change is typically captured as an event. Events provide a temporal context that helps explain why behavior changed.
- Logs: record detailed information emitted by applications and infrastructure. They capture what happened inside a component at a specific moment. Logs are rich in context but high in volume.
- Traces: reconstruct the path of a request as it moves across services. They show how work flows through APIs, databases, caches, and message queues, revealing where latency accumulates or failures propagate.
MELT exists because systems express behavior in different ways. Using the wrong signal to answer a question often leads to incorrect conclusions. For example, metrics can detect that latency increased, but they cannot always explain why. Logs may contain the explanation, but without correlation they are difficult to navigate at scale. Traces expose execution paths, but without surrounding context they may not reveal environmental triggers.
Traditional monitoring focused on narrow questions:
Is the service available?
Is latency above a threshold?
Is the error rate increasing?
This model works when systems are simple and failure modes are obvious. Modern systems behave differently. Requests span services and work fans out across queues and databases. Failures surface indirectly.
- Metrics detect change but can’t always explain the cause.
- Logs are detailed but are not structured for large volumes.
- Traces show execution paths but may lack context (in isolation).
When systems grew, teams started adding tools without intent. They also collected logs, metrics, and traces independently. Different teams relied on the type of signal that they understood best. During incidents, this slowed down investigations and increased recovery time.
The Need for a Unified Mental Model
Observability breaks down when telemetry is treated as interchangeable data. Metrics, events, logs, and traces describe different aspects of system behavior. Each answers a specific class of operational questions.
Without a shared model, predictable patterns come up:
- Metrics absorb high-cardinality labels to explain behavior they were not designed for
- Logs become the default debugging tool for performance issues
- Traces are added late and sampled aggressively
- Events are ignored or treated as annotations
A unified mental model (MELT) aligns teams on how signals should be used. It reduces debate during incidents. It also creates consistency across engineering, SRE, and platform teams.
Observability Framed Around Questions, Not Dashboards
Effective observability starts with the question being asked. Dashboards come later.
- Metrics: Has the system behavior changed?
- Events: What changed around the same time?
- Traces: Where latency and failures occurred?
- Logs: What evidence is needed to confirm findings?
This sequence reflects how investigations unfold under pressure. Teams that follow it move faster. Teams that skip steps chase noise. MELT makes this investigative flow explicit and repeatable.
Why MELT Matters Even With Modern Observability Platforms
Modern observability platforms collect telemetry at scale. They do not enforce correct usage. They do not prevent teams from over-collecting data or misapplying signals.
MELT remains relevant because it shapes how teams think. It helps you find what data to instrument and retain, how to investigate issues, and more. You need this clarity when your infrastructure becomes more complex.
More than 96% of organizations run Kubernetes in production. Apart from this, many of them also run multiple databases, messaging systems, and third-party services. Here, teams need to use the right signal at the right time to succeed in observability.
Metrics in MELT: Detecting Change over Time
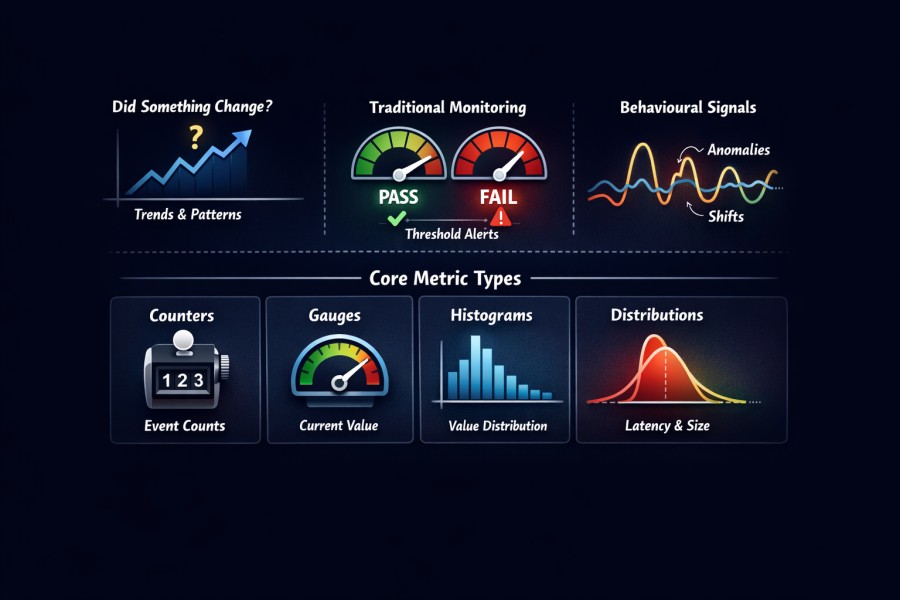
Metrics are measured values that explain system behavior over time. Example: error rates, counts, durations, and resource usage. In observability, metrics answer one primary question:
Did something change?
Traditional monitoring treats metrics as pass or fail signals. CPU high or low. Error rate above a threshold.
But in observability, metrics are behavioural signals, such as trends, patterns, and deviations (from normal operation). Metrics are good at summarizing system behavior. They compress large volumes of activity into stable signals.
Core Metric Types Used in Practice
Most observability systems rely on a small set of metric types. Each serves a distinct purpose.
- Counters measure how often something happens
- Gauges represent a value at a point in time
- Histograms capture distributions of values
- Distributions summarize latency and size patterns across requests
Histograms and distributions matter most for modern systems. Averages hide tail behavior. Percentiles expose it. Latency issues rarely affect every request. Metrics need to reflect that reality.
Choosing the correct metric type shapes what questions can be answered later. Poor choices force teams to guess during incidents.
Why Metrics Power Baselines, Trends, and SLOs
Metrics are ideal for understanding normal behavior. They establish baselines. They show how systems behave under load. They make trends visible.
This makes metrics well-suited for:
- Alerting on deviations from expected behavior
- Tracking long-term performance and reliability
- Defining and measuring Service Level Objectives
SLOs depend on stable, low-cardinality metrics. Without that stability, error budgets become noisy and misleading. Metrics provide the consistency required for reliability management.
What Metrics Cannot Explain During Incidents
Metrics show that something changed. They rarely explain why.
- When latency increases, metrics confirm the spike. They do not reveal which dependency caused it.
- When error rates rise, metrics quantify impact. They do not explain execution paths or failure modes.
Relying on metrics alone during incidents leads to guesswork. Teams add more labels to compensate. Cardinality increases. Costs rise. Clarity does not improve. Metrics are the starting point of investigation, not the conclusion.
Cardinality as the Hidden Design Constraint
Cardinality defines how many unique time series a metric produces. It is the primary scaling constraint in metric systems.
High-cardinality labels create operational risk:
- Storage and query costs increase rapidly
- Dashboards become slow and unstable
- Alerts lose reliability
Cardinality issues often emerge gradually. Teams add labels to answer new questions. Over time, metrics become harder to reason about and more expensive to operate.
Effective metric design requires restraint. Metrics should describe system behavior, not individual requests. MELT places metrics in their proper role. They detect change and guide attention. Other signals explain the cause.
Events in MELT: Explaining What Changed
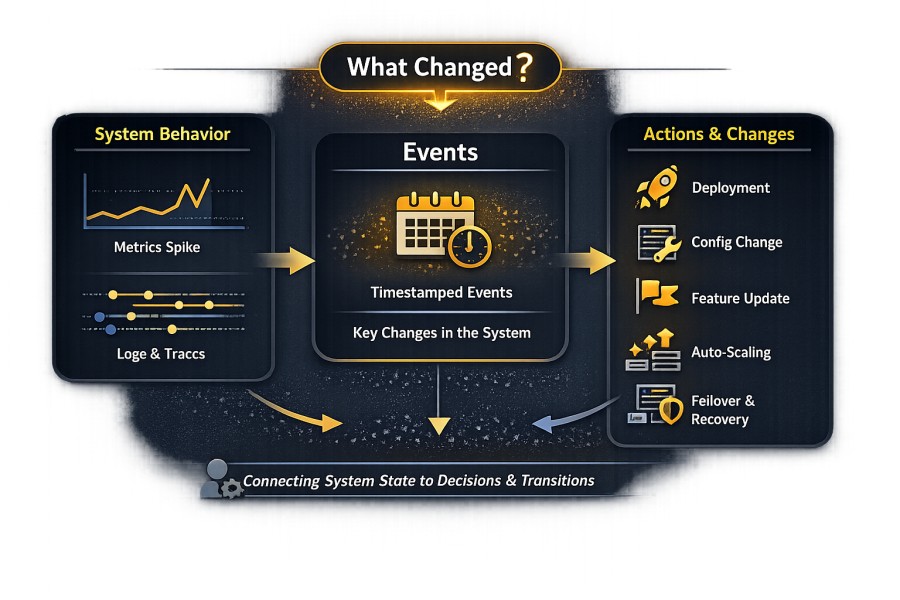
Events are a timestamped record that shows a discrete, important change, action, or occurrence in the system state. They record that something happened at a specific point in time. Unlike metrics, events do not describe behavior over a range. Unlike logs, they do not record execution details.
Events answer a different question:
What changed?
Metrics show that there’s a change in system behavior. Logs confirm what happened inside the system. Traces show how execution flowed.
In observability, events sit at the boundary between system behavior and human or automated action. They connect system behavior to decisions, changes, and transitions. They provide context to explain why a change may have occurred.
Common Types of Events in Production Systems
Most production incidents correlate with a small set of event categories that may originate outside the request path:
- Deployments
- Configuration or infrastructure changes
- Feature updates
- Auto-scaling and capacity adjustments
- Failover and recovery actions
These events help you understand system behavior without generating request-level telemetry. Ignoring them could create a blind spot during the investigation.
In a 2023 report, 50% of high-severity incidents were found linked to changes in configuration, deployment, or infrastructure (not code defects alone).
Why Events Provide Critical Investigative Context
During incidents, timing matters. Events provide a temporal reference point.
When latency spikes or error rates rise, teams use event data to narrow the search area. A deployment ten minutes earlier. A configuration change at scale. A feature flag is enabled globally. These signals reduce guesswork.
Without events, teams infer causality indirectly. They correlate metrics with traces and logs alone. This approach works eventually. It costs time.
Events shorten the path to understanding. They explain why normal behavior stopped being normal.
How Events Differ From Metrics and Logs
Metrics aggregate. Logs record execution. Events mark transitions. This distinction matters in practice:
- Metrics smooth behavior across time
- Logs capture internal state and code paths
- Events identify external or structural change
Events are sparse by design. They should be few but meaningful. When events are treated as metrics or verbose logs, they lose value. Well-designed event streams remain stable as systems scale. Poorly designed ones disappear into noise.
Explaining Metric and Trace Anomalies With Events
Metrics surface anomalies. Traces expose execution paths. Neither explains intent.Events bridge that gap:
- A deployment explains a sudden latency regression
- A configuration change explains increased error rates
- A scaling event explains transient saturation
- A feature flag rollout explains partial impact
When events are missing, teams misattribute cause. They chase downstream symptoms. They tune alerts instead of fixing behavior.
MELT treats events as first-class signals because they explain change, not just behavior.
Checkout Service Example: How MELT Signals Differ
Consider an ecommerce checkout service where customers submit payment and complete orders.
At 14:05, the checkout latency suddenly increases and error rates begin to rise.
Here is how each MELT signal contributes:
Metrics:
- Checkout latency p95 increases from 320 ms to 1.8 s.
- Error rate climbs from 0.3% to 4%.
- Database CPU usage spikes.
Metrics tell you that behavior changed and quantify the impact. They answer: how bad is it, and how widespread?
Traces:
- A distributed trace shows the checkout request flowing through the API gateway, payment service, fraud detection service, and database.
- The trace reveals that most of the added latency is in the fraud detection call.
Traces answer: Where in the execution path is time being spent?
Logs:
- Application logs from the fraud service show repeated timeout warnings when calling an external risk scoring API.
- Database logs show connection pool exhaustion.
Logs answer: What exactly happened inside the component?
Events:
- A deployment event at 13:58 shows a new fraud scoring model was released.
- A configuration change event at 14:00 shows the external API timeout was reduced from 2 seconds to 800 ms.
- An auto-scaling event at 14:06 shows new pods were added.
Events answer: What changed before the behavior changed?
Without the event data, teams might spend hours tuning database pools or investigating network saturation. With events, the investigation narrows immediately to the fraud deployment and configuration change.
The Cost of Treating Events as Optional Metadata
Many teams treat events as annotations. They store them in ticketing systems. They bury them in deployment tools. They attach them to dashboards after incidents.
This approach fails under pressure.
When events are optional:
- Investigations start without context
- Metrics and traces get overloaded with inference
- Post-incident analysis becomes speculative
Events deserve the same design discipline as other MELT signals. They require clear ownership, consistent structure, and reliable ingestion. Without that, observability remains reactive.
Logs in MELT: High-Fidelity Evidence of What Happened
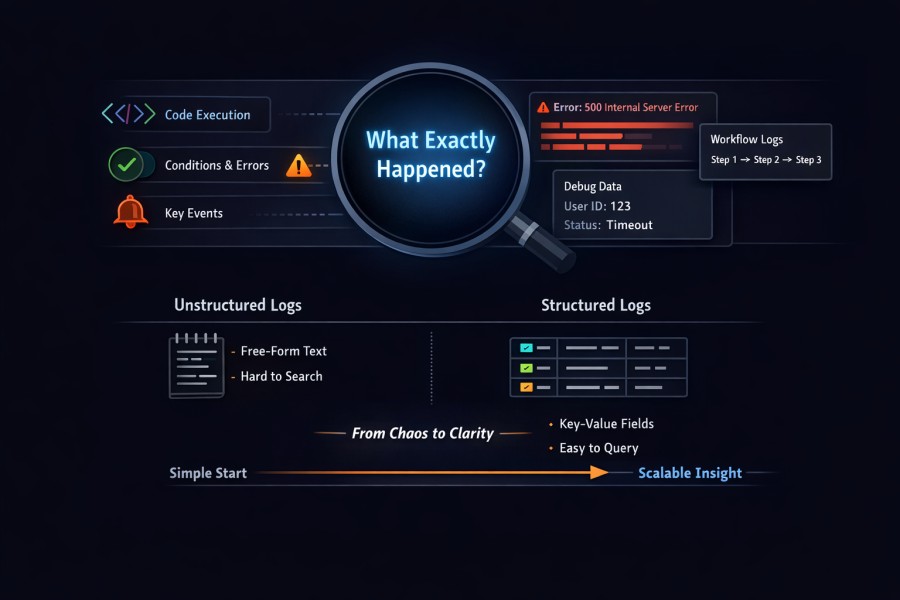
Logs capture detailed records of execution inside a system. They show what code paths ran, which conditions were met, and which errors occurred. Metrics summarize behavior. Events mark change. Logs preserve detail.
Logs answer a precise question:
What exactly happened?
When a request fails, the system may show an error message, stack trace, or contextual fields as logs. When a workflow deviates from normal behaviour, logs show intermediate states that other signals may not represent. This is why logs are vital for deep investigations.
Structured vs Unstructured Logs in Practice
Unstructured logs store free-form text. They are easy to emit and hard to query. Structured logs store key-value fields alongside messages. They support filtering, aggregation, and correlation. In production systems, structure determines usefulness:
- Structured logs enable precise queries and correlation
- Unstructured logs require manual inspection and guesswork
Most teams start with unstructured logs. As systems scale, this approach breaks down. Engineers spend time searching instead of reasoning. Queries become brittle. Important context gets lost in noise. Structured logging does not reduce log volume by itself. It makes volume manageable.
Logs as Forensic Records, Not Monitoring Signals
Logs function best as forensic evidence. They confirm hypotheses formed using other signals.
Using logs for monitoring introduces risk:
- Log volume fluctuates with traffic and code paths
- Absence of logs does not imply system health
- Presence of errors does not imply user impact
Metrics detect change. Events explain timing. Traces reveal flow. Logs confirm findings. When logs are used as the primary signal, investigations slow down and costs rise.
MELT places logs late in the investigative sequence for a reason.
Why Logs Scale Poorly Without Structure and Correlation
Log volume grows with request rate, not system complexity. As traffic increases, log ingestion grows linearly or worse. Without structure, teams compensate by retaining more data and searching longer time ranges.
Correlation changes this dynamic:
- Trace identifiers link logs to execution paths
- Request and tenant identifiers narrow scope
- Consistent fields reduce query cost
Without correlation, logs become isolated artifacts. Engineers read them manually. Automation becomes difficult. Signal quality degrades as systems grow.
The Operational and Cost Risks of Log-Heavy Debugging
Log-heavy debugging can be effective early, but at scale, it can have some tradeoffs:
- Manual search slows incident response
- More stress during outages
- Inconsistent investigation outcomes
Cost also compounds over time as log ingestion scales with traffic, and retention costs grow quickly. Queries also become expensive under load. Despite offering late-stage insights during incidents, logs account for the larger observability spend in high-traffic systems.
However, in MELT, logs are high-value evidence, which don’t replace metrics, events, or traces. This preserves both clarity and cost control.
Traces in MELT: Understanding Flow, Causality, and Latency
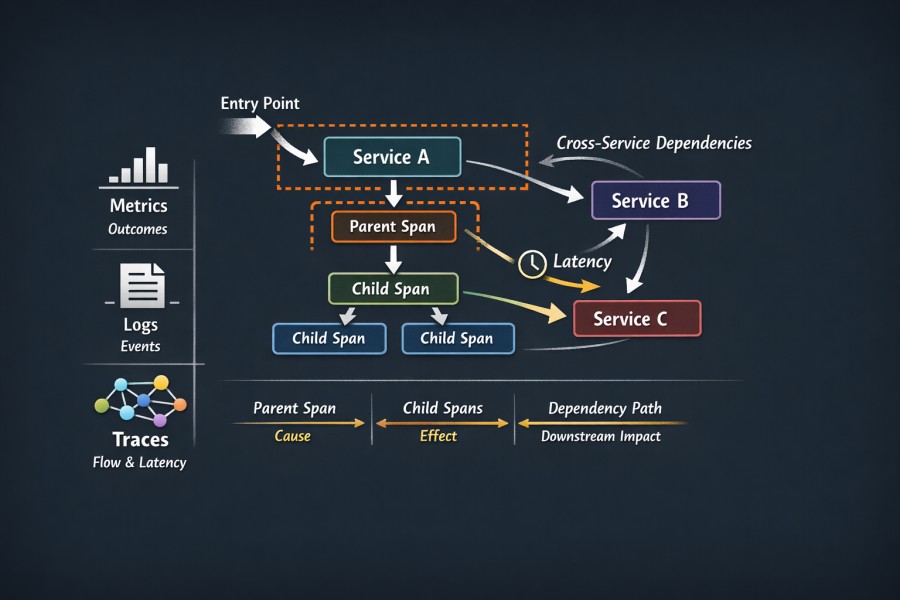
Traces are records that show how a request moves inside a system. They capture the complete execution path from entry to completion point. This includes components, such as services, dependencies, and hops, that participate in request handling.
Metrics summarize outcomes. Logs record events inside components.
But traces connect actions across boundaries. They answer a critical question:
Where did time go?
In distributed systems, performance problems rarely live in one place. Traces expose cross-service interactions that other signals cannot reconstruct.
Spans, Service Boundaries, and Dependency Paths
A trace is composed of spans. And each span is a unit of work. Spans form a causal graph whose important elements are:
- Service boundaries: define ownership and responsibility
- Parent and child spans: establish execution order
- Dependency paths: reveal downstream impact
Without clear span boundaries, traces don’t mean anything. And without consistent service naming, dependency graphs break. You need disciplined instrumentation to get quality tracing.
Fan-Out, Retries, and Async Execution in Traces
Modern systems involve parallel and asynchronous work. Requests fan out to caches, databases, queues, and third-party APIs. Moreover, retries and backoff strategies make the process more complex.
- Fan-out may appear as parallel child spans
- Retries may appear as repeated spans with timing gaps
- Async execution appears as detached or delayed spans
These patterns explain tail latency. A small percentage of requests experience slow paths. Metrics and logs may hide it, but traces reveal it.
Why Traces Matter for Performance and Root Cause Analysis
Performance issues depend on causality. Traces preserve that causality.
When latency increases, traces identify the slow dependency. When errors spike, traces show where failures originate and how they propagate. During incidents, this reduces speculation and accelerates resolution.
Industry research supports this. Distributed tracing narrow investigation scope early. It helps reduce the mean time to resolution for latency-related incidents. This way, traces complete other signals.
Why Traces Are the Hardest MELT Signal to Keep Reliable at Scale
Tracing pipelines fail first under load. This happens for predictable reasons.
Tracing generates high-volume data. Each request produces multiple spans, and fan-out multiplies that volume. Without sampling and backpressure control, pipelines overload.
Common failure modes include:
- Dropped spans during traffic spikes
- Broken context propagation across async boundaries
- Incomplete traces due to partial instrumentation
Tracing is one of the first signals teams reduce during incidents due to cost and reliability pressure.
With MELT, you turn to intentional design, sampling strategy, and operational discipline. When maintained correctly, traces provide unmatched insight into system behavior. When neglected, they create false confidence.
How MELT Signals Work Together During Incidents
Metrics as Early Warning Signals and Symptom Detectors
Incidents are not clearly visible. They begin as deviations, and metrics highlight those deviations first. Metrics perform three critical functions during the early phase of an incident:
- Detect that system behavior changed
- Quantify the scope and impact of that change
- Direct attention to affected services or resources
Latency percentiles change, and error ratios climb. These are fast, stable, and continuous signals that work under load and across scale.
Metrics answer if something has changed, but don’t explain why behind that change. Treating metrics as explanatory signals leads to over-instrumentation and false confidence. Mature teams use metrics to trigger investigation, not to complete it.
Events as Explanations for Behavioral Change
Once metrics confirm abnormal behavior, timing becomes critical. Events provide that temporal anchor. Events explain change that originates outside the request path:
- Deployments and rollouts
- Configuration updates
- Feature flag activations
- Auto-scaling and capacity shifts
These actions reshape system behavior without appearing in metrics or traces directly. Without events, teams reconstruct intent after the fact. That reconstruction is slow and error-prone.
Events narrow the investigation window. They convert an open-ended search into a bounded one. In high-pressure incidents, this reduction in ambiguity matters more than raw data volume.
Traces as the Source of Causality and Execution Insight
Metrics identify symptoms, and events explain timing. But traces reveal causality. They show how a request actually flows through a system:
- Which services participated?
- Where does latency accumulate?
- Which dependencies failed or retried?
- How does fan-out amplify impact?
It’s hard to get these insights from metrics or logs alone. Since traces preserve the interactions between components in a system, they help you understand:
- Why only a subset of requests failed?
- Why did tail latency spike while averages looked stable?
- Why did downstream services degrade after an upstream change?
Logs as Confirmation and Detailed Evidence
Logs provide detail and validate conclusions:
- Error messages and failure modes
- Internal state transitions
- Edge cases and unexpected code paths
This information is essential for remediation. It is inefficient for discovery.
When teams begin investigations with logs, they search without direction. When they arrive at logs with context from metrics, events, and traces, they move quickly and decisively. MELT places logs at the point where precision is required, not where orientation is needed.
Why Effective Investigation Flows Across Signals
Incidents impose cognitive pressure. Teams must reason quickly with preliminary information.
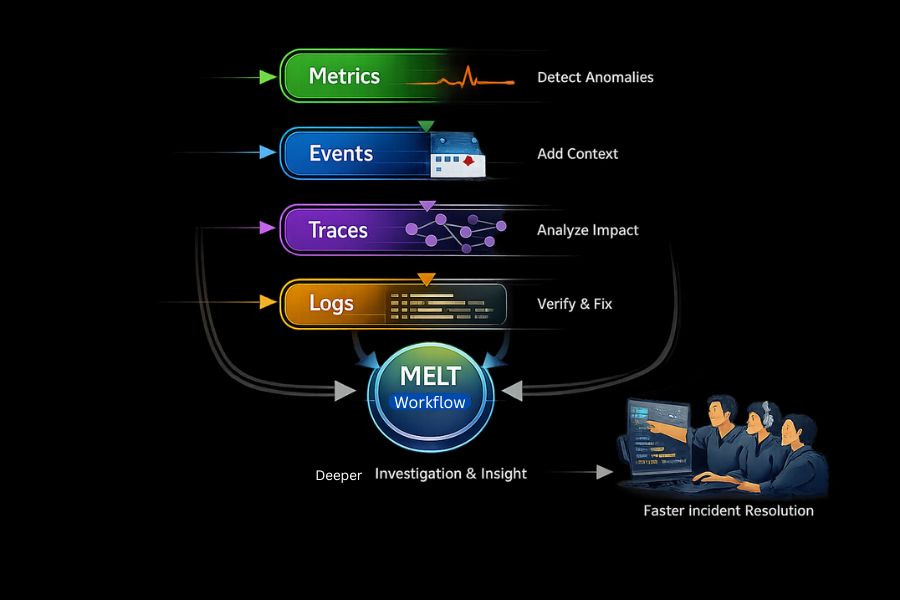
Effective investigation needs this workflow:
- Metrics: detect abnormal behavior
- Events: explain contextual change
- Traces: reveal the impact of execution and dependency
- Logs: confirm findings and guide fixes
If you rely on a single signal, this flow will break. Teams could extract answers from data, but it’s not enough for a deep investigation. This results in longer outages and inconsistent outcomes.
MELT exists to codify this investigative sequence. It gives teams a shared map for navigating incidents. In complex systems, that shared understanding reduces resolution time more reliably than any single tool or dataset.
MELT Signals Compared: Metrics vs Events vs Logs vs Traces
| Signal | What it answers | When it is most useful | Key limitation |
| Metrics | Did something change? | Detecting anomalies, trends, and SLO breaches | Does not explain cause or execution flow |
| Events | What changed? | Explaining behavioral shifts and timing | Does not show request-level impact |
| Logs | What exactly happened? | Validating errors and internal state | Scales poorly without structure and context |
| Traces | How much time has a request spent with which component and why? How did the request flow? | Understanding latency, dependencies, and causality | Expensive and fragile without careful design |
A Practical MELT Use Case: How Signals Work Together During a Real Incident
Consider a production e-commerce application that runs on Kubernetes. It’s composed of an API gateway, a checkout service, a payments service, and multiple third-party dependencies.
Step 1: Metrics detect abnormal behavior
During peak traffic, engineers notice a spike in p95 checkout latency and a gradual increase in HTTP 5xx error rates for the checkout service. CPU and memory metrics appear normal. Alerts fire based on SLO burn rates.
At this stage, metrics confirm impact and scope but provide no explanation.
Step 2: Events explain what changed around the same time
The team correlates metric anomalies with recent deployment and configuration events. A feature flag enabling a new fraud-detection call was rolled out globally 15 minutes before latency increased.
This immediately narrows the investigation window. Instead of inspecting the entire system, engineers focus on recent changes that could affect the checkout path.
Step 3: Traces reveal causality and where time is spent
Distributed traces show that most checkout requests fan out into multiple downstream calls. A new synchronous call to an external fraud service introduces retries and long tail latency. Only a subset of requests is affected, which explains why averages look stable while p95 and p99 degrade.
Traces answer the critical question metrics cannot:
Where did time go, and why only for some requests?
Step 4: Logs confirm failure modes and internal behavior
With context from traces, engineers inspect logs only for the affected spans. Logs reveal timeout errors, retry exhaustion, and specific error codes returned by the fraud service.
Logs provide confirmation and evidence needed to fix the issue, not discovery.
Outcome
The team rolls back the feature flag, latency normalizes, and error budgets stabilize.
Because MELT signals were used in sequence, the incident is resolved quickly without chasing noise or over-instrumenting metrics.
This example highlights why MELT is not about collecting more telemetry, but about using the right signal at the right time.
Implementing MELT with OpenTelemetry
OpenTelemetry (OTel) provides a standard way to generate and export metrics, logs, and traces. It aligns with the MELT model at the telemetry layer.
- Metrics are emitted as time series data with defined types and attributes
- Logs are generated as structured records with contextual fields
- Traces are captured as spans linked by a shared execution context
This mapping removes ambiguity right at the data source. Teams instrument once and produce consistent signals across services. MELT remains the mental model. OpenTelemetry becomes the delivery mechanism.
Where Events Fit in Modern Telemetry Pipelines
Apart from the application code, events in observability are generated through:
- CI and CD systems during deployments
- Configuration and secrets management tools
- Feature flag platforms
- Auto-scaling and orchestration systems
OpenTelemetry doesn’t prescribe a single event format. So, teams must treat events as structured records that share context with other signals. When events carry consistent identifiers and timestamps, they become first-class inputs into MELT-focused investigations.
Context Propagation Across Signals
Context propagation connects metrics, logs, and traces. It ensures that signals emitted by the same request or operation can be correlated later.
OpenTelemetry handles this through:
- Trace and span identifiers
- Resource and service attributes
- Standardized context propagation mechanisms across protocols
When context propagation is reliable, teams can move across signals without losing continuity. Metrics point to affected services. Traces reveal execution paths. Logs confirm behavior. Without shared context, each signal becomes an isolated artifact.
Context propagation is not optional. It determines whether MELT works in practice or only on paper.
The OpenTelemetry Collector as a Control Layer
The OpenTelemetry Collector sits between telemetry producers and backends, and acts as a routing and control layer. Its main responsibilities are:
- To receive telemetry from multiple sources
- To enrich signals with additional attributes
- To filter, sample, and transform data
- To export telemetry to one or more backends
This separation allows teams to adjust data flow without redeploying any application. It also centralizes decisions about volume, routing, and policy enforcement.
The Collector enforces discipline when teams already have a clear signal strategy.
What OpenTelemetry Does and Does Not Standardize
OpenTelemetry standardizes telemetry emission. It defines how signals are generated, structured, and transported. It does not define how data should be analyzed, stored, or interpreted.
This distinction is intentional:
- OpenTelemetry ensures portability and consistency
- Observability outcomes depend on signal design and usage
Teams still decide what to instrument, what to retain, and how to investigate incidents. MELT provides the reasoning framework. OpenTelemetry provides the plumbing.
When teams expect OpenTelemetry to deliver observability by itself, they are disappointed. When they pair it with a clear MELT model, they gain durable clarity across systems.
Volume, Cardinality, and Cost Across MELT Signals
Each MELT signal scales according to a different pressure. Treating them as equivalent leads to cost surprises.
Metrics scale with label combinations. Logs scale with traffic and code paths. Traces scale with request volume and fan-out. Events scale with change frequency and usually remain stable.
As systems grow, these differences compound. A service that doubles traffic does not double observability cost uniformly. Logs and traces grow faster. Metrics grow faster when labels proliferate. Events rarely dominate volume.
Understanding these scaling characteristics is a prerequisite for cost control. MELT makes these differences explicit so teams can design signals intentionally.
Metric Cardinality Risks and Label Explosion
Metric cardinality defines how many unique time series a system produces. It is the dominant cost driver in metric backends.
High-cardinality labels introduce risk:
- User IDs, request IDs, and session IDs multiply time series
- Dynamic labels prevent effective aggregation
- Query performance degrades as series count grows
Cardinality issues often emerge gradually. Teams add labels to answer new questions. Over time, dashboards slow down and alerting becomes unreliable.
According to Google Cloud documentation on monitoring scalability, high-cardinality metrics are one of the most common causes of metric ingestion limits and query instability in production environments.
Metrics remain cost-effective when they describe system behavior, not individual requests. MELT places metrics at that aggregate level by design.
Log Volume Growth and Retention Pressure
Log volume grows with request rate, not system complexity. As traffic increases, log ingestion increases linearly or worse.
Several factors accelerate log growth:
- Debug-level logging left enabled in production
- Unstructured logs that require broader retention
- Log-heavy debugging during incidents
Retention compounds the problem. Logs are often retained for weeks or months for compliance or audit reasons. Storage and query costs accumulate quietly.
Industry surveys consistently show logs as the largest contributor to observability spend in high-traffic systems. For example, the CNCF Observability Whitepaper notes that log data frequently dominates storage costs due to volume and retention requirements.
MELT treats logs as high-value evidence, not as the primary investigative signal. This positioning reduces both volume and retention pressure.
Trace Fan-Out and Sampling Challenges
Tracing cost grows with request complexity. Each request produces multiple spans. Fan-out multiplies that number.
Modern systems amplify this effect:
- Parallel calls generate multiple child spans
- Retries duplicate execution paths
- Async workflows extend trace lifetimes
Without sampling, tracing pipelines overload quickly. With aggressive sampling, traces lose representativeness. Balancing this trade-off is difficult. Effective tracing requires intentional sampling strategies and backpressure controls.
Why Poor MELT Design Leads to Unpredictable Costs
Unpredictable observability cost is rarely a tooling failure. It is a signal design failure.
Common causes include:
- Using metrics to explain per-request behavior
- Using logs as the primary investigative tool
- Collecting traces without a sampling strategy
- Ignoring events and inferring intent indirectly
These choices shift load onto the most expensive signals. Costs rise non-linearly. Teams respond by cutting data reactively, often during incidents.
MELT provides a preventative framework. It aligns each signal with the questions it answers best. When teams respect those boundaries, observability costs become predictable. When they ignore them, cost control becomes an ongoing fire drill.
Common MELT Anti-Patterns Teams Fall Into
Metrics-Only Observability Strategies
Many teams rely almost entirely on metrics. Dashboards look complete. Alerts are well-tuned. Incidents still take too long to resolve.
Metrics detect that behavior changed. They do not explain why. When teams stop at metrics, investigations stall early. Engineers add more labels and more charts to compensate. Cardinality increases. Costs rise. Clarity does not.
Metrics work best as entry points. Using them as the sole source of truth limits observability maturity.
Using Logs as a Substitute for Tracing
Logs are familiar. They feel concrete. Teams reach for them first.
This habit creates predictable problems:
- Engineers search large log volumes without direction
- Performance issues require manual reconstruction
- Cross-service behavior remains implicit
Logs record what happened inside a component. They do not preserve execution flow across services. When logs replace tracing, teams debug symptoms instead of understanding causality.
Tracing exists to solve this exact problem. Avoiding it pushes complexity onto humans.
Ignoring Events During Incident Response
Events are often treated as secondary data. They live in deployment tools, ticketing systems, or change logs. During incidents, they are consulted late or not at all.
This omission matters. Many incidents correlate directly with change:
- A rollout that altered request paths
- A configuration update that affected timeouts
- A scaling action that shifted the load
Without events, teams infer intent from metrics and traces alone. That inference takes time and introduces doubt. Events provide immediate context. Ignoring them forces teams to work harder than necessary.
Collecting Traces Without a Sampling or Retention Strategy
Tracing is powerful and fragile. Collecting every trace without constraints overwhelms pipelines. Sampling everything aggressively removes the traces that matter most.
Common failure modes include:
- Dropping spans during traffic spikes
- Retaining traces for inconsistent durations
- Losing high-latency or error paths due to naive sampling
Tracing requires intent. Sampling and retention policies must reflect investigative goals. Without them, traces create false confidence. Teams believe they have coverage. In practice, they have gaps.
Equating Data Collection With Observability Maturity
High data volume often signals low observability maturity. Teams collect more data when answers are unclear.
This pattern repeats:
- Add more metrics to explain incidents
- Increase log verbosity during outages
- Expand trace retention without improving analysis
Observability maturity depends on signal quality and usage, not quantity. MELT exists to impose discipline. Each signal has a role. Collecting everything blurs those roles. Teams mature when they ask better questions, not when they ingest more data.
How CubeAPM Aligns With the MELT Model in Practice
CubeAPM is designed around the idea that observability fails not because teams lack data, but because signals are collected and priced without regard to intent.
MELT-aligned signal design
CubeAPM treats metrics, events, logs, and traces as distinct investigative tools, not interchangeable data streams:
- Metrics are optimized for low cardinality, stable baselines, and reliable SLO tracking.
- Events are treated as first-class signals that make deployments, configuration changes, and infrastructure actions easy to correlate with system behavior.
- Traces preserve causality across services with intentional sampling strategies. This way, tail latency and error paths are retained.
- Logs are structured and correlated with traces, reducing blind search and unnecessary retention
This separation ensures that each signal answers the question it is best suited for, without pushing investigative load onto the most expensive data types.
Predictable cost and control at scale
Many observability platforms penalize teams for doing the “right thing” by making logs and traces disproportionately expensive. This often forces teams to cut data reactively during incidents.
CubeAPM’s self-hosted and cost-controlled approach allows teams to:
- Retain critical traces without aggressive sampling driven by pricing
- Keep logs scoped, structured, and correlated instead of verbose
- Maintain events as lightweight, high-context signals
- Scale observability without unpredictable ingestion costs
MELT as a workflow, not just telemetry
CubeAPM supports MELT as an operational workflow:
- Metrics detect change
- Events explain intent
- Traces reveal causality
- Logs confirm and remediate
By preserving this flow, teams reduce mean time to resolution and avoid metric cardinality explosions. This also prevents log-driven debugging from becoming the default.
In practice, CubeAPM enables teams to apply MELT consistently as systems grow instead of abandoning discipline under cost or scale pressure.
Key Takeaways: How to Use MELT Effectively
MELT framework: MELT is a way of thinking about system behavior. It is neither a tooling checklist nor does it promise insight by default. Teams benefit from MELT when it helps them decide what data to instrument, what to retain, and how to investigate incidents under pressure.
Correlation: Observability improves through MELT correlation. Insight comes from moving across signals with shared context, consistent attributes, and clear intent. Without correlation, even large volumes of telemetry remain difficult to explain.
Signal quality: Signal quality and intent are more important than signal quantity. Mature teams collect fewer signals with a clearer purpose. They keep metrics with low cardinality, sparse and meaningful events, structured and scoped logs, and relevant traces.
Disclaimer: The information in this article reflects the latest details available at the time of publication and may change as technologies and products evolve.
FAQs
1. What is MELT in observability?
MELT is a framework that groups observability signals into Metrics, Events, Logs, and Traces. Each signal captures a different aspect of system behavior. MELT helps teams understand when to use each signal and how they work together during monitoring and incident investigation.
2. How are events different from logs in MELT?
Events represent meaningful state changes, such as deployments or configuration updates, while logs are detailed records of what happened inside a system. Events explain why behavior changed, whereas logs provide evidence of what happened. Treating events as logs often leads to missing critical context.
3. Do you need all four MELT signals to practice observability?
Not immediately, but relying on only one or two signals creates blind spots. Metrics are best for detecting issues, traces for understanding causality, logs for confirmation, and events for context. Mature observability practices evolve toward using all four together.
4. How does MELT relate to OpenTelemetry?
MELT is a conceptual model, while OpenTelemetry is a technical standard for generating and exporting telemetry data. OpenTelemetry enables metrics, logs, and traces to be emitted consistently, making it easier to implement MELT in practice, but it does not enforce how signals are interpreted or correlated.
5. Does using MELT reduce observability costs?
MELT does not reduce costs by itself, but it helps teams design smarter telemetry. By understanding which signals are appropriate for which questions, teams can avoid over-collecting logs or traces and reduce waste caused by high cardinality and uncontrolled data volume.


